. 2025 Jun 4;19(6):jjaf084.
doi: 10.1093/ecco-jcc/jjaf084.

Restoring Prostacyclin/PGI2-PTGIR signaling alleviates intestinal fibrosis in Crohn's disease via fibroblast-specific YAP/TAZ inhibition

Affiliations

Restoring Prostacyclin/PGI2-PTGIR signaling alleviates intestinal fibrosis in Crohn's disease via fibroblast-specific YAP/TAZ inhibition

Weijun Ou et al. J Crohns Colitis. .

Abstract

Background and aims: Intestinal obstruction caused by fibrosis is a common and serious complication of Crohn's disease (CD). Yes-associated protein (YAP) and transcriptional coactivator with PDZ-binding motifs (TAZ), the transcriptional effectors of the Hippo signaling pathway, have emerged as key drivers of intestinal fibrosis. Systematic inhibition of YAP/TAZ failed to combat fibrotic progression, probably due to the vital role of epithelial YAP/TAZ in intestinal homeostasis.

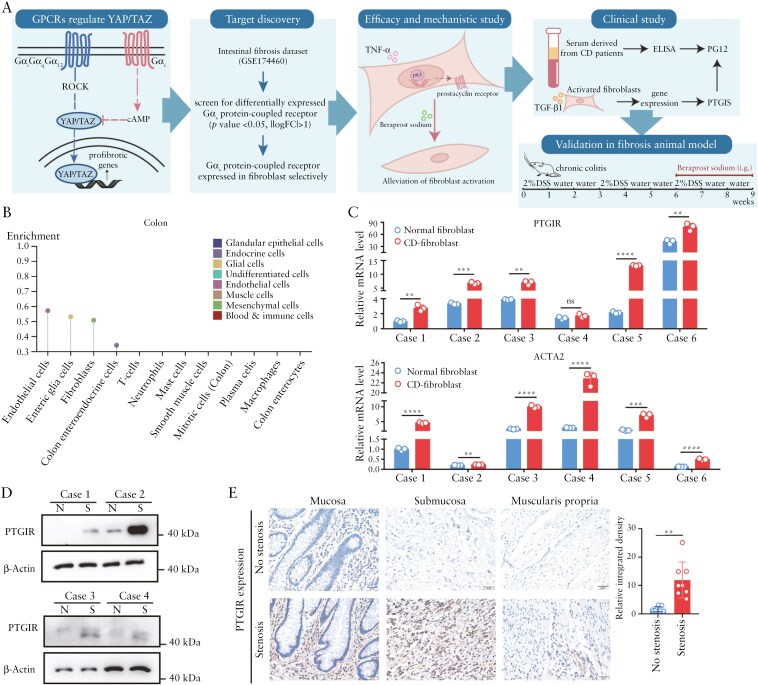
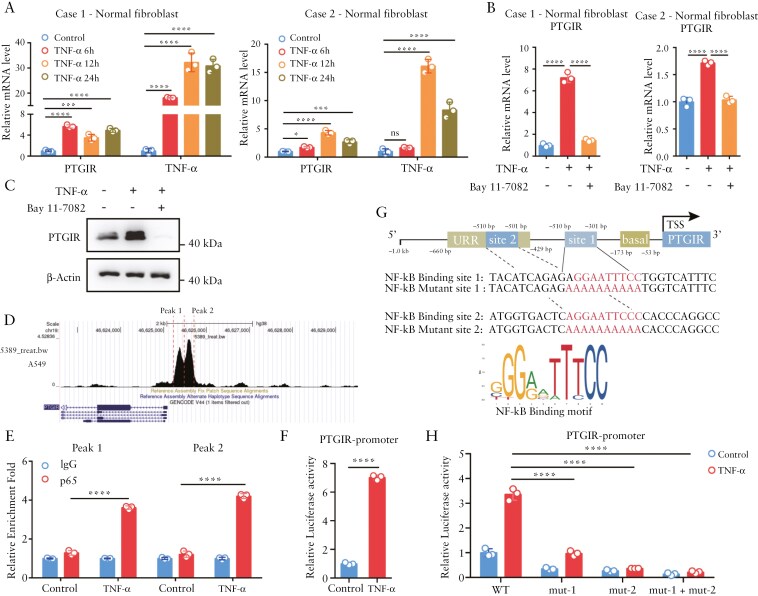
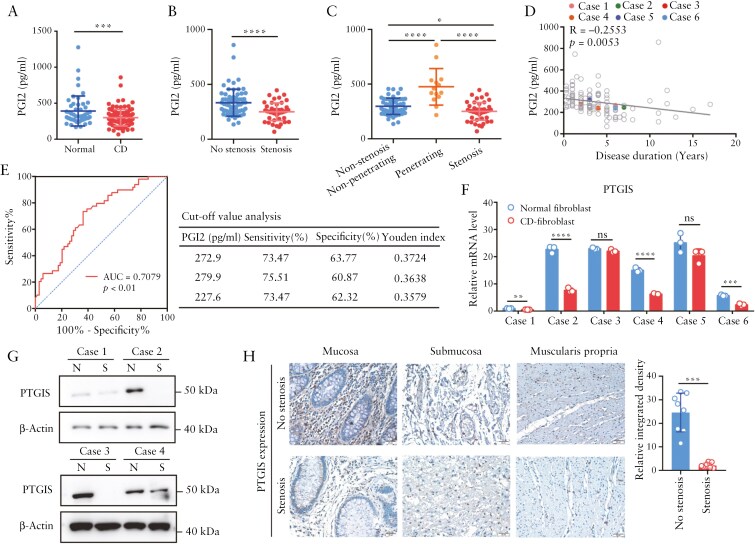
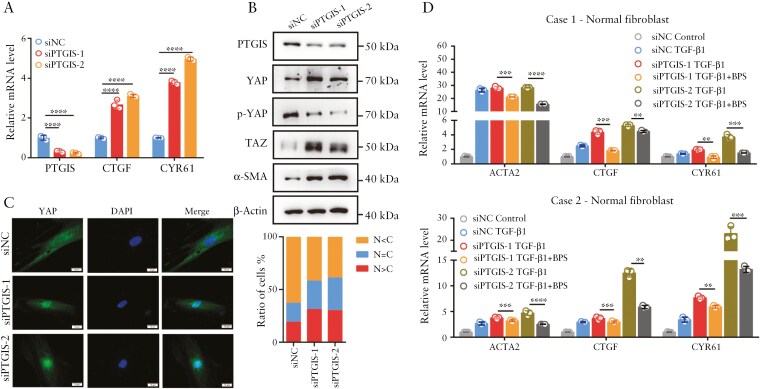
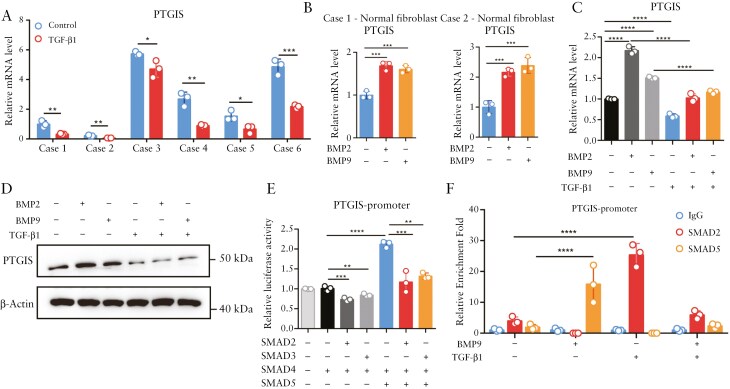
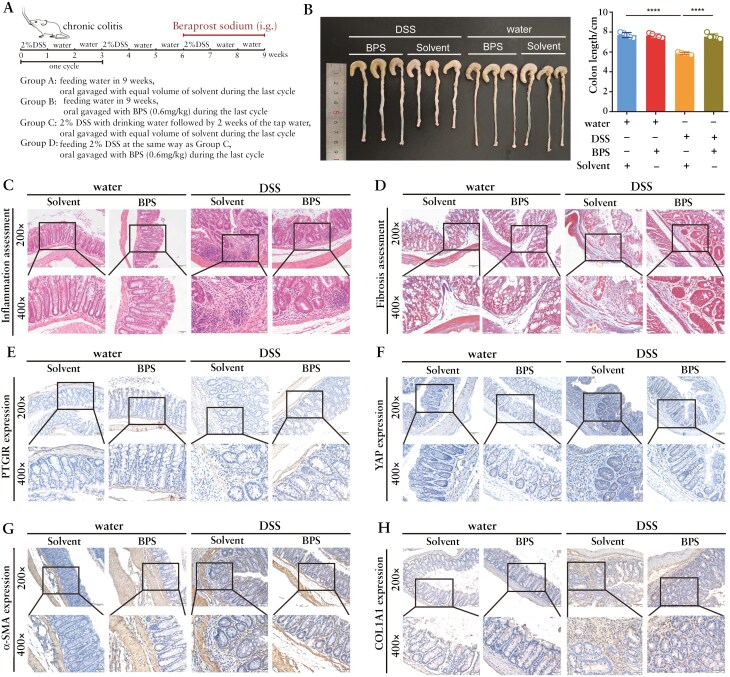
Methods: Enzyme-Linked Immunosorbent Assay (ELISA) and immunohistochemical staining were used to detect serum Prostaglandin I2 (PGI2) levels and PGI2 Receptor (PTGIR) in clinical samples derived from CD patients. Dual luciferase reporter and Cut & Run assays were performed to explore the transcriptional regulatory mechanisms of PTGIR and PGI2 synthase (PTGIS) by tumor necrosis factor α (TNF-α) and transforming growth factor-beta (TGF-β), respectively. Primary intestinal fibroblasts and a chronic colitis model were used for assessing the efficacy of a PTGIR agonist in combating fibrosis.

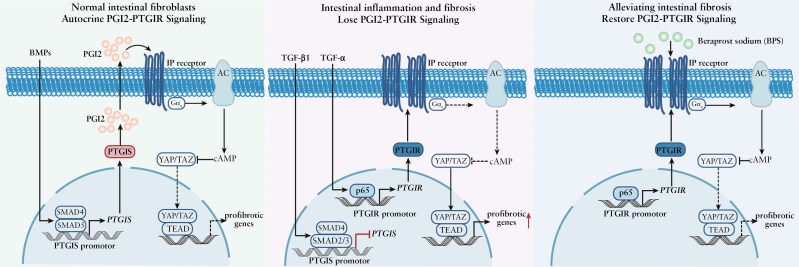
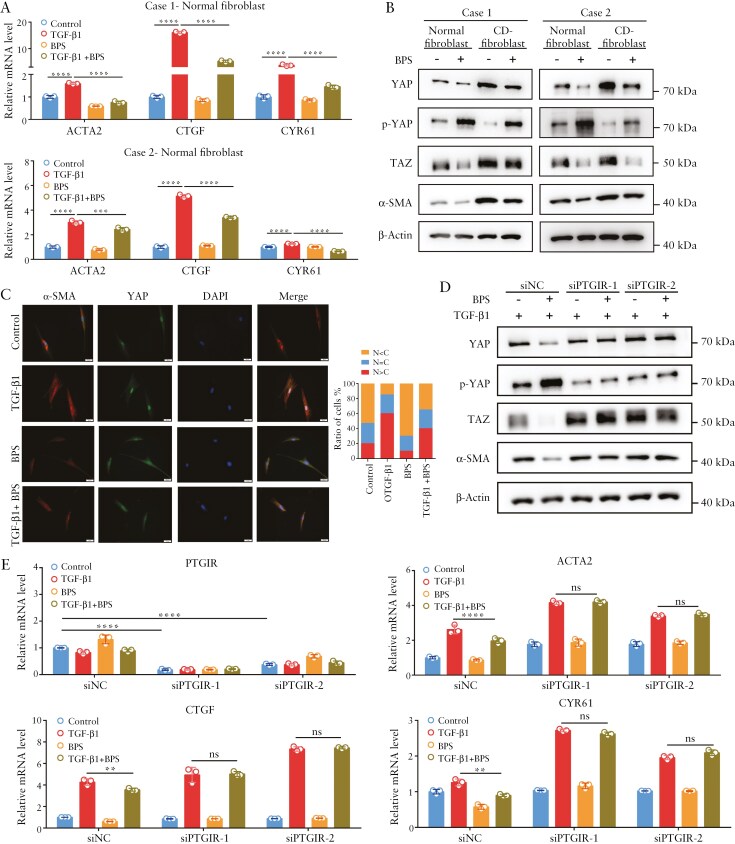
Results: The Gαs-coupled PTGIR is expressed in intestinal fibroblasts but is barely expressed in intestinal epithelial cells. PTGIR transcription is directly activated by p65 in fibroblasts upon TNF-α stimulation. Importantly, PTGIS is transcriptionally suppressed by TGF-β, leading to the loss of endogenous antifibrotic PGI2-PTGIR signaling. Serum PGI2 levels are decreased in CD patients with stenosis and are negatively correlated with disease duration. The PTGIR agonist inhibited the profibrotic function of YAP/TAZ in intestinal fibroblasts in vitro and reversed intestinal fibrosis in vivo.

Conclusions: The antifibrotic effects of PGI2-PTGIR signaling are impaired in CD. Restoring PGI2-PTGIR signaling is a pharmacologically tractable and cell-selective approach to targeting YAP/TAZ via PTGIR, which reverses intestinal fibrosis.

Keywords: Crohn’s disease; intestinal fibrosis; prostacyclin.


Conflict of interest statement

A patent application about predicting intestinal fibrosis via PGI2 detection has been filed.

Figures

Graphical Abstract
Graphical Abstract
Figure 1.
Figure 1.
Fibroblast PTGIR expression is increased in the stenotic intestine. (A) A schematic diagram of the identification, functional, and clinical validation of PGI2-PTGIR signaling in this study. (B) PTGIR expression patterns in different tissue cell types. Data were extracted from the Human Protein Atlas. (C) PTGIR and ACTA2 expression was detected in fibroblasts isolated from stenotic and nonstenotic areas of intestines from CD patients via qPCR. (D) Western blot analysis of PTGIR expression in 4 pairs of intestinal fibroblasts derived from stenotic and nonstenotic tissues. (E) Representative images of immunohistochemical staining and semiquantitative analysis of PTGIR expression in different layers of stenotic and nonstenotic intestinal tissues from CD patients (n = 8). Scale bar = 20 μm. In all cases, the bars in the graphs represent the mean ± S.D. Statistical analyses were performed via Student’s t test (C) and the Mann‒Whitney U test (E). Significant differences are shown by **P < .01, ***P < .001, and ****P < .0001.
Figure 2.
Figure 2.
PTGIR agonism reverses profibrotic phenotypes by interfering with YAP/TAZ. (A) The effects of the PTGIR agonist BPS on ACTA2 and the target genes of YAP/TAZ in intestinal fibroblasts treated with TGF-β1 were evaluated by qPCR. (B) The effects of the PTGIR agonist BPS on the expression of the YAP/TAZ proteins were analyzed via Western blotting. (C) Representative images of immunofluorescence staining showing the effect of the PTGIR agonist on YAP localization. Scale bar = 20 μm. (D) Intestinal fibroblasts were transfected with PTGIR siRNA for 2 days before the effect of the PTGIR agonist on YAP/TAZ expression was evaluated via Western blotting. (E) The effects of the PTGIR agonist on the mRNA levels of ACTA2 and YAP/TAZ target genes in intestinal fibroblasts with PTGIR knockdown were analyzed via qPCR. In all cases, the bars in the graphs represent the mean ± S.D. Statistical analyses were performed via one-way ANOVA. Significant differences are shown by **P < .01, ***P < .001, and ****P < .0001.
Figure 3.
Figure 3.
p65 directly activates PTGIR gene transcription in intestinal fibroblasts stimulated with TNF-α. (A) The mRNA levels of PTGIR were detected via qPCR in intestinal fibroblasts stimulated with TNF-α (10 ng/mL) for the indicated times. (B) PTGIR expression was detected via qPCR in intestinal fibroblasts pretreated with Bay 11-7082 (30 µM) for 1 h and subsequently stimulated with TNF-α for 4 h. (C) Western blot analysis of PTGIR expression in intestinal fibroblasts treated with TNF-α (10 ng/mL, 12 h) and Bay 11-7082 (30 µM, 4 h). (D) Representative sequencing tracks of the p65 ChIP-seq data at the PTGIR genomic locus. Data were extracted from the Cistrome DB database. (E) CUT&RUN analysis of p65 binding to the PTGIR promoter in intestinal fibroblasts stimulated with TNF-α (10 ng/mL) for 24 h. (F) Luciferase reporter analysis of the PTGIR promoter reporter stimulated by TNF-α. HEK-293T cells were transfected with the PTGIR promoter for 24 h and stimulated with TNF-α (10 ng/mL) for 24 h before luciferase activity was detected. (G) Schematic depiction of the PTGIR gene locus showing potential NF-κB binding sites and the corresponding DNA sequence of the mutant PTGIR luciferase reporter. The known basal core promoter and upstream repressor region of the PTGIR gene are indicated. (H) Luciferase reporter assay of PTGIR WT and mutant promoter reporters in HEK-293T cells stimulated with TNF-α (10 ng/mL) for 24 h. In all cases, the bars in the graphs represent the mean ± S.D. Statistical analyses were performed via one-way ANOVA (A, B, E, H) and Student’s t test (F). Significant differences are shown by *P < .05, **P < .01, ***P < .001, and ****P < .0001.
Figure 4.
Figure 4.
Downregulation of PGI2 and PTGIS in patients with CD with stenosis. (A) PGI2 levels in the serum of healthy controls and patients with CD were detected via ELISA. (B) PGI2 levels in the serum of stenotic and nonstenotic CD patients were compared. (C) Subgroup analysis of serum PGI2 levels in CD patients with different disease behaviors. (D) Pearson correlation analysis of the serum PGI2 levels and disease duration of CD patients (n = 118). (E) Receiver operating characteristic curve of the PGI2 level in the serum for the prediction of stenosis in CD patients. The Youden index was used to analyze the cutoff value of the PGI2 level in serum, and the maximum Youden index was 0.3724, with a sensitivity of 73.47% and specificity of 63.77% at the cutoff value of 272.9 pg/mL. (F) PTGIS expression was detected in fibroblasts isolated from stenotic and nonstenotic areas of intestines from CD patients via qPCR. (G) Western blot analysis of PTGIR expression in 4 paired fibroblasts isolated from stenotic and nonstenotic areas of intestines from CD patients. (H) Representative images of immunohistochemical staining of PTGIS protein in different layers of stenotic and nonstenotic intestinal tissue from CD patients. A semiquantitative immunohistochemical score was used for statistical analysis (n = 8). In all cases, the bars in the graphs represent the mean ± S.D. Statistical analyses were performed via Student’s t test for (A-B, F), one-way ANOVA for (C), Pearson’s correlation for (D) and the Mann‒Whitney U test for (H). Significant differences are shown by *P < .05, **P < .01, ***P < .001, and ****P < .0001.
Figure 5.
Figure 5.
PTGIS is a negative regulator of YAP/TAZ in intestinal fibroblasts. (A) qPCR analysis of YAP/TAZ target genes in intestinal fibroblasts derived from stenotic intestines with PTGIS knockdown. (B) Western blot analysis of the effects of PTGIS knockdown on YAP/TAZ activation and α-SMA expression. (C) Representative images of immunofluorescence staining of YAP in intestinal fibroblasts derived from stenotic intestines with PTGIS knockdown. Scale bar = 20 μm. (D) The elevated mRNA levels of ACTA2 and YAP/TAZ target genes in PTGIS-knockdown intestinal fibroblasts were reversed by the PTGIR agonist BPS. In all cases, the bars in the graphs represent the mean ± S.D. Statistical analyses were performed via one-way ANOVA. Significant differences are shown by **P < .01, ***P < .001, and ****P < .0001.
Figure 6.
Figure 6.
TGF-β-SMAD2/3 counteracts the transcriptional activation of PTGIS by BMP2/9-SMAD5 in intestinal fibroblasts. (A) qPCR analysis of the mRNA levels of PTGIS in normal intestinal fibroblasts treated with TGF-β1 (10 ng/mL, 24 h). (B) qPCR analysis of the mRNA levels of PTGIS in normal intestinal fibroblasts treated with BMP2 (10 ng/mL, 24 h) or BMP9 (10 ng/mL, 24 h). (C) qPCR analysis of PTGIS mRNA levels in normal intestinal fibroblasts treated with BMP2 (10 ng/mL, 24 h) or BMP9 (10 ng/mL, 24 h) alone or cotreated with TGF-β1 (10 ng/mL, 24 h). (D) Western blot analysis of PTGIS protein levels in normal intestinal fibroblasts treated with BMP2 (10 ng/mL, 24 h) or BMP9 (10 ng/mL, 24 h) alone or in combination with TGF-β1 (10 ng/mL, 24 h). (E) A luciferase reporter assay was used to analyze the effects of SMAD2/3 and SMAD5 on the transcriptional activity of the PTGIS promoter in HEK-293T cells. (F) CUT&RUN analysis of SMAD2 or SMAD5 binding to the PTGIS promoter in intestinal fibroblasts stimulated with TGF-β1 (10 ng/mL) and/or BMP9 (10 ng/mL) for 24 h. In all cases, the bars in the graphs represent the mean ± S.D. Statistical analysis was performed via Student’s t test for (A) and one-way ANOVA for (B-C, E-F). Significant differences are shown by *P < .05, **P < .01, ***P < .001, and ****P < .0001.
Figure 7.
Figure 7.
PTGIR agonist reverses intestinal fibrosis in a chronic colitis murine model. (A) Schematic diagram of PTGIR agonist treatment in a DSS-induced chronic colitis model. The mice were treated with 2% DSS to induce chronic inflammation and then with solvent or PTGIR agonist via oral gavage during the last cycle of colitis induction. (B-D) Colorectal length (B), representative images of hematoxylin‒eosin-stained sections (C) and Masson’s trichrome-stained sections (D) of the distal colon in mice subjected to different treatments. Scale bars = 50 μm (upper panels) and 20 μm (lower panels). (E-H) Representative immunohistochemical images showing PTGIR (E), YAP (F), α-SMA (G), and COL1A1 (H) expression in colonic tissues from mice subjected to different treatments. Scale bars = 50 μm (upper panels) and 20 μm (lower panels). In all cases, the bars in the graphs represent the mean ± S.D. Statistical analyses were performed via one-way ANOVA. Significant differences are shown by ****P < .0001.

Similar articles

References

    1. D’Haens G, Rieder F, Feagan BG, et al. ; International Organization for Inflammatory Bowel Disease Fibrosis Working Group. Challenges in the pathophysiology, diagnosis, and management of intestinal fibrosis in inflammatory bowel disease. Gastroenterology. 2022;162:26–31. https://doi.org/ 10.1053/j.gastro.2019.05.072 - DOI - PMC - PubMed
    1. Wang J, Lin S, Brown JM, van Wagoner D, Fiocchi C, Rieder F.. Novel mechanisms and clinical trial endpoints in intestinal fibrosis. Immunol Rev. 2021;302:211–227. https://doi.org/ 10.1111/imr.12974 - DOI - PMC - PubMed
    1. Adamina M, Bonovas S, Raine T, et al. ECCO guidelines on therapeutics in crohn’s disease: surgical treatment. J Crohns Colitis. 2020;14:155–168. https://doi.org/ 10.1093/ecco-jcc/jjz187 - DOI - PubMed
    1. Chan WPW, Mourad F, Leong RW.. Crohn’s disease associated strictures. J Gastroenterol Hepatol. 2018;33:998–1008. https://doi.org/ 10.1111/jgh.14119 - DOI - PubMed
    1. Lin XX, Qiu Y, Zhuang XJ, et al. Intestinal stricture in Crohn’s disease: a 2020 update. J Dig Dis. 2021;22:390–398. https://doi.org/ 10.1111/1751-2980.13022 - DOI - PubMed

MeSH terms