

Development and validation of a risk prediction model for diabetic kidney disease in patients with diabetic retinopathy
- PMID: 40391008
- PMCID: PMC12086070
- DOI: 10.3389/fendo.2025.1499866
Development and validation of a risk prediction model for diabetic kidney disease in patients with diabetic retinopathy
Abstract
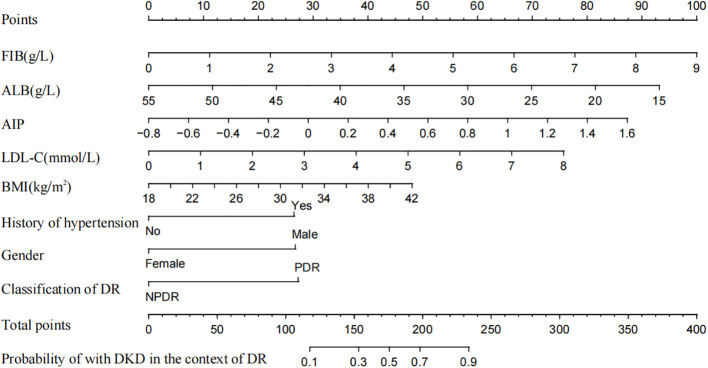
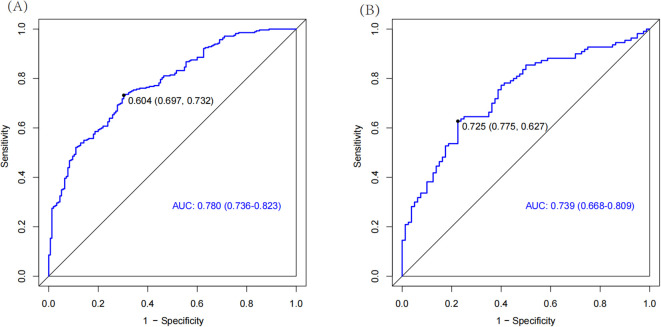
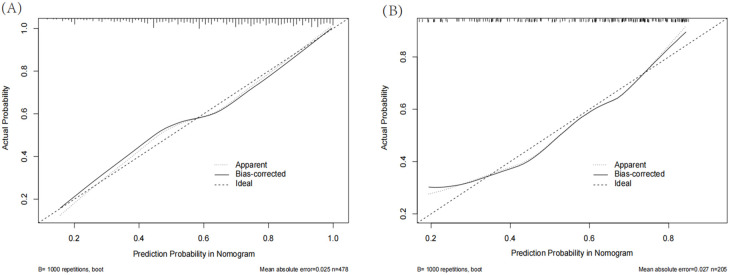
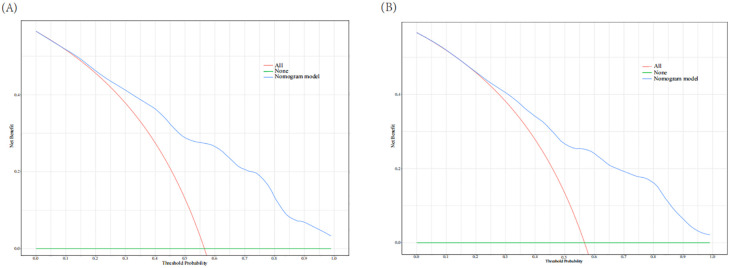
Diabetic retinopathy (DR) and diabetic kidney disease (DKD) are the most common microvascular complications associated with type 2 diabetes mellitus (T2DM). However, the occurrence of DR and DKD is not parallel. The aim of our study is to identify the risk factors for combining DKD in T2DM patients with pre-existing DR and construct a nomogram predictive model to identify high-risk patients with DR combined with DKD. We retrospectively reviewed 683 T2DM patients with DR from March 2017 to March 2023. The patients were divided into the DR group and the DR combined with DKD group. The hold-out method was used to randomly divide all subjects into a training set (70%) and a validation set (30%). Using multivariate logistic regression, we identified eight independent risk factors: fibrinogen (FIB), albumin (ALB), atherogenic index of plasma (AIP), low-density lipoprotein cholesterol (LDL-C), body mass index (BMI), classification of DR, gender, and history of hypertension. These factors were used to construct the nomogram prediction model. The model's discriminative ability was assessed using receiver operating characteristic (ROC) curve analysis, yielding an area under the curve (AUC) of 0.780 (95% CI: 0.736-0.823) in the training set and 0.739 (95% CI: 0.668-0.809) in the validation set. Calibration curves and decision curve analysis (DCA) further demonstrated the model's clinical utility. Additionally, to explore potential genetic predisposition, single nucleotide polymorphism (SNP) genotyping analysis was conducted on a subset of 50 randomly selected patients (25 from each group). The results suggested that the rs6591190 and rs12146493 loci of the AP5B1 gene might be associated with an increased susceptibility to DKD in patients with DR, warranting further investigation. In summary, our nomogram represents a valuable tool for identifying T2DM patients with DR who are at high risk for developing DKD.
Keywords: diabetic kidney disease; diabetic retinopathy; nomogram; risk factors; type 2 diabetes mellitus.
Copyright © 2025 Yin, Dong, Ren, Han, Wang, Wang and Gang.
Conflict of interest statement
The authors declare that the research was conducted in the absence of any commercial or financial relationships that could be construed as a potential conflict of interest.
Figures
Similar articles
-
Developing screening tools to estimate the risk of diabetic kidney disease in patients with type 2 diabetes mellitus.Technol Health Care. 2024;32(3):1807-1818. doi: 10.3233/THC-230811. Technol Health Care. 2024. PMID: 37980579
-
Development and validation of a novel nomogram to predict diabetic kidney disease in patients with type 2 diabetic mellitus and proteinuric kidney disease.Int Urol Nephrol. 2023 Jan;55(1):191-200. doi: 10.1007/s11255-022-03299-x. Epub 2022 Jul 23. Int Urol Nephrol. 2023. PMID: 35870041
-
Construction of a nomogram for predicting the risk of all-cause mortality in patients with diabetic retinopathy.Front Endocrinol (Lausanne). 2025 Feb 21;16:1493984. doi: 10.3389/fendo.2025.1493984. eCollection 2025. Front Endocrinol (Lausanne). 2025. PMID: 40060382 Free PMC article.
-
Establishment and Validation of a Risk Prediction Model for Early Diabetic Kidney Disease Based on a Systematic Review and Meta-Analysis of 20 Cohorts.Diabetes Care. 2020 Apr;43(4):925-933. doi: 10.2337/dc19-1897. Diabetes Care. 2020. PMID: 32198286
-
Meta-Analysis of Diagnostic Accuracy of Retinopathy for the Detection of Diabetic Kidney Disease in Adults With Type 2 Diabetes.Can J Diabetes. 2019 Oct;43(7):530-537.e4. doi: 10.1016/j.jcjd.2019.04.002. Epub 2019 Apr 8. Can J Diabetes. 2019. PMID: 31113753 Review.
References
Publication types
MeSH terms
LinkOut - more resources
Full Text Sources
Medical
Miscellaneous