

Machine Learning-Based Prediction of In-Hospital Mortality in Severe COVID-19 Patients Using Hematological Markers
- PMID: 40391097
- PMCID: PMC12088843
- DOI: 10.1155/cjid/6606842
Machine Learning-Based Prediction of In-Hospital Mortality in Severe COVID-19 Patients Using Hematological Markers
Abstract
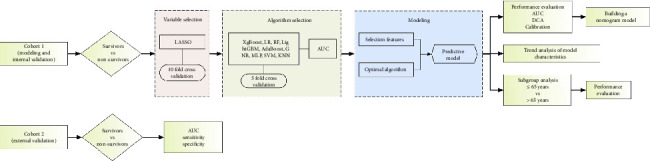
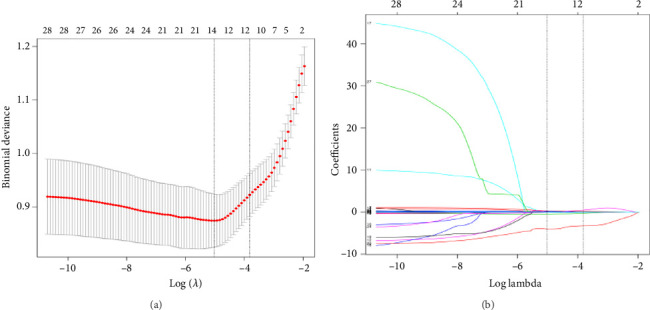
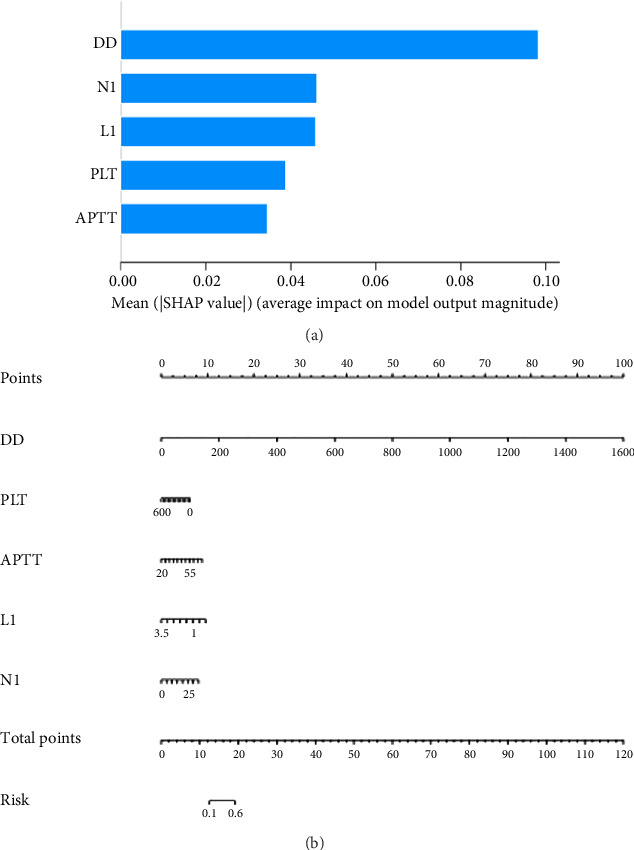
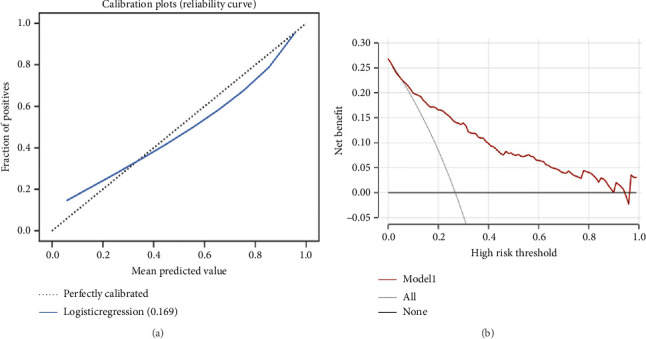
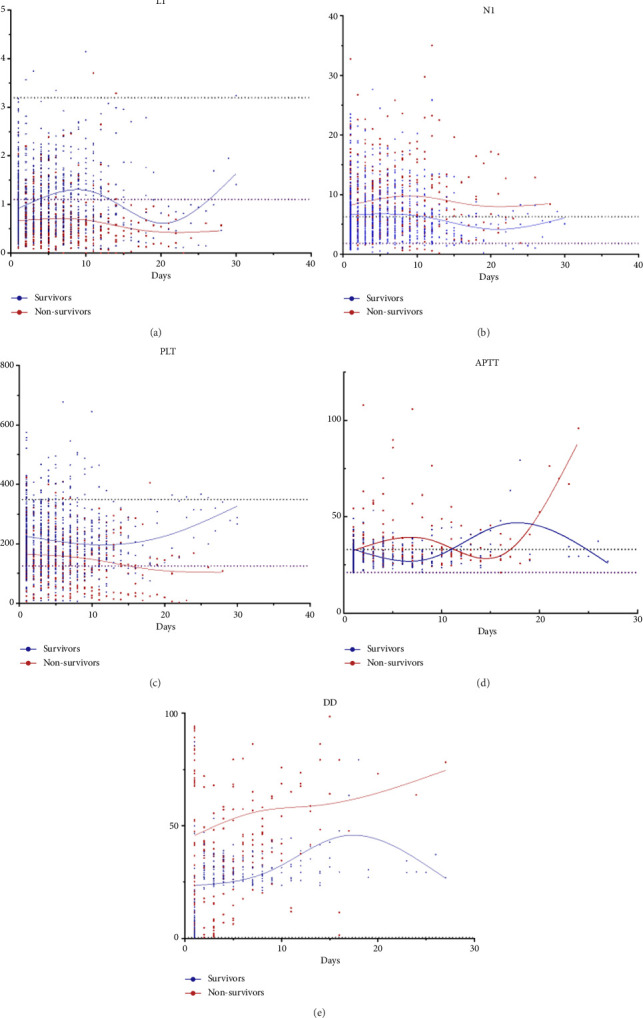
Background: The mortality rate is very high in patients with severe COVID-19. Nearly 32% of COVID-19 patients are critically ill, with mortality rates ranging from 8.1% to 33%. Early risk factor detection makes it easier to get the right care and estimate the prognosis. This study aimed to develop and validate a model to predict the risk of mortality based on hematological parameters at hospital admission in patients with severe COVID-19. Methods: The study retrospectively collected clinical data and laboratory test results from 396 and 112 patients with severe COVID-19 in two tertiary care hospitals as Cohort 1 and Cohort 2, respectively. Cohort 1 was to train the model. The LASSO method was used to screen features. The models built by nine machine learning algorithms were compared to screen the best algorithm and model. The model was visualized using nomogram, followed by trend analyses, and finally subgroup analyses. Cohort 2 was for external validation. Results: In Cohort 1, the model developed by the LR algorithm performed the best, with an AUC of 0.852 (95% CI: 0.750-0.953). Five features were included in the model, namely, D-dimer, platelets, neutrophil count, lymphocyte count, and activated partial thromboplastin time. The mode had higher diagnostic accuracy in patients with severe COVID-19 > 65 years of age (AUC = 0.814), slightly lower than in patients with severe COVID-19 ≤ 65 years of age (AUC = 0.875). The ability of the model to predict the occurrence of mortality was validated in Cohort 2 (AUC = 0.841). Conclusions: The risk prediction model for mortality for patients with severe COVID-19 was constructed by the LR algorithm using only hematological parameters in this study. The model contributes to the timely and accurate stratification and management of patients with severe COVID-19.
Keywords: COVID-19; death; hematological parameters; machine learning; prediction model.
Copyright © 2025 Rongrong Dong et al. Canadian Journal of Infectious Diseases and Medical Microbiology published by John Wiley & Sons Ltd.
Conflict of interest statement
The authors declare no conflicts of interest.
Figures
Similar articles
-
Construction and evaluation of a mortality prediction model for patients with acute kidney injury undergoing continuous renal replacement therapy based on machine learning algorithms.Ann Med. 2024 Dec;56(1):2388709. doi: 10.1080/07853890.2024.2388709. Epub 2024 Aug 19. Ann Med. 2024. PMID: 39155811 Free PMC article.
-
Interpretable machine learning for 28-day all-cause in-hospital mortality prediction in critically ill patients with heart failure combined with hypertension: A retrospective cohort study based on medical information mart for intensive care database-IV and eICU databases.Front Cardiovasc Med. 2022 Oct 12;9:994359. doi: 10.3389/fcvm.2022.994359. eCollection 2022. Front Cardiovasc Med. 2022. PMID: 36312291 Free PMC article.
-
[Constructing a predictive model for the death risk of patients with septic shock based on supervised machine learning algorithms].Zhonghua Wei Zhong Bing Ji Jiu Yi Xue. 2024 Apr;36(4):345-352. doi: 10.3760/cma.j.cn121430-20230930-00832. Zhonghua Wei Zhong Bing Ji Jiu Yi Xue. 2024. PMID: 38813626 Chinese.
-
Prediction of the risk of mortality in older patients with coronavirus disease 2019 using blood markers and machine learning.Front Immunol. 2024 Nov 1;15:1445618. doi: 10.3389/fimmu.2024.1445618. eCollection 2024. Front Immunol. 2024. PMID: 39555074 Free PMC article.
-
The CMLA score: A novel tool for early prediction of renal replacement therapy in patients with cardiogenic shock.Curr Probl Cardiol. 2024 Dec;49(12):102870. doi: 10.1016/j.cpcardiol.2024.102870. Epub 2024 Sep 27. Curr Probl Cardiol. 2024. PMID: 39343053 Review.
References
LinkOut - more resources
Full Text Sources
