. 2025 May 5:16:1585597.
doi: 10.3389/fimmu.2025.1585597. eCollection 2025.

Itolizumab regulates activating and inhibitory signals on effector cells, improving their cytotoxicity against CD318+ tumor cell lines

Affiliations

Itolizumab regulates activating and inhibitory signals on effector cells, improving their cytotoxicity against CD318+ tumor cell lines

Cynthia González Muñoz et al. Front Immunol. .

Abstract

Introduction: The CD6-CD318 axis has emerged as a potential target for immuno-oncology. Recent work has shown that blocking the CD6-CD318 interaction with a murine anti-human CD6 antibody increases lymphocyte cytotoxicity. However, several studies have demonstrated the drawbacks associated with the clinical use of murine antibodies and the variability among anti-CD6 antibodies. Therefore, evidence that the first-in-class humanized anti-human CD6 antibody itolizumab could be used for cancer immunotherapy may be a breakthrough in developing an antitumor clinical approach.

Methods: Phenotypic and functional characterization of peripheral blood mononuclear cells (PBMCs) from healthy donors after challenge with CD318+ cell lines was performed by flow cytometry. In addition, IFNγ was determined by ELISA in culture supernatants. Immunohistochemical analyses of breast tumor samples were also performed.

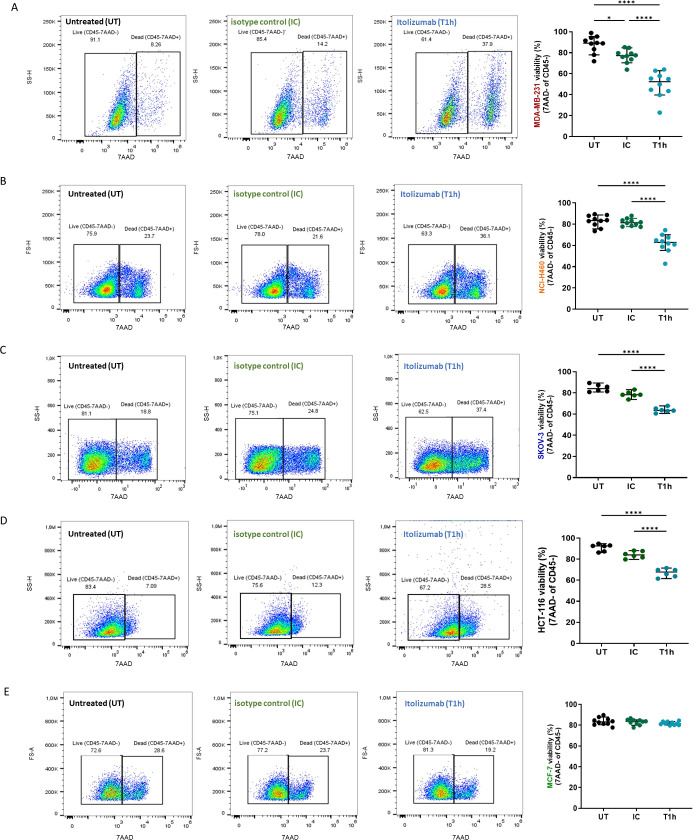
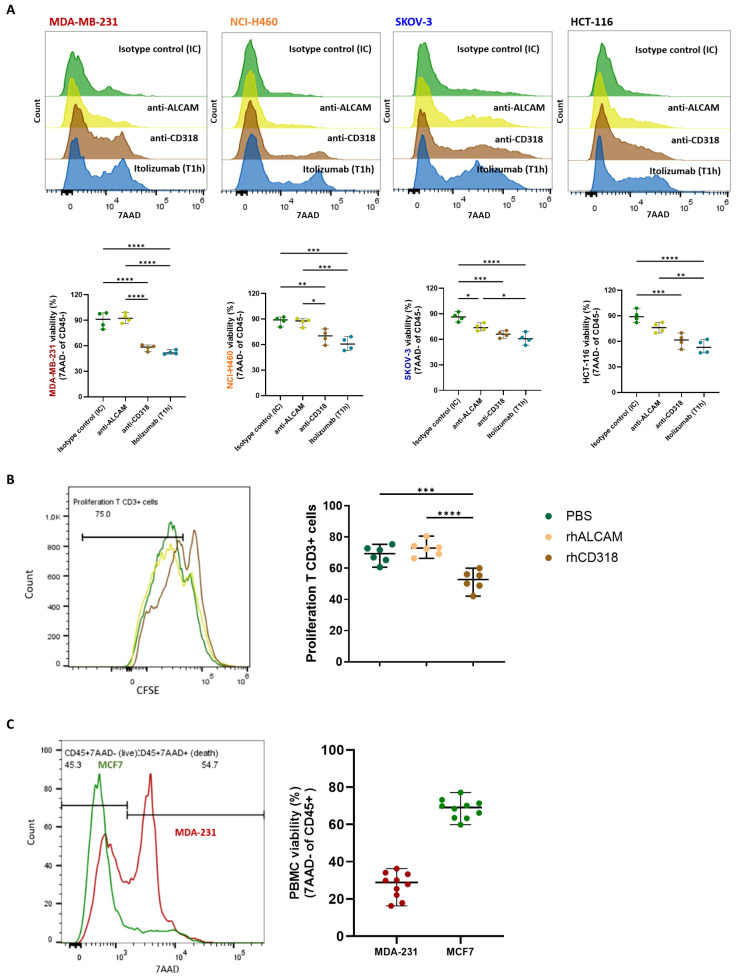
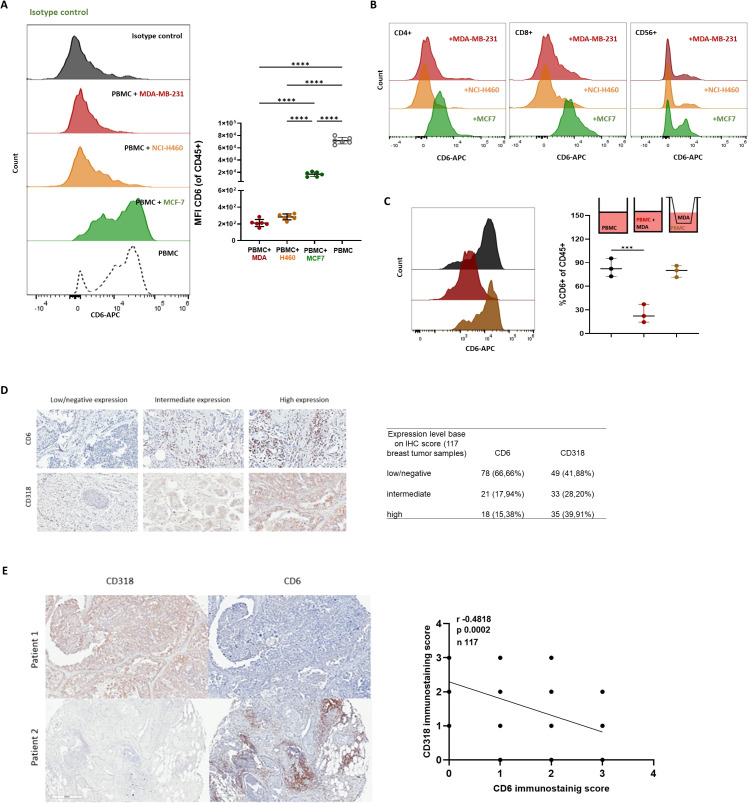
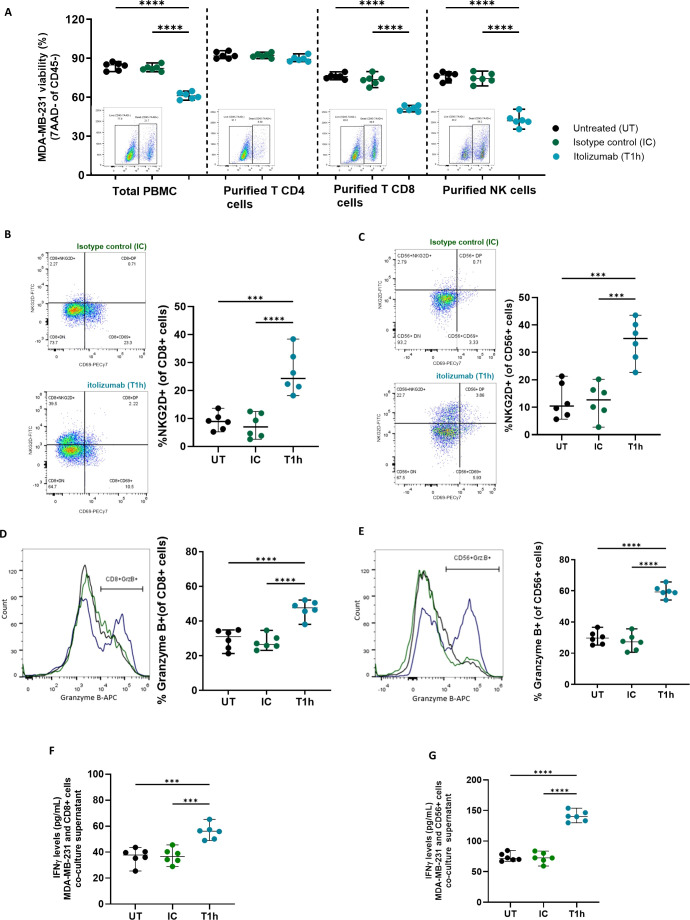
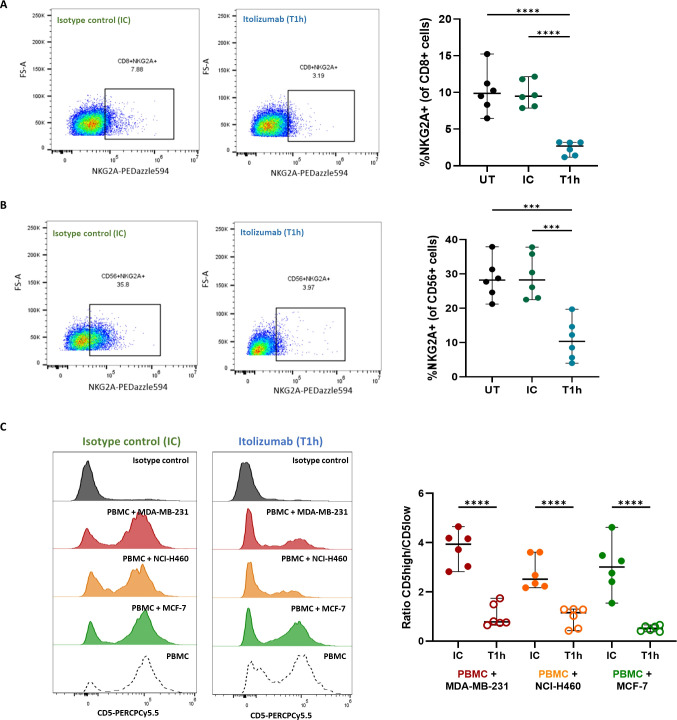
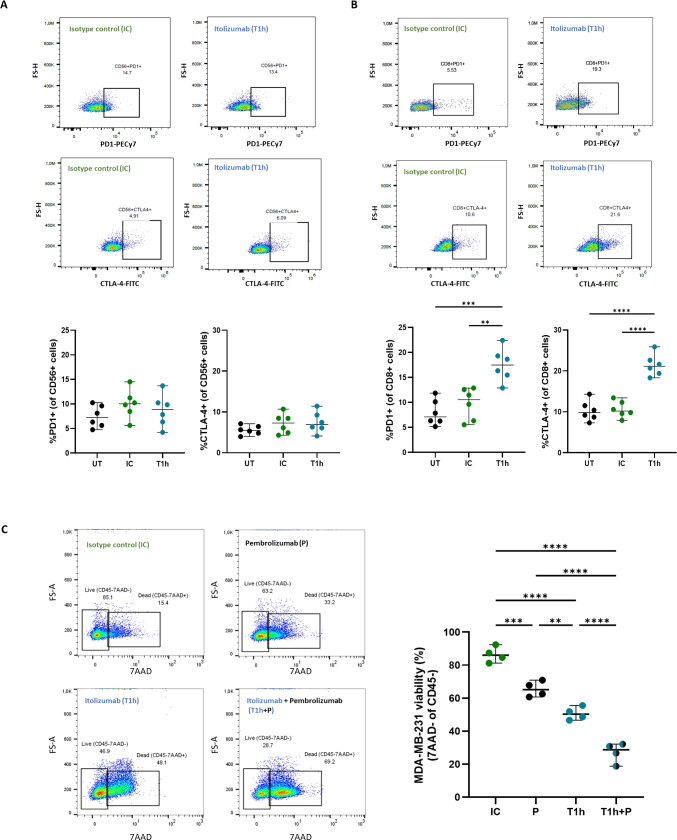
Results and discussion: Here, we provide evidence supporting the rationale for itolizumab in cancer immunotherapy. The blockade of the CD6-CD318 interaction by itolizumab increases the cytotoxic capacity of CD8 T and NK cells over CD318+ tumor lines, reverses the NKG2A/NKG2D ratio, and increases granzyme B and IFNγ production. Itolizumab also regulates immune responses by downregulating CD5 expression and upregulating PD-1 and CTLA-4 inhibitory receptors on lymphocytes, which contribute to reducing exacerbated responses and additively enhancing CD318+ tumor cell cytotoxicity when combined with other immunocheckpoint inhibitors. In addition, we report that CD6-CD318 interaction inhibits lymphocyte proliferation and survival while downregulating CD6 expression on lymphocytes in vitro and in human breast cancer tissue samples, reinforcing the role of the CD6-CD318 axis as an immune checkpoint and highlighting the potential of itolizumab as an immune checkpoint inhibitor. Taken together, our results provide the first evidence linking the blocking of the CD6-CD318 axis by itolizumab with the potentiation of functional properties of lymphocytes, highlighting itolizumab as a novel promising immunotherapy for CD318+ tumors and supporting the relevance of new combinatorial therapies with checkpoint inhibitors.

Keywords: ALCAM(CD166); CD318; CD5; CD6; CD8 lymphocytes; NK cells; immune checkpoint.


Conflict of interest statement

The authors declare that the research was conducted in the absence of any commercial or financial relationships that could be construed as a potential conflict of interest.

Figures

Figure 1
Figure 1
Itolizumab enhanced tumor cell killing by PBMC challenged with CD318+ tumor cell lines. PBMC were maintained untreated (UT, black dots) or were pre-incubated with 10 µg/mL of isotype control (IC, green dots) or itolizumab (T1h, blue dots) and challenged with (A) MDA-MB-231 (n=10), (B) NCI-H460 (n=10), (C) SKOV-3 (n=6), (D) HCT-116 (n=6) and (E) MCF-7 (n=10) human tumor cell lines. Tumor cell lysis was measured using 7AAD staining by flow cytometry. Representative dot plots for each condition and percentage of tumor cell viability in the co-cultures for each donor are shown. Data are depicted as median ± 95% confidence interval. Statistical analysis was performed using one-way ANOVA and Tukey’s multiple comparisons test, or Kruskal-Wallis test and Dunn’s multiple comparisons test, both for unpaired data. Only statistical significance is shown in the graphs, with *p ≤ 0.05, and ****p ≤ 0.0001.
Figure 2
Figure 2
Itolizumab increased the tumor cell killing capacity of PBMC by blocking the inhibitory effects associated with CD6-CD318 interaction. (A) PBMC and MDA-MB-231, NCI-H460, SKOV-3 and HCT-116 cell lines (n=4) were pre-incubated with 10 µg/mL of isotype control (IC, green), itolizumab (T1h, blue), or neutralizing antibodies specific for CD318 (brown) or ALCAM (yellow). Effector and target cells were then co-cultured, and tumor cell lysis was measured using 7AAD staining by flow cytometry. (B) CFSE-labeled T-cells (n=6) were activated with antiCD3/CD28 beads and incubated with 10ug/mL of pre-coated human recombinant CD318 (brown), ALCAM (yellow), or PBS (green) as control. (C) Immune cell viability was measured on isotype control treated-PBMC co-cultured with human tumor cell lines MDA-MB-231 (n=10, red) and MCF-7 (n=10, green) using flow cytometry. Representative histograms or dot plots for each condition, and individual viability percentage and CFSE dilution are displayed. Data are depicted as median ± 95% confidence interval. Statistical analysis was performed using the Kruskal-Wallis test and Dunn’s multiple comparisons test with unpaired data. Only statistical significance is shown in the graphs, with *p ≤ 0.05, **p ≤ 0.01, ***p ≤ 0.001, and ****p ≤ 0.0001.
Figure 3
Figure 3
CD6-CD318 interaction induced CD6 downmodulation. Isotype control treated PBMC were co-cultured with human tumor cell lines MDA-MB-231 (red), NCI-H460 (orange), and MCF-7 (green). CD6 loss was measured on PBMC (n=6) using flow cytometry. (A) Representative histograms of CD6 expression and individual values of CD6 MFI on isotype control treated PBMC challenged with tumor cell lines. (B) Representative histograms of CD6 expression on isotype control treated CD4+ and CD8+ T-cells and NK (CD56+) cells challenged with tumor cell lines. (C) Representative histograms and frequencies of CD6+ cells on isotype control treated PBMC challenged with tumor cell lines and co-cultured in a modified Boyden chamber with a transwell membrane of 0.4μm. Data are represented as median ± 95% confidence interval. Statistical analysis was performed using one-way ANOVA with unpaired data and Tuckey’s multiple comparison test. Only statistical significance is shown in the graphs, with ***p ≤ 0.001, and ****p ≤ 0.0001. (D). Representative IHC staining with CD318 and CD6 in breast tumor tissue samples (n 117) and relation of patients with low/negative, intermediate, and high staining scores for both molecules. (E). Pearson’s correlation analysis of CD318 expression and CD6+ infiltrated on breast tumor tissue samples by IHC.
Figure 4
Figure 4
Itolizumab enhanced tumor cell killing by activating CD8+ and NK cells challenged with CD318+ tumor cell lines. PBMC and purified CD4+ and CD8+ T-cells and NK cells were maintained untreated (UT, black) or were pre-incubated with 10 µg/mL of isotype control (IC, green) or itolizumab (T1h, blue) and challenged with MDA-MB-231 (n=6). (A) Tumor cell viability was measured using 7AAD staining by flow cytometry. The frequency of NKG2D+, CD69+, and granzyme B+ in (B, D) CD8+ T and (C, E) NK cells in the co-cultures were determined by flow cytometry. Representative dot plots or histograms of each condition and individual percentage of positive cells are displayed. IFNγ levels on co-culture supernatants of MDA-MB-231 with enriched CD8+ T (F) and NK cells (G) were quantified by ELISA. Individual values of IFNγ concentration (pg/mL) per donor are shown. Data are depicted as median ± 95% confidence interval. Statistical analysis was performed using one-way ANOVA and Tukey’s multiple comparisons test. Only statistical significance is shown in the graphs, with ***p ≤ 0.001, and ****p ≤ 0.0001.
Figure 5
Figure 5
Itolizumab reduces the frequency of inhibitory receptors NKG2A within CD8+ T and NK cells and CD5 on T cells. Isolated CD8 T cells (n=6) or PBMC from healthy controls were maintained untreated (UT, black) or pre-incubated with 10 µg/mL isotype control (IC, green) or itolizumab (T1h, blue) and challenged with breast tumor cell line MDA-MB-231. Expression levels of NKG2A in (A) isolated CD8+ T and (B) NK cells were assessed by flow cytometry. Representative dot plots and the frequency of positive cells are shown. Statistical analysis was performed using one-way ANOVA with Tukey’s multiple comparisons test. (C) CD5 expression on isotype control and itolizumab-treated PBMC challenged with breast tumor cell lines MDA-MB-231 (n=6, red) and MCF-7 (n=6, green) and lung tumor cell line NCI-H460 (n=6, orange). Representative histograms of CD5 expression and ratio of CD5 high/CD5 low MFI on PBMC are displayed for each co-cultured. Data are depicted as median ± 95% confidence interval. Statistical analysis was performed using unpaired Student T-tests. Only statistical significance is shown in the graphs, with ***p ≤ 0.001, and ****p ≤ 0.0001.
Figure 6
Figure 6
Increase of PD-1 and CTL-4 expression on CD8+ T cells by itolizumab promotes an additive cytotoxic effect in PBMC treated with combinations of itolizumab and other ICI. Isolated CD8+ T cells and NK cells (n=6) from healthy controls were maintained untreated (UT, black) or pre-incubated with 10 µg/mL isotype control (IC, green) or itolizumab (T1h, blue) and challenged with breast tumor cell line MDA-MB-231. Representative dot plots and frequency of PD1+ and CTLA4+ of (A) NK and (B) CD8+ T cells per donor are shown. (C) PBMC from healthy individuals were maintained untreated (UT, black dots) or pre-incubated with 10 µg/mL isotype control (IC, green dots), pembrolizumab (P, black dots), itolizumab (T1h, blue dots) or a combination of both (T1h+P, bicolor dots) and challenged with CD318+ breast tumor cell line MDA-MB-231. Tumor cell viability was measured by 7AAD staining by flow cytometry. Representative dot plots of 7AAD staining for each treatment and individual tumor cell viability percentages for each condition are displayed. Data are depicted as median ± 95% confidence interval. Statistical analysis was performed using one-way ANOVA and Tukey’s multiple comparisons test. Only statistical significance is shown in the graphs, with **p ≤ 0.01, ***p ≤ 0.001, and ****p ≤ 0.0001.

Similar articles

Cited by

References

    1. Franzin R, Netti GS, Spadaccino F, Porta C, Gesualdo L, Stallone G, et al. . The use of immune checkpoint inhibitors in oncology and the occurrence of AKI: where do we stand? Front Immunol. (2020) 11:574271. doi: 10.3389/fimmu.2020.574271 - DOI - PMC - PubMed
    1. Martins F, Sofiya L, Sykiotis GP, Lamine F, Maillard M, Fraga M, et al. . Adverse effects of immune-checkpoint inhibitors: epidemiology, management and surveillance. Nat Rev Clin Oncol. (2019) 16:563–80. doi: 10.1038/s41571-019-0218-0 - DOI - PubMed
    1. Gurrea-Rubio M, Fox DA. The dual role of CD6 as a therapeutic target in cancer and autoimmune disease. Front Med (Lausanne). (2022) 9:1026521. doi: 10.3389/fmed.2022.1026521 - DOI - PMC - PubMed
    1. Consuegra-Fernandez M, Martinez-Florensa M, Aranda F, de Salort J, Armiger-Borras N, Lozano T, et al. . Relevance of CD6-mediated interactions in the regulation of peripheral T-cell responses and tolerance. Front Immunol. (2017) 8:594. doi: 10.3389/fimmu.2017.00594 - DOI - PMC - PubMed
    1. Braun M, Muller B, ter Meer D, Raffegerst S, Simm B, Wilde S, et al. . The CD6 scavenger receptor is differentially expressed on a CD56 natural killer cell subpopulation and contributes to natural killer-derived cytokine and chemokine secretion. J Innate Immun. (2011) 3:420–34. doi: 10.1159/000322720 - DOI - PubMed

MeSH terms