Variable responses to ocean acidification among mixotrophic protists with different lifestyles
- PMID: 40391242
- PMCID: PMC12086424
- DOI: 10.1093/ismeco/ycaf064
Variable responses to ocean acidification among mixotrophic protists with different lifestyles
Abstract
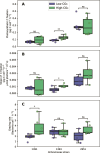
Marine phytoplankton are facing increasing dissolved CO2 concentrations and ocean acidification caused by anthropogenic CO2 emissions. Mixotrophic organisms are capable of both photosynthesis and phagotrophy of prey and are found across almost all phytoplankton taxa and diverse environments. Yet, we know very little about how mixotrophs respond to ocean acidification. Therefore, we studied responses to simulated ocean acidification in three strains of the mixotrophic chrysophyte Ochromonas (CCMP1391, CCMP2951, and CCMP1393). After acclimatization of the strains to treatment with high-CO2 (1000 ppm, pH 7.9) and low-CO2 concentrations (350 ppm, pH 8.3), strains CCMP1393 and CCMP2951 both exhibited higher growth rates in response to the high-CO2 treatment. In terms of the balance between phototrophic and heterotrophic metabolism, diverse responses were observed. In response to the high-CO2 treatment, strain CCMP1393 showed increased photosynthetic carbon fixation rates, while CCMP1391 exhibited higher grazing rates, and CCMP2951 did not show significant alteration of either rate. Hence, all three Ochromonas strains responded to ocean acidification, but in different ways. The variability in their responses highlights the need for better understanding of the functional diversity among mixotrophs in order to enhance predictive understanding of their contributions to global carbon cycling in the future.
Keywords: Ochromonas; bacterivory; chrysophytes; global change; mixoplankton; mixotrophy; ocean acidification; phytoplankton; primary production; protists.
© The Author(s) [2025]. Published by Oxford University Press on behalf of the International Society for Microbial Ecology.
Conflict of interest statement
None declared.
Figures


Similar articles
-
Contrasting Mixotrophic Lifestyles Reveal Different Ecological Niches in Two Closely Related Marine Protists.J Phycol. 2020 Feb;56(1):52-67. doi: 10.1111/jpy.12920. Epub 2019 Nov 1. J Phycol. 2020. PMID: 31529498 Free PMC article.
-
Environment-dependent metabolic investments in the mixotrophic chrysophyte Ochromonas.J Phycol. 2024 Feb;60(1):170-184. doi: 10.1111/jpy.13418. Epub 2023 Dec 23. J Phycol. 2024. PMID: 38141034
-
Water acidification weakens the carbon sink capacity of mixotrophic organisms.Sci Total Environ. 2023 Mar 20;865:161120. doi: 10.1016/j.scitotenv.2022.161120. Epub 2022 Dec 27. Sci Total Environ. 2023. PMID: 36581282
-
Ocean acidification refugia in variable environments.Glob Chang Biol. 2019 Oct;25(10):3201-3214. doi: 10.1111/gcb.14730. Epub 2019 Jul 30. Glob Chang Biol. 2019. PMID: 31199553 Free PMC article. Review.
-
Effects of ocean acidification on Antarctic marine organisms: A meta-analysis.Ecol Evol. 2020 Apr 16;10(10):4495-4514. doi: 10.1002/ece3.6205. eCollection 2020 May. Ecol Evol. 2020. PMID: 32489613 Free PMC article. Review.
References
-
- Nowicki M, DeVries T, Siegel DA. Quantifying the carbon export and sequestration pathways of the ocean’s biological carbon pump. Glob Biogeochem Cycles 2022;36:e2021GB007083. 10.1029/2021GB007083 - DOI
-
- Honjo S, Manganini SJ, Krishfield RA. et al. Particulate organic carbon fluxes to the ocean interior and factors controlling the biological pump: a synthesis of global sediment trap programs since 1983. Prog Oceanogr 2008;76:217–85. 10.1016/j.pocean.2007.11.003 - DOI
-
- Zeebe RE. History of seawater carbonate chemistry, atmospheric CO2, and ocean acidification. Annu Rev Earth Planet Sci 2012;40:141–65. 10.1146/annurev-earth-042711-105521 - DOI
Associated data
LinkOut - more resources
Full Text Sources

