[Preprint]. 2025 Apr 27:2025.04.26.650783.
doi: 10.1101/2025.04.26.650783.

Granuloma Dual RNA-Seq Reveals Composite Transcriptional Programs Driven by Neutrophils and Necrosis within Tuberculous Granulomas

Affiliations

Granuloma Dual RNA-Seq Reveals Composite Transcriptional Programs Driven by Neutrophils and Necrosis within Tuberculous Granulomas

Gopinath Viswanathan et al. bioRxiv. .

Abstract

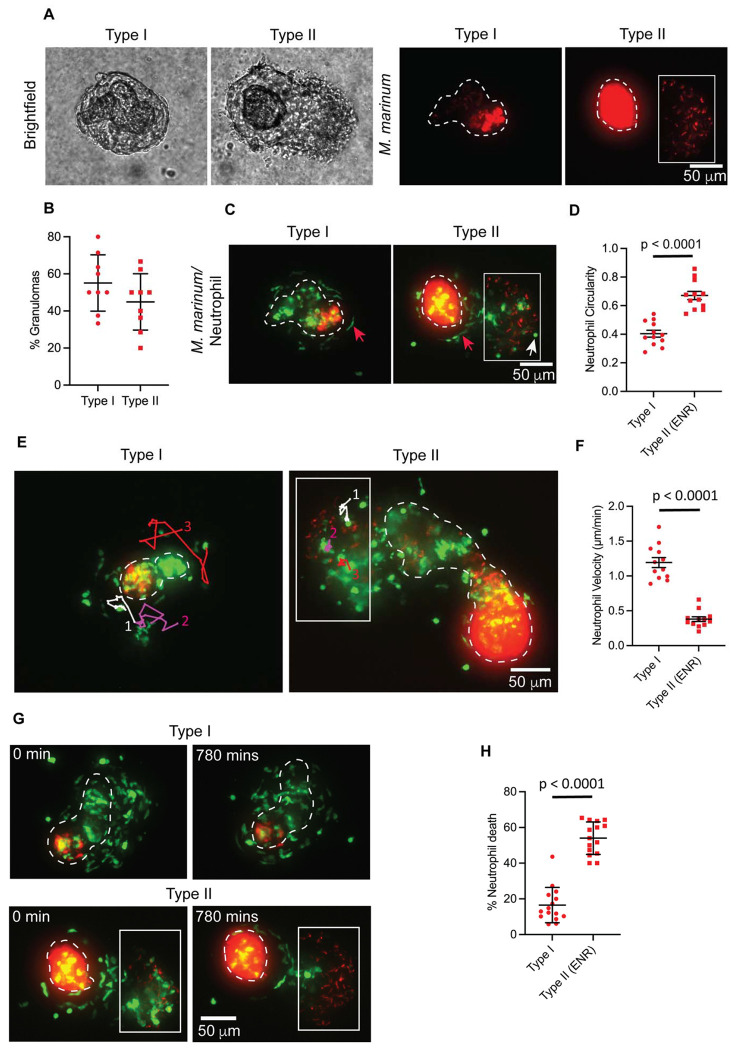
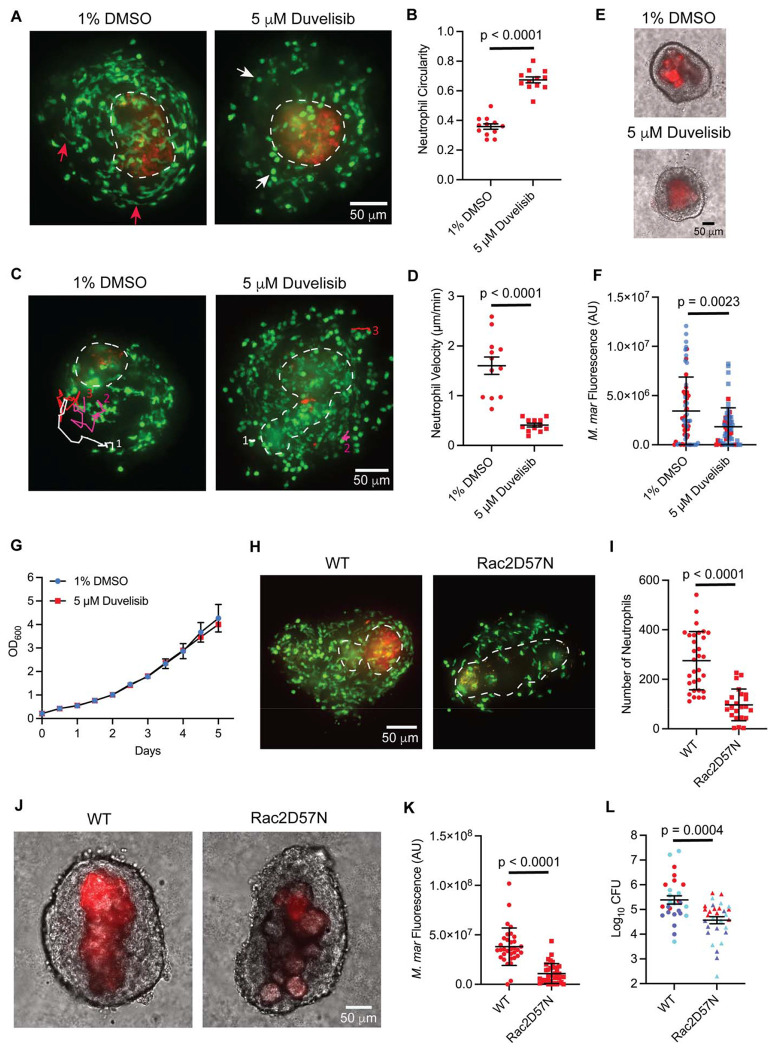
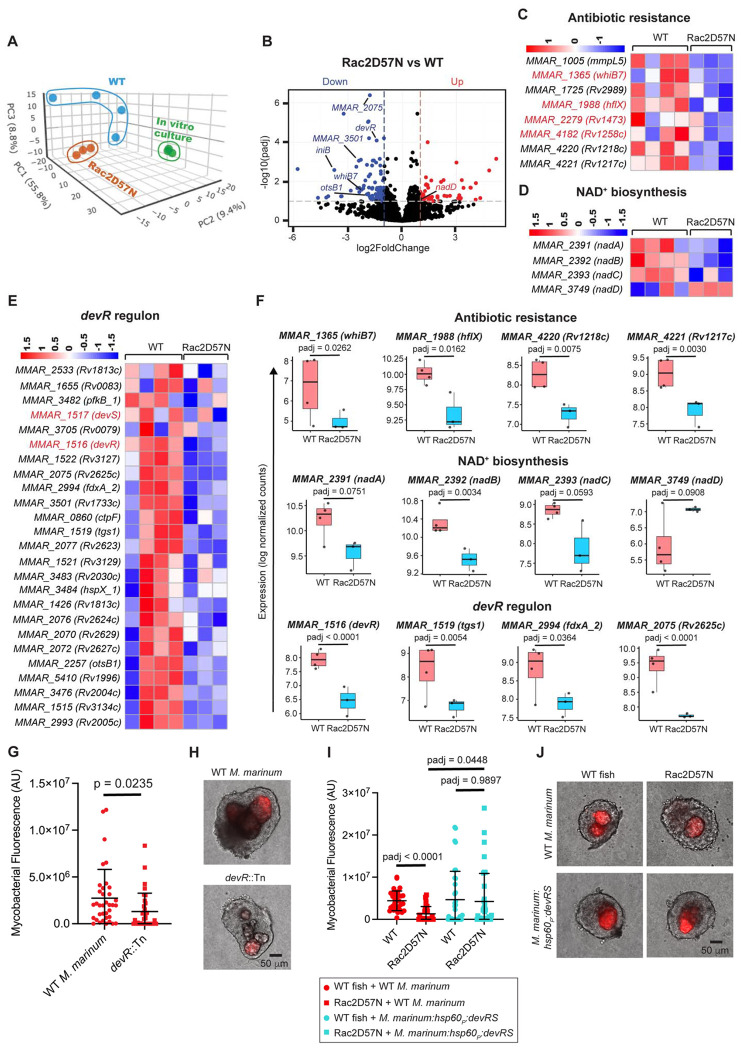
Mycobacterial granulomas lie at the center of tuberculosis (TB) pathogenesis and represent a unique niche where infecting bacteria survive in nutrient-restricted conditions and in the face of a host immune response. The granuloma's necrotic core, where bacteria reside extracellularly in humans, is difficult to assess in many experimentally tractable models. Here, using necrotic mycobacterial granulomas in adult zebrafish, we develop dual RNA-seq across different host genotypes to identify the transcriptional alterations that enable bacteria to survive within this key microenvironment. Through pharmacological and genetic interventions, we find that neutrophils within mature, necrotic granulomas promote bacterial growth, in part through upregulation of the bacterial devR regulon. We identify conserved suites of bacterial transcriptional programs induced only in the context of this unique necrotic extracellular niche, including bacterial modules related to K+ transport and rpf genes. Analysis of Mycobacterium tuberculosis strains across diverse lineages and human populations suggests that granuloma-specific transcriptional modules are targets for bacterial genetic adaptation in the context of human infection.


Figures

Fig. 1.
Fig. 1.. Neutrophil morphology, dynamics, and survival kinetics vary by granuloma subtype.
A) Representative bright-field and fluorescent images of granuloma explants from adult zebrafish infected with M. marinum (red). Granulomas were categorized into two subtypes based on their bacillary distribution pattern. White dashed lines mark necrotic core boundaries. M. marinum present outside the necrotic core in type II granulomas (Extra Necrotic Region (ENR)) are indicated by a white box. (B) Mean percentage of granuloma subtypes observed in granuloma explants. Error bars show standard deviation (SD). Each data point represents the percentage of granuloma subtype from a single experiment. n = 9 independent experiments, 91 total granuloma explants from 27 wild-type animals were analyzed. C) Fluorescent images of granuloma explants from (A) showing altered neutrophil morphologies in granuloma subtypes. Neutrophils are shown in green. Red arrows indicate elongated neutrophils; white arrows indicate rounded neutrophils. (D) Neutrophil shapes in type I and ENR of type II granulomas, represented as mean circularity with error bars indicating standard error of the mean (SEM). Each data point indicates mean neutrophil circularity from a single granuloma, with a maximum of 1 indicating completely circular neutrophils. 306 neutrophils from 12 type I granulomas and 183 neutrophils from the ENR of 12 type II granulomas were analyzed. Statistical comparison by two-tailed, unpaired t-test. E) Neutrophils tracked for a period of 230 mins in type I and ENR of type II granulomas. Individual tracks are labeled white, magenta, and red and numbered. (F) Mean neutrophil velocities in granuloma subtypes with error bars indicating SEM. Each data point denotes the mean velocity of 5 neutrophils tracked for 230 mins from a single granuloma. 60 neutrophils from 12 granulomas were tracked for each granuloma subtype. Statistical comparisons by unpaired t-test with Welch’s correction. (G) Fluorescent time-lapse images showing neutrophil viability in type I and ENR of type II granulomas observed over 780 mins. (H) Mean percentage of neutrophil death observed in granuloma subtypes with error bars denoting SD. Each data point represents the percentage of neutrophil death observed for 780 mins in a single granuloma, n = 15 granulomas from each subtype; type I – 1080 neutrophils analyzed; type II (ENR) - 532 neutrophils analyzed. Two-tailed, unpaired t-test was used. (D-H) Data pooled from three independent experiments with a total of 9 animals. Fluorescent images are 100 μm maximum projections. Scale bar, 50 μm.
Fig. 2.
Fig. 2.. Pharmacological and genetic interventions of granuloma neutrophil functions lead to the reduction in mycobacterial burden.
(A) Fluorescent images showing altered neutrophil morphology in granuloma explants 5 hours post-treatment with duvelisib versus vehicle control. Red arrows - elongated neutrophils in a vehicle-treated granuloma, white arrows – rounded neutrophils in duvelisib-treated granuloma. (B) Mean circularity of neutrophils from vehicle-treated and duvelisib-treated granulomas with error bars indicating SEM. Each data point represents the mean circularity of neutrophils from a single granuloma measured 5 hours post-treatment with vehicle/duvelisib. Vehicle – 300 neutrophils from 12 granulomas analyzed, Duvelisib – 389 neutrophils from 12 granulomas analyzed. (C) Neutrophils, tracked over 230 mins in granuloma explants 5 hours post-treatment with vehicle/duvelisib. Individual tracks are labeled white, magenta, and red and numbered. (D) Mean neutrophil velocities from vehicle-treated and duvelisib-treated granulomas with error bars indicating SEM. Each data point denotes the mean velocity of 5 neutrophils tracked for 230 mins from a single granuloma 5 hours post-treatment with vehicle/duvelisib. 60 neutrophils from 12 granulomas were analyzed for each treatment. (E) Representative images of M. marinum (red) infected granuloma explants 4 days post-treatment with vehicle/duvelisib. Bright-field and fluorescent channels are merged. (F) M. marinum burden in explant granulomas 4 days post-treatment with vehicle/duvelisib represented as mean arbitrary fluorescence units (AU). Error bar indicates SD. Data pooled from two independent experiments, differentiated by red and blue data points. Each data point represents M. marinum fluorescence measured in a single granuloma, n = 60 granulomas for vehicle & 62 granulomas for duvelisib treatment, obtained from 6 animals each. No significant differences in bacterial burden were observed before treatment. (G) in vitro growth profile of M. marinum in the presence of duvelisib/vehicle. Error bars represent SD. (H) Fluorescent images showing the number of neutrophils recruited to the Rac2D57N granuloma and its WT sibling. (I) Mean number of neutrophils observed in the Rac2D57N granulomas and their WT siblings with the error bars denoting SD. Each data point represents the number of neutrophils observed in a single granuloma, n = 31 granulomas for the WT & 23 granulomas for the Rac2D57N, obtained from 3 animals each; (J) Representative images showing M. marinum burden in the WT and Rac2D57N granulomas. (K) M. marinum burden in WT and Rac2D57N granulomas represented as mean arbitrary fluorescence units (AU). Granulomas were dissected from 14 dpi animals. Error bar indicates SD. Each data point represents M. marinum fluorescence measured in a single granuloma, n = 33 granulomas for the WT & 35 granulomas for the Rac2D57N, obtained from 3 animals each; (L) M. marinum burden in 14 dpi WT and Rac2D57N fish represented as mean Log10CFUs. Error bars show SEM. Data pooled from three independent experiments, differentiated by red, purple, and cyan-colored data points. 27 WT and 30 Rac2D57N fish were used. (A, C, H – K) Representative of three independent experiments. (E, G) Representative of two independent experiments. (B, D) Data pooled from three independent experiments, n = 9 animals in total for each group. (B, L) Two-tailed, unpaired t-test, (D, F, I & K) Unpaired t-test with Welch’s correction. Fluorescent images are 100 μm maximum projections. Scale bar, 50 μm.
Fig. 3.
Fig. 3.. Dual RNA-Seq strategy for enriching mycobacterial transcripts from necrotic granulomas.
(A) Diagram depicting the oligo(dT) bead-based host mRNA depletion strategy to enrich M. marinum transcripts from zebrafish necrotic granulomas. The figure was created with BioRender.com. (B) Bar plot showing enrichment of M. marinum transcripts in WT and Rac2D57N samples using the dual RNA-Seq approach. For each experiment, ~250 granulomas from 8 WT/12 Rac2D57N fish were used to isolate total RNA. n = 4 independent experiments for the WT and 3 independent experiments for the Rac2D57N fish. (C) Table showing total reads (* filtered for low-quality reads) and the number of rRNA and mRNA reads for zebrafish and M. marinum, before and after enrichment.
Fig. 4.
Fig. 4.. Neutrophils influence granuloma mycobacterial burden via devR regulon modulation.
(A) Principal-component analysis (PCA) of the M. marinum transcriptome from wild-type and Rac2D57N granulomas and log phase in vitro broth culture. (B) Volcano plot showing differential expression of M. marinum genes in Rac2D57N vs WT granulomas. The horizontal dotted line indicates a padj threshold of 0.1, whereas the vertical dotted lines represent log2 fold change thresholds of −1 and 1 respectively. (C, D, E) Heatmaps showing relative expression levels for the genes associated with antibiotic resistance, NAD+ biosynthesis, and devR regulon in M. marinum from WT and Rac2D57N granulomas. (F) Box plots showing the median log normalized counts of representative transcripts associated with antibiotic resistance, NAD+ biosynthesis, and devR regulon in WT and Rac2D57N granulomas. Each data point represents the log normalized count of the respective transcript from an individual experiment. Benjamini-Hochberg (BH) correction was used to determine the adjusted p-values. (G) Bacterial burden in WT M. marinum and devR mutant-infected granulomas dissected from WT fish, represented as mean arbitrary fluorescence units (AU). For WT M. marinum, n = 36 granulomas; for devR mutant, n = 33 granulomas. Unpaired t-test with Welch’s correction. (H) Representative images showing WT M. marinum and devR mutant burden in the granulomas dissected from infected WT fish. (I) Granuloma bacterial burden in WT and Rac2D57N fish infected with either WT M. marinum (red data points) or M. marinum overexpressing devR & devS (cyan data points), represented as mean arbitrary fluorescence units (AU). For WT M. marinum infection: n = 32 granulomas from WT fish and 27 granulomas from Rac2D57N fish. For M. marinum devRS overexpressor infection: n = 35 granulomas from WT fish and 36 granulomas from Rac2D57N fish. Brown-Forsythe and Welch ANOVA tests, followed by Dunnett’s T3 multiple comparisons test, were used. (J) Representative images showing the burden of WT M. marinum and M. marinum devRS overexpressor in granulomas dissected from infected WT and Rac2D57N fish. (G, I) Granulomas were dissected from 14 dpi animals. Each data point represents mycobacterial fluorescence measured in a single granuloma, with granulomas obtained from 3 animals per group. Error bars indicate SD. (H, J) Scale bar, 50 μm.
Fig. 5.
Fig. 5.. Dual RNA-seq identifies mycobacterial transcripts specifically enriched in necrotic wild-type granulomas.
(A) Volcano plot showing differential expression of M. marinum genes in WT granulomas vs broth culture. The horizontal dotted line indicates a padj threshold of 0.1, whereas the vertical dotted lines represent log2 fold change thresholds of −1 and 1 respectively. (B) Venn diagram comparing upregulated mycobacterial genes from necrotic granulomas in zebrafish with previously published data from in vivo mouse macrophages. (C, D) Heatmaps showing mycobacterial genes commonly upregulated in zebrafish necrotic granulomas and in vivo mouse macrophages, related to PDIM synthesis & transport, and cholesterol catabolism. AM- alveolar macrophages, IM – interstitial macrophages. Four randomly selected genes specifically upregulated in necrotic granulomas (colored green) were included to improve scaling and avoid skewed representation. (E) Heatmaps showing mycobacterial genes specifically upregulated in zebrafish necrotic granulomas vs in vivo mouse macrophages, related to resuscitation promoting factors, ion transport, electron transport chain, nitrogen metabolism, oxidative stress response, chaperones, and Clp proteases. (F) Box plots showing the median log normalized counts of representative transcripts from (E) in WT granulomas and broth culture. Each data point represents the log normalized count of the respective transcript from an individual experiment. Benjamini-Hochberg (BH) correction was used to determine the adjusted p-values.
Fig. 6.
Fig. 6.. Lineage-specific adaptive variation in M. tuberculosis genes enriched in necrotic granulomas.
(A, B) Distribution plots comparing the frequency of lineage-specific non-synonymous (A) or synonymous (B) mutations in the M. tuberculosis homologs of the top 50 granuloma-specific genes (red bars) to a simulated distribution of random mutations in this gene set (grey bars). n = 1,000 simulation events, a one-sided (right-tailed) permutation test was used to determine p-values. (C) Phylogenetic trees of 69 M. tuberculosis clinical isolates representing the seven primary lineages (L1-L7) and several major sub-lineages, including L4.1-L4.9 with mutational events for representative granuloma-specific genes (i) mmpL9 and (ii) Rv1215c highlighted. Blue squares represent non-synonymous mutations, and the green circle represents a synonymous mutation. Branch colors indicate the inferred lineages.

References

    1. Gengenbacher M., Kaufmann S. H. E., Mycobacterium tuberculosis: success through dormancy. FEMS Microbiology Reviews 36, 514–532 (2012). - PMC - PubMed
    1. Pagán A. J., Ramakrishnan L., The formation and function of granulomas. Annu Rev Immunol 36, 639–665 (2018). - PubMed
    1. Martin C. J., Carey A. F., Fortune S. M., A bug’s life in the granuloma. Seminars in Immunopathology 38, 213–220 (2016). - PMC - PubMed
    1. Cronan M. R., Matty M. A., Rosenberg A. F., Blanc L., Pyle C. J., Espenschied S. T., Rawls J. F., Dartois V., Tobin D. M., An explant technique for high-resolution imaging and manipulation of mycobacterial granulomas. Nature Methods 15, 1098–1107 (2018). - PMC - PubMed
    1. Coleman M. T., Chen R. Y., Lee M., Lin P. L., Dodd L. E., Maiello P., Via L. E., Kim Y., Marriner G., Dartois V., Scanga C., Janssen C., Wang J., Klein E., Cho S. N., Barry C. E. 3rd, Flynn J. L., PET/CT imaging reveals a therapeutic response to oxazolidinones in macaques and humans with tuberculosis. Sci Transl Med 6, (2014). - PMC - PubMed

Publication types

LinkOut - more resources