Epidemiological analysis of African swine fever in the European Union during 2024
- PMID: 40391334
- PMCID: PMC12086368
- DOI: 10.2903/j.efsa.2025.9436
Epidemiological analysis of African swine fever in the European Union during 2024
Abstract
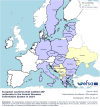
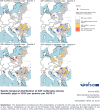
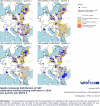
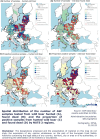
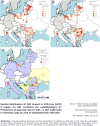
During 2024, the number of EU Member States affected by African swine fever (ASF) decreased from 14 to 13, with Sweden regaining freedom and no new Member State becoming infected. ASF outbreaks in domestic pigs in the EU declined by 83% compared to 2023, primarily due to fewer outbreaks in Croatia and Romania, although Romania notified 66% of the 333 outbreaks in the EU. Most outbreaks (78%) occurred in establishments with fewer than 100 pigs. However, an increase in outbreaks in establishments with more than 100 pigs was observed in Italy and Poland. Like previous years, there was a clear seasonality for domestic pig outbreaks, with 51% of them notified between July and September. Most of the outbreaks in domestic pigs were detected through passive surveillance based on clinical suspicion (79.4%), while fewer outbreaks were detected through enhanced passive surveillance involving systematic testing of dead pigs (14.2%) and 6.4% through tracing contacts after outbreak detection. In wild boar, the number of outbreaks notified has remained stable since 2022 (between 7000 and 8000) with a less clear seasonality than for domestic pigs, and a winter peak observed only in Hungary, Italy, Poland and Slovakia. Overall, 29% of the 23,919 wild boar carcasses found during passive surveillance activities tested positive for ASFv by PCR, representing 70.4% of the wild boar outbreaks in the EU. In contrast, around 0.4% of the 412,753 hunted wild boar tested positive by PCR, representing 28.4% of the wild boar outbreaks. While the use of serological tests performed in wild boar decreased, the number of PCR tests remained stable. Despite the reduction in the number of outbreaks in domestic pigs, the total size of the restricted zones III in the EU remained stable, with a slight increase in restricted zones II + III in 2024.
Keywords: ASF; epidemiology; monitoring; pigs; surveillance; wild boar.
© 2025 European Food Safety Authority. EFSA Journal published by Wiley‐VCH GmbH on behalf of European Food Safety Authority.
Figures









Similar articles
-
Epidemiological analysis of African swine fever in the European Union during 2023.EFSA J. 2024 May 16;22(5):e8809. doi: 10.2903/j.efsa.2024.8809. eCollection 2024 May. EFSA J. 2024. PMID: 38756349 Free PMC article.
-
Epidemiological analysis of African swine fever in the European Union during 2022.EFSA J. 2023 May 22;21(5):e08016. doi: 10.2903/j.efsa.2023.8016. eCollection 2023 May. EFSA J. 2023. PMID: 37223755 Free PMC article.
-
Seasonal Occurrence of African Swine Fever in Wild Boar and Domestic Pigs in EU Member States.Viruses. 2023 Sep 20;15(9):1955. doi: 10.3390/v15091955. Viruses. 2023. PMID: 37766361 Free PMC article.
-
African Swine Fever in Wild Boar in Europe-A Review.Viruses. 2021 Aug 30;13(9):1717. doi: 10.3390/v13091717. Viruses. 2021. PMID: 34578300 Free PMC article. Review.
-
Epidemiological considerations on African swine fever in Europe 2014-2018.Porcine Health Manag. 2019 Jan 9;5:6. doi: 10.1186/s40813-018-0109-2. eCollection 2019. Porcine Health Manag. 2019. PMID: 30637117 Free PMC article. Review.
Cited by
-
Safety of Live Attenuated ASFV-G-ΔI177L/ΔLVR Vaccination in Sows With Advanced Pregnancies.Transbound Emerg Dis. 2025 Jul 13;2025:8007143. doi: 10.1155/tbed/8007143. eCollection 2025. Transbound Emerg Dis. 2025. PMID: 40692875 Free PMC article.
References
-
- EFSA (European Food Safety Authority) , Boklund, A. , Cay, B. , Depner, K. , Földi, Z. , Guberti, V. , Masiulis, M. , Miteva, A. , More, S. , Olsevskis, E. , Šatrán, P. , Spiridon, M. , Stahl, K. , Thulke, H. H. , Viltrop, A. , Wozniakowski, G. , Broglia, A. , Abrahantes, J. C. , Dhollander, S. , & Gortázar, C. (2018). Epidemiological analyses of African swine fever in the European Union (November 2017 until November 2018). EFSA Journal, 16(11), 5494. 10.2903/j.efsa.2018.5494 - DOI - PMC - PubMed
-
- EFSA (European Food Safety Authority) , Anette, B. , Anette, B. , Theodora, C. V. , Klaus, D. , Daniel, D. , Vittorio, G. , Georgina, H. , Daniela, K. , Annick, L. , Aleksandra, M. , Simon, M. , Edvins, O. , Sasa, O. , Helen, R. , Mihaela, S. , Karl, S. , Hans‐Hermann, T. , Grigaliuniene, V. , … Christian, G. S. (2020). Scientific report on the epidemiological analyses of African swine fever in the European Union (November 2018 to October 2019). EFSA Journal, 18(1), 5996. 10.2903/j.efsa.2021.5996 - DOI
-
- EFSA (European Food Safety Authority) , Desmecht, D. , Gerbier, G. , Gort azar Schmidt, C. , Grigaliuniene, V. , Helyes, G. , Kantere, M. , Korytarova, D. , Linden, A. , Miteva, A. , Neghirla, I. , Olsevskis, E. , Ostojic, S. , Petit, T. , Staubach, C. , Thulke, H.‐H. , Viltrop, A. , Richard, W. , Wozniakowski, G. , … Stahl, K. (2021). Epidemiological analysis of African swine fever in the European Union (September 2019 to august 2020). EFSA Journal, 19(5), 6572. 10.2903/j.efsa.2021.6572 - DOI - PMC - PubMed
-
- EFSA (European Food Safety Authority) , Dhollander, S. , Dhollander, S. , Gibin, D. , Mur, L. , Papanikolaou, A. , & Zancanaro, G. (2022a). Guidance for reporting laboratory data on African swine fever (ASF). EFSA Supporting Publication, 19(11), EN‐7646. 10.2903/sp.efsa.2022.EN-7646 - DOI
-
- EFSA (European Food Safety Authority) , Aminalragia‐Giamini, R. , Dhollander, S. , Gibin, D. , Mur, L. , Papanikolaou, A. , & Zancanaro, G. (2022b). Guidance for reporting at the SIGMA animal population data model. EFSA Supporting Publication, 19(9), EN‐7568. 10.2903/sp.efsa.2022.EN-7568 - DOI
LinkOut - more resources
Full Text Sources
