

The effect of minor components on canola oil oxidation: Oxidation kinetics explained by molecular interactions
- PMID: 40391376
- PMCID: PMC12088749
- DOI: 10.1016/j.crfs.2025.101056
The effect of minor components on canola oil oxidation: Oxidation kinetics explained by molecular interactions
Abstract
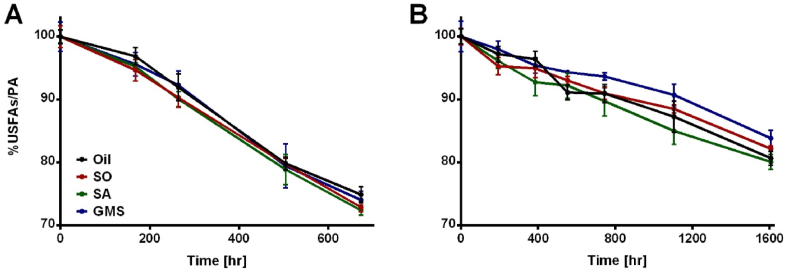
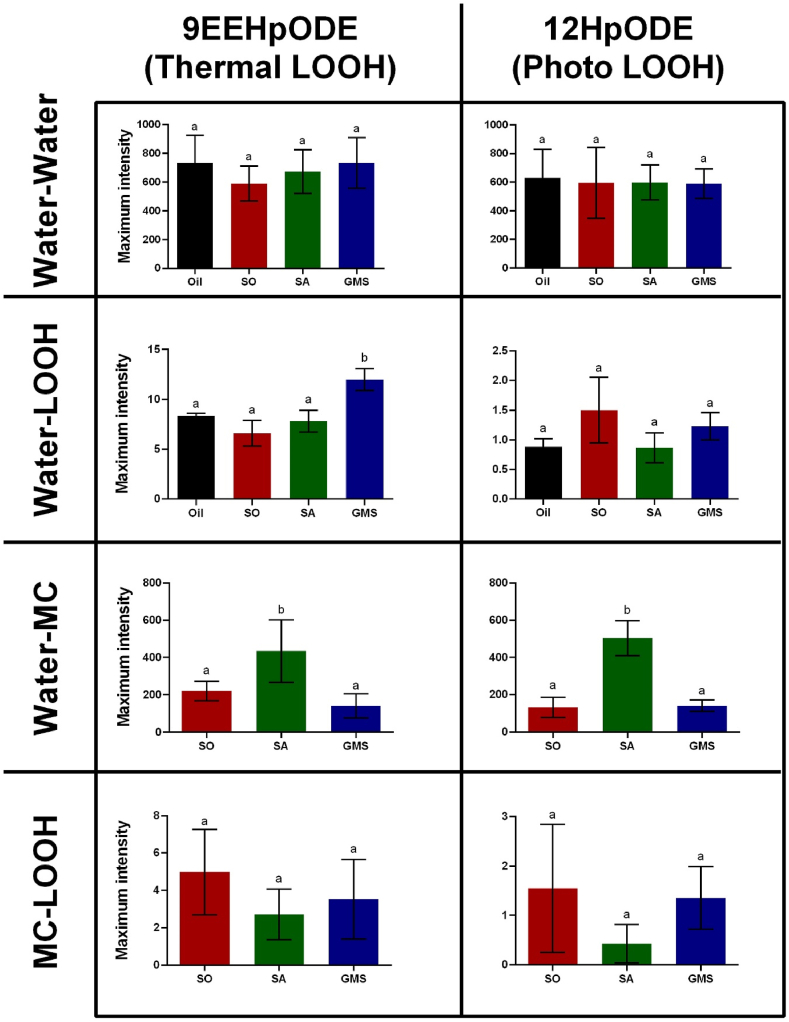
This study investigates the effect of various minor components (MCs) on the oxidation kinetics and molecular self-assembly in stripped canola oil during thermal and photo oxidation processes using experimental and simulation tools. The peroxide value (PV) and fatty acid content were measured to evaluate the formation of oxidation products and the consumption rate of unsaturated fatty acids. In the thermal oxidation experiment, adding MCs slightly increased the oxidation rate, while in the photo oxidation experiment, stearic acid (SA) and glycerol monostearate (GMS) significantly decreased it. GMS demonstrated a pronounced ability to self-assemble and form molecular organizations during photo oxidation, resulting in lower critical micelle concentration (CMC) values of lipid hydroperoxides (LOOHs) and reduced oxidation rates. These GMS self-assemblies seem to scatter light, thus decreasing absorbed energy during photo oxidation, leading to lower oxidation rates. SA exhibited the highest surface activity, effectively lowering the LOOH CMC and facilitating the formation of stable reverse micelles at lower concentrations. Interestingly, the addition of MCs did not influence the tendency of LOOHs to form hydrogen bonds with water, suggesting that the lower CMC resulted from the formation of mutual reverse micelles of MCs and LOOHs. Meso-phase formation was observed at very high PVs, indicating a high concentration of secondary oxidation products, which also possess surface activity. These findings underscore the importance of molecular interactions in oxidation stability, providing insights for improving edible oil preservation.
Keywords: Edible oil; MD simulations; Minor components; Oxidation; Reverse micelles; Self-assembly.
© 2025 The Authors. Published by Elsevier B.V.
Conflict of interest statement
The authors declare that they have no known competing financial interests or personal relationships that could have appeared to influence the work reported in this paper.
Figures


References
-
- Abraham M.J., Murtola T., Schulz R., Páll S., Smith J.C., Hess B., Lindah E. Gromacs: high performance molecular simulations through multi-level parallelism from laptops to supercomputers. SoftwareX. 2015;1–2:19–25.
-
- Alasiri H. Determining critical micelle concentrations of surfactants based on viscosity calculations from coarse-grained molecular dynamics simulations. Energy Fuels. 2019;33:2408–2412.
-
- Allouche A. Software news and updates gabedit — a graphical user interface for computational chemistry softwares. J. Comput. Chem. 2012;32:174–182. - PubMed
-
- Berendsen H.J.C., Grigera J.R., Straatsma T.P. The missing term in effective pair potentials. J. Phys. Chem. 1987;91:6269–6271.
LinkOut - more resources
Full Text Sources
Research Materials
