. 2025 Mar 25;12(7):uhaf098.
doi: 10.1093/hr/uhaf098. eCollection 2025 Jul.

A single-base mutation in promoter of CsTPR enhances the negative regulation on mechanical-related leaf drooping in tea plants

Affiliations

A single-base mutation in promoter of CsTPR enhances the negative regulation on mechanical-related leaf drooping in tea plants

Haoran Liu et al. Hortic Res. .

Abstract

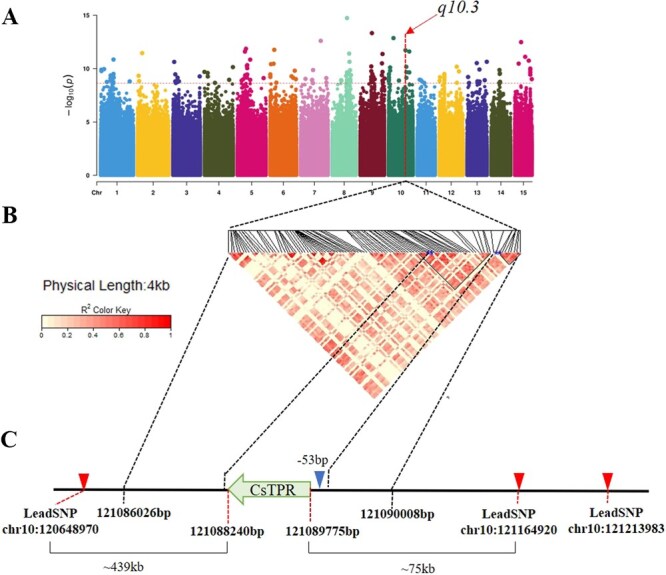
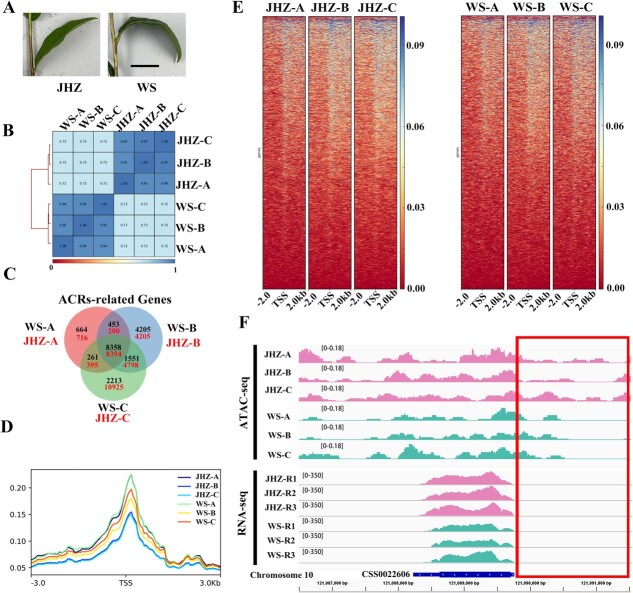
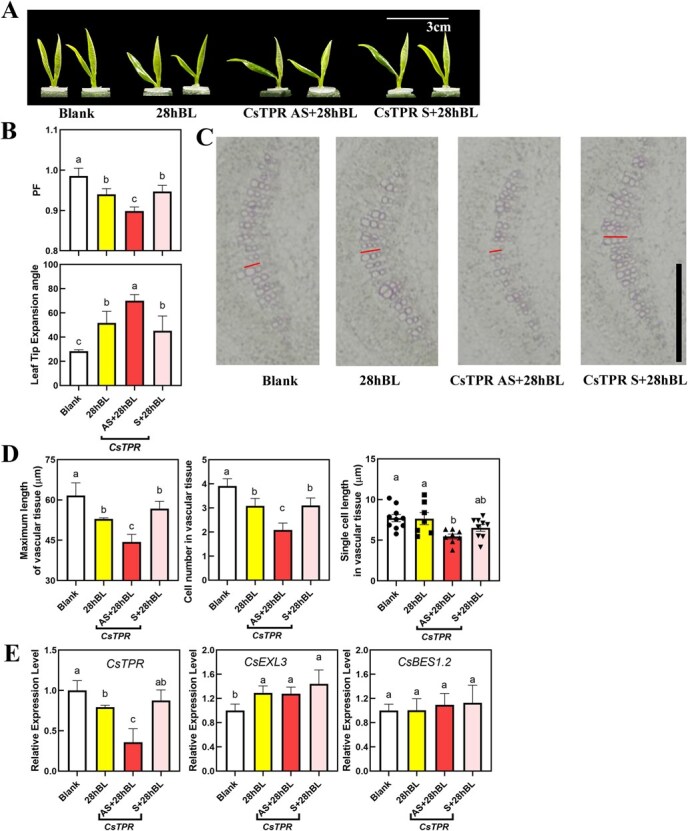
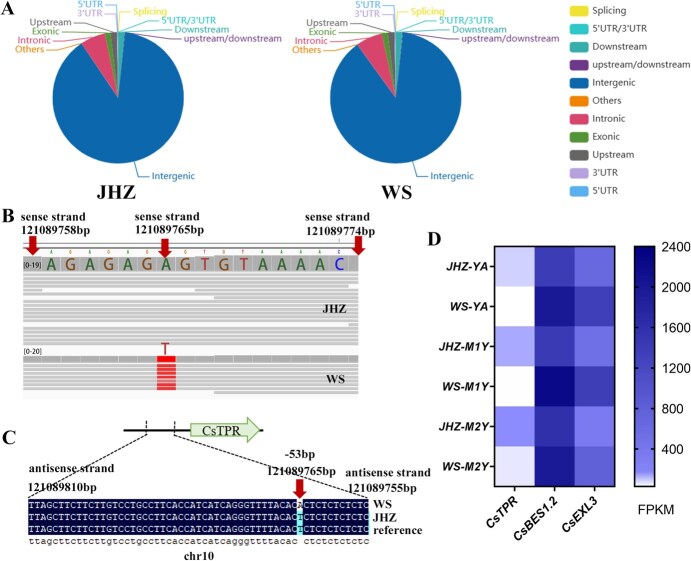
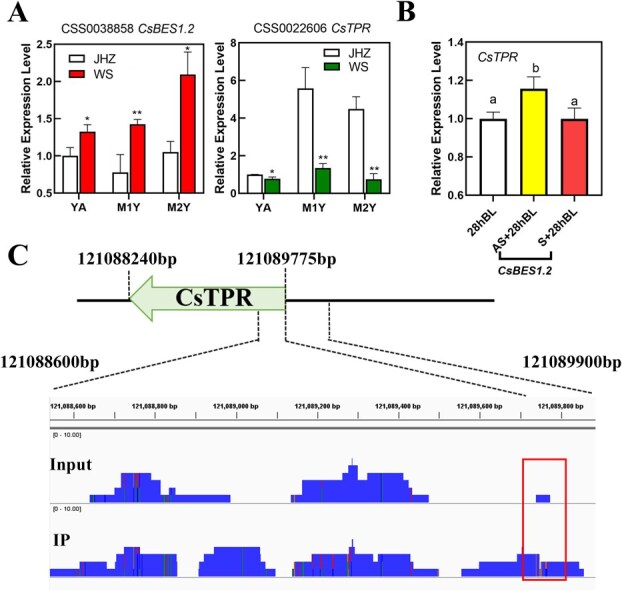
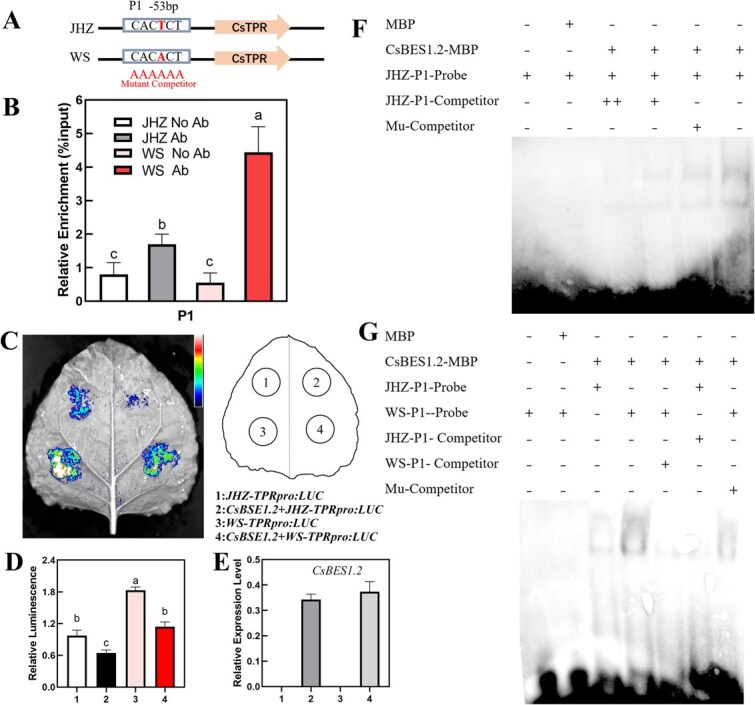
Mechanical harvesting in the tea industry has become increasingly essential due to its advantages in increasing productivity and reducing labor costs. Leaf droopiness caused a high rate of broken leaves, hindering the mechanized harvesting quality. However, the underlying mechanisms remain unclear. We herein identified a quantitative trait locus, designated as q10.3, along with three lead single nucleotide polymorphisms (SNPs) located near a TPR gene (TETRATRICOPEPTIDE REPEAT), named CsTPR, through performing a genome-wide association study (GWAS) on 130 tea accessions. Integrated analysis of RNA-seq and ATAC-seq confirmed CsTPR as a droopiness-associated candidate gene at the transcriptional level. CsTPR was then proved to negatively regulate brassinosteroid-induced droopiness by using the CsTPR-silencing tea plant. Whole-genome sequencing (WGS) combined with genome walking further indicated that a single-base mutation (T-A) in the promoter of CsTPR. ChIP-seq revealed that this mutation occurred within the binding site, E-box, of CsBES1.2 on the CsTPR promoter. Notably, CsBES1.2 bound the E-box of CsTPR promoter to repress the expression of CsTPR, as demonstrated by chromatin immunoprecipitation quantitative polymerase chain reaction (ChIP-qPCR), electrophoretic mobility shift assays (EMSA), and transient assays. The single-base mutation strengthened the inhibitory effect of CsBES1.2 on the expression of CsTPR via enhancing the binding affinity to the E-box. Altogether, our findings suggest that CsTPR negatively regulates droopiness in tea plants under the transcriptional repression of CsBES1.2 and that a single-base mutation within E-box amplifies the suppression of CsBES1.2 on the expression of CsTPR.


Conflict of interest statement

The authors declare that they have no conflict of interest.

Figures

Figure 1
Figure 1
GWAS of droopy leaves. (A) Manhattan plot according to GWAS for PF. The red horizontal line indicated the threshold (−log10(P), P-value = 2.34E-09). The vertical line indicated the QTL, q10.3. q10.3 included three lead SNPs, as shown in (C). (B) LD plot of 100 SNPs between lead SNPs in a 0.4-Mb region (121086026–121090008 bp) of chromosome 10. Asterisk indicated the nearest SNPs to the initiation (121089783/121089905 bp) and stop code (121088235/121088244 bp) of CsTPR. (C) Gene structure of CsTPR. The direction of arrow indicated the translation direction of CsTPR. The initiation site and stop site were 121089775 and 121088240 bp, respectively. Arrow indicated the location at −53 bp promoter of CsTPR. The detailed distance from the lead SNP to the gene was drawn under this figure.
Figure 2
Figure 2
Chromatin accessibility landscapes of droopy leaves and the relationship between chromatin accessibility and gene expression of CsTPR. (A) Representative images of leaves from JHZ and WS. Scale bar represents 5 cm. (B) The heatmap and clustering of Spearman correlation of JHZ and WS. Each cultivar has three biological replicates. (C) Venn diagram of accessible chromatin regions (ACRs) related genes in three biological replicates of JHZ and WS. (D) Plots of ATAC-seq signals on both 3-kb sides of the TSS. (E) Average heatmaps of ATAC-seq signals on both 2-kb sides of the TSS. (F) The ATAC-seq and RNA-seq tracks on CsTPR (CSS0022606), as shown in IGV view. The box suggested the promoter region of CsTPR.
Figure 3
Figure 3
Morphological characterization, physiological characterization, and related gene expression levels of CsTPR-silencing tea plant. (A) Representative pictures of CsTPR -silencing tea plant. Blank, blank control. 28hBL, control group. CsTPR AS, experimental group for silencing CsTPR expression. CsTPR S, negative control. Scale bar represents 3 cm. (B) PF (the ratio of PDD/FL) and leaf tip expression angle for CsTPR-silencing tea plant. (C) Lignin staining on cross-sections of the middle part in leaf blades midrib of CsTPR -silencing tea plant with phloroglucinol-HCl. Scale bar represents 100 μm. Lines indicated the maximum length of vascular tissue. (D) Maximum length of vascular tissue, cell number in vascular tissue, and single-cell length in vascular tissue for CsTPR-silencing tea plant. (E) Relative expression level of CsTPR, CsEXL3, and CsBES1.2 in CsTPR -silencing tea plant. For (B) and (D), values are means ± SD of six biological replicates. For (E), values are means ± SD of four biological replicates. Statistical analysis was performed with analysis of variance (ANOVA). Bars with different letters indicate significant difference (P < 0.05).
Figure 4
Figure 4
The promoter structure and expression level of CsTPR. (A) The number of SNPs in different regions of JHZ and WS. (B) The structure of the CsTPR promoter region (chromosome 10, 121089758–121089774 bp) in the sense stand of WS and JHZ according to WGS. (C) The structure of the CsTPR promoter region (chromosome 10, 121089810–121089755 bp) in antisense stand of WS, JHZ, and SCZ as the results of chromosome walking. The mutant site between JHZ and WS was located at −53 bp (chromosome 10, 121089765 bp) to the initiation site. (D) The expression level of CsTPR, CsEXL3, and CsBES1.2 in three types of tissue of JHZ and WS according to RNA-seq. YA, the apical bud and first leaf; M1Y, first mature leaves; M2Y, second mature leaves.
Figure 5
Figure 5
The relationship between the expression levels of CsTPR and CsBES1.2. (A) Relative expression levels of CsTPR and CsBES1.2 in three types of tissue in JHZ and WS according to real-time qPCR. YA, the apical bud and first leaf; M1Y, first mature leaves; M2Y, second mature leaves. Values are means ± SD of three biological replicates. Statistical analysis was performed with ANOVA. **P < 0.01. *P < 0.05. (B) Relative expression levels of CsTPR in CsBES1.2-silencing tea plant. 28hBL, control group. CsBES1.2 AS, the experimental group for silencing CsBES1.2 expression. CsBES1.2 S, negative control. Values are means ± SD of four biological replicates. Statistical analysis was performed with ANOVA. Bars with different letters indicate a significant difference (P < 0.05). (C) A screenshot of the ChIP-seq profile of CsBES1.2 at the promoter and coding region of CsTPR. The box indicates the binding site of CsBES1.2 on the promoter of CsTPR.
Figure 6
Figure 6
The transcription regulation of CsBES1.2 on the expression of CsTPR through binding two types of promoter. (A) Schematic diagram of CsTPR promoters in JHZ and WS, indicating the amplicons used for ChIP-qPCR. Square frame indicated the binding site, P1. The difference of SNP between JHZ and WS was indicated in the square frame. The mutant competitor (Mu-Competitor) sequence was shown below the position of P1. (B) ChIP-qPCR assays of CsBES1.2 on the selected promoter region of CsTPR in JHZ and WS. This selected promoter region included P1. The result of CsGAPDH served as control. The relative enrichment for the ChIP signal was displayed as the percentage of total input DNA. Values are means ± SD of three biological replicates. Statistical analysis was performed with ANOVA. Bars with different letters indicate a significant difference (P < 0.05). (C) Transient expression assays shows that CsBES1.2 represses CsTPR expression. Representative images of N. benthamiana leaves were taken at 48 h after infiltration. The right panel indicates the infiltrated constructs. (D and E) Luminescence intensity (D) and CsBES1.2 expression level (E) under different treatments as indicated in (C). Values are means ± SD of six biological replicates. Different letters indicate significant differences among groups for each locus (one-way ANOVA with Tukey’s test, P < 0.05). (F) DNA EMSA showing the binding of CsBES1.2-MBP to P1 of JHZ CsTPR promoter in vitro. (G) EMSA showing that the binding of CsBES1.2-MBP to P1 of WS CsTPR promoter and the binding activity comparison of CsBES1.2-MBP between WS and JHZ on P1 of CsTPR. Biotin-labeled probes were incubated with CsBES1.2-MBP and the free and bound DNAs were separated on an acrylamide gel. An equal amount of CsBES1.2-MBP was added in each lane.

Similar articles

Cited by

References

    1. Jiang C, Moon D, Ma J. et al. Characteristics of non-volatile metabolites in fresh shoots from tea plant (Camellia sinensis) and its closely related species and varieties. Beverage Plant Res. 2022;2:1–15
    1. Kumar KR, Dashora K, Kumar S. et al. A review of drying technology in tea sector of industrial , non-conventional and renewable energy based drying systems. Appl Therm Eng. 2023;224:1, 120118–25
    1. Liu H, Duan L, Ma J. et al. CsEXL3 regulate mechanical harvest-related droopy leaves under the transcriptional activation of CsBES1.2 in tea plant. Hortic Res. 2024;11:uhae074. - PMC - PubMed
    1. Luo Y, Yu Q, Xie Y. et al. Internode length is correlated with GA3 content and is crucial to the harvesting performance of tea-picking machines. Plants (Basel). 2023;12:2508. - PMC - PubMed
    1. Yu Y, Li W, Liu Y. et al. A Zea genus-specific micropeptide controls kernel dehydration in maize. Cell. 2024;188:1–16 - PubMed

LinkOut - more resources