. 2025 Jul;12(28):e04532.
doi: 10.1002/advs.202504532. Epub 2025 May 20.

A Feedback Loop Between Fatty Acid Metabolism and Epigenetics in Clear Cell Renal Carcinoma

Affiliations

A Feedback Loop Between Fatty Acid Metabolism and Epigenetics in Clear Cell Renal Carcinoma

Zhou Ye et al. Adv Sci (Weinh). 2025 Jul.

Abstract

Lipid storage and epigenetic dysregulation are key features for clear cell renal carcinoma (ccRCC). However, the interplay between fatty acid metabolism and epigenetics in ccRCC remains to be further demonstrated. Here, the landscape of active enhancers is profiled in paired ccRCC samples and identifies 10171 gain variant enhancer loci (VELs) in the tumor tissues. Experimental validation reveals the enhancers targeting FABP5, FABP6, LPCAT1, MET, SEMA5B, SH3GL1, SNX33, and RHBDF2 are oncogenic. Further studies in organoids and animal models prove FABP5 as an oncogene. HIF-2α and ZNF692 transcription factors regulate FABP5 expression through directly binding to its promoter and enhancer. FABP5 is essential for the lipid droplet formation driven by HIFs and critical for H3K27ac and enhancer activity in ccRCC cells. Thus, the study has identified potential targets for drug design and diagnosis and discovered the function of a feedback loop between epigenetics and lipid metabolism regulated by FABP5 in ccRCC.

Keywords: FABP5; H3K27ac; ccRCC; enhancer; lipid droplet.


Conflict of interest statement

The authors declare no conflict of interest.

Figures
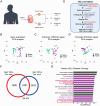
Figure 1
Figure 1
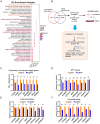
Profiling of tumor‐specific enhancers enriched in ccRCC paired tissues. A) Experimental diagram for studying the enhancer landscapes of tumor and native tissues from ccRCC patient tissues. B–D) PCA analyses to classify tumor and native tissues using gene expression (B), significant enhancers (C), and promoter (D) information identified with our data. E) The comparison between the VELs identified in our studies and one early study.[ 24 ]F) Overlap of enhancer loci between our patient data and 10 primary tumor/normal pairs (GSE86095). G) The disease ontology of the proximal genes of the gain VELs. The purple bars represent cancer‐related diseases, and the black bars represent other diseases.
Figure 2
Figure 2
Functional annotation and validation of tumor‐specific enhancers. A) A dot map showing the enriched biological processes of DEGs (log2(FC) > 1 and false discovery rate [FDR] < 0.05) and genes associated with gain and lost of VELs. The dot color and dot size represent–log10(p‐adjust) and gene ratio, respectively. The purple and orange colors highlight the immune and lipid metabolic processes. B) The workflow of functional enhancer screening by the dCas9‐KRAB‐Mecp2 system. C) Relative mRNA level of FABP5, FABP6, LPCAT1, MET, SEMA5B, SH3GL1, SNX33 and RHBDF2 in control and sgRNA 786‐O cells (n = 3). D–F) MTT (D), colony formation (E), and transwell assays (F) for 786‐O cells stably transfected with dCas9‐KRAB sgRNAs of the mentioned enhancers (n = 3). Bars represent mean values ± SD, * p < 0.05, ** p < 0.01, *** p < 0.001, two‐sided t‐test.
Figure 3
Figure 3
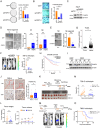
The oncogenic roles of FABP5 in ccRCC. A,B) Colony formation assay (A) and transwell assay(B) of control and FABP5 KO 769‐P cells. C) Validation of FABP5 knockout by western blotting in 769‐P cells. * represents unspecific bands. D) Representative images and quantification data of kidney organoids transfected with GFP or FABP5. n = 5. E) Representative images and quantification data of kidney organoids transfected with control or FABP5 shRNA. n = 5. F) The whole animal bioluminescence (BLI) of control and FABP5‐KD 786‐O cells in the immune‐deficient mice 15 weeks after orthotopic injection. The color scale shows photon flux. The right bars show the average animal size; n  =  6 (control), 8 (shFABP5‐1), 5 (shFABP5‐2). G) The mRNA level (RPKM) of FABP5 (left) in the native and tumor tissues of ccRCC patients from the TCGA database. H) Overall survival rates of FABP5 high‐ and low‐expressed KIRC patients from TCGA, log‐rank test, n = 516 patients. I) Western blotting to measure FABP5 level in the paired ccRCC tissues. J) Representative image and quantitative data of FABP5 IHC staining. n = 17. K) Experimental diagram (up) and tumor images (bottom, n = 11) of intra‐tumoral SBFI‐26 injection to subcutaneous tumors in immune‐deficient mice. L) Weight and volume of subcutaneous tumor in Figure 3K. M) Experimental diagram (up) and animal bioluminescence (BLI) images (bottom) of intraperitoneal SBFI‐26 injection to orthotopic tumors in immune‐deficient mice. N) Survival of Balb/c nude mice upon in situ injection of Luc+ 786‐O cells with SBFI‐26 or control. O) Quantification of mice upon in situ injection of Luc+ 786‐O cells with SBFI‐26 or control at the indicated time. Bars represent mean values ± SD, * p < 0.05, ** p < 0.01, *** p < 0.001, two‐sided t‐test.
Figure 4
Figure 4
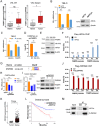
Transcriptional regulation of FABP5 by VHL/HIF and ZNF692. A) FABP5 expression in the normal and tumor tissues with wild‐type VHL (left) or mutant VHL (right) in the ccRCC patient tissues. n = 18 for WT, 6 for mutant. B–D) Relative mRNA level of VEGFA and FABP5 (A), and H3K27ac enrichment on FABP5 enhancer site (B) in control and pVHL 786‐O cells. n = 3. The indicated proteins were measured with western blotting. E) Relative mRNA level of VEGFA and FABP5 in control and HIF2A‐KO 786‐O cells. n = 3. F) HIF‐2α enrichment on FABP5 promoter and enhancer sites in 786‐O detected by ChIP‐qPCR. G) Consensus sequence of the ZNF692 binding motif. H) Relative mRNA level of FABP5 in control and ZNF692‐KO 786‐O cells. I) Colony formation assay of control and ZNF692‐KO 786‐O cells. J) ZNF692 enrichment on FABP5 promoter and enhancer sites in 786‐O transfected with Flag‐ZNF692 detected by ChIP‐qPCR. K) mRNA level (RPKM) of ZNF692 in native and tumor tissues of ccRCC patients from the TCGA database. L) Overall survival rates of patients with KIRC from TCGA stratified based on tumor ZNF692 expression intensity, log‐rank test, n = 516. M) Co‐immunoprecipitation with anti‐Flag in Flag‐ZNF‐692 stably expressed 293T cells and western blotting with the indicated antibodies.
Figure 5
Figure 5
FABP5 is indispensable for lipid accumulation driven by the HIF pathway. A,B) Representative images and statistical results for LD (red) and nuclei (blue) in FABP5‐KO 769‐P cells (A), or FABP5 stably expressed cells (B). C) 786‐O cells were treated with 100 µM SBFI‐26 for 36 h. Representative images for LD (red) and nuclei (blue), and statistical results are shown. n = 9 for DMSO, 8 for SBFI‐26. D) Measurement of triglyceride in control and FABP5 KO 769‐P cells (n = 3). E) VHL was exogenous expressed alone or together with FABP5 in A498 cells. Representative images and statistical results for LD (red) and nuclei (blue) were shown. n = 7 (EV), 11 (VHL), 10 (VHL+FABP5). Western were performed as indicated. F) HIF2A was knocked down w/wo FABP5 expression in A498 cells. Representative fluorescence images and quantitative data of the indicated A498 cells stained for LD (red) and nuclei (blue). n = 6. Bars represent mean values ± SD, * p < 0.05, ** p < 0.01, *** p < 0.001, two‐sided t‐test.
Figure 6
Figure 6
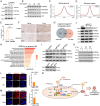
The roles of FABP5 in the crosstalk between lipid metabolism and epigenetic reprogramming. A) Histone acetylation on K9, K18, and K27 of control and FABP5 KO 769‐P cells detected by WB. B) Histone acetylation of 769‐P cells treated with 50 or 100 µM SBFI‐26 for 36 h. C,D) The average H3K27ac signal (RPKM) on the whole genome (C) and enhancer regions (D) in FABP5 high versus FABP5 low tumor tissues. E) Measurement of acetyl‐CoA in control or FABP5‐KO 769‐P cells by mass spec (n = 6). F) IHC staining of FABP5 and H3K27ac in ccRCC tissues. G) Overlapped upregulated genes in FABP5 high versus FABP5 low tumor tissues between TCGA and our patients’ data. H) GO analysis of overlapped genes in (F). I,J) PLIN2 (I) or DGAT1 (J) was knocked down in 769‐P cells, and western blotting was performed with the indicated antibodies. K) 769‐P cells were treated with ATGL inhibitor for the indicated time, and western blotting was performed with the indicated antibodies. L) Representative fluorescence images and statistical data of indicated 769‐P cells treated with 5 µM JQ1 for 36 h, followed by staining for lipid droplets (red) and nuclei (blue). n = 12 (DMSO) or 4 (JQ1). M) Representative fluorescence images and statistical analysis of 769‐P cells treated with 5 µM C646 for 36 h, followed by staining for lipid droplets (red) and nuclei (blue). n = 8 (DMSO) or 6 (C646). N) A sketch for the interplay between lipid droplets regulated by FABP5 and epigenetics in ccRCC. Bars represent mean values ± SD, * p < 0.05, ** p < 0.01, *** p < 0.001, two‐sided t‐test.

References

    1. a) Morgan M. A., Shilatifard A., Genes Dev. 2015, 29, 238; - PMC - PubMed
    2. b) Brookes E., Shi Y., Annu. Rev. Genet. 2014, 48, 237; - PubMed
    3. c) Sharma S., Kelly T. K., Jones P. A., Carcinogenesis 2010, 31, 27; - PMC - PubMed
    4. d) Gu M., Ren B., Fang Y., Ren J., Liu X., Wang X., Zhou F., Xiao R., Luo X., You L., Zhao Y., MedComm 2024, 5, 495; - PMC - PubMed
    5. e) Zou Y., Yang A., Chen B., Deng X., Xie J., Dai D., Zhang J., Tang H., Wu T., Zhou Z., Xie X., Wang J., Drug Resistance Updates 2024, 77, 101126. - PubMed
    1. Hnisz D., Abraham B. J., Lee T. I., Lau A., Saint‐Andre V., Sigova A. A., Hoke H. A., Young R. A., Cell 2013, 155, 934. - PMC - PubMed
    1. Herz H. M., Mohan M., Garruss A. S., Liang K., Takahashi Y. H., Mickey K., Voets O., Verrijzer C. P., Shilatifard A., Genes Dev. 2012, 26, 2604. - PMC - PubMed
    1. Calo E., Wysocka J., Mol. Cell 2013, 49, 825. - PMC - PubMed
    1. Shlyueva D., Stampfel G., Stark A., Nat. Rev. Genet. 2014, 15, 272. - PubMed

MeSH terms

LinkOut - more resources