. 2025 Aug;12(29):e17128.
doi: 10.1002/advs.202417128. Epub 2025 May 20.

Pyruvate Carboxylase in Macrophages Aggravates Atherosclerosis by Regulating Metabolism Reprogramming to Promote Inflammatory Responses Through the Hypoxia-Inducible Factor-1 Signaling Pathway

Affiliations

Pyruvate Carboxylase in Macrophages Aggravates Atherosclerosis by Regulating Metabolism Reprogramming to Promote Inflammatory Responses Through the Hypoxia-Inducible Factor-1 Signaling Pathway

Ling-Na Zhao et al. Adv Sci (Weinh). 2025 Aug.

Abstract

Atherosclerosis (AS) is a major cause of cardiovascular diseases, driven by chronic inflammation and macrophage polarization toward a proinflammatory phenotype. Pyruvate carboxylase (PC), a mitochondrial enzyme involved in glucose metabolism, is implicated in various metabolic disorders; however, its role in AS remains unclear. This study aims to investigate the role and mechanism of PC on macrophages in AS. PC is upregulated in macrophages of humans and mice with AS. Myeloid cell-specific PC knockout mice are generated to investigate the effects of PC deletion on atherosclerotic plaque formation. Myeloid cell-specific PC deficiency mitigates high-fat diet-induced atherosclerotic lesions in apolipoprotein E knockout mice and mice injected with adeno-associated virus-PCSK9DY. PC deletion enhances mitochondrial respiration and reduces glycolytic activity, thereby reducing reactive oxygen species overproduction and mitochondrial damage in macrophages. PC activates the hypoxia-inducible factor-1 (HIF-1) signaling pathway through macrophage metabolic reprogramming. PC induces nuclear translocation of HIF-1α in atherosclerotic aortic roots by preventing HIF-1α from proteasome degradation. HIF-1α stabilizer reverses the anti-inflammatory effect of macrophage-PC ablation in atherogenesis; however, inhibiting HIF-1α suppresses the proinflammatory macrophage phenotype induced by PC overexpression. This study indicates that macrophage PC aggravates AS through macrophage metabolic reprogramming, promoting inflammatory responses in macrophages through the HIF-1 signaling pathway.

Keywords: atherosclerosis; macrophages; metabolism reprogramming; mitochondria; pyruvate carboxylase.


Conflict of interest statement

The authors declare no conflict of interest.

Figures

Figure 1
Figure 1
PC was upregulated in macrophages of humans and mice with atherosclerosis. A) Heatmap of differential genes from the publicly available RNA sequencing data (GSE203250) of RAW 264.7 macrophages treated with VLDL‐sized emulsion particles or vehicle (n = 3). B) PC mRNA levels in HMDMs and BMDMs treated with oxidized low‐density lipoproteins (oxLDL, 80 µg mL−1) for 24 h (n = 6). C,D) Cells were treated with oxLDL (80 µg mL−1) for 24 h (n = 5). Representative immunofluorescence images of PC and CD68 in C) HMDMs and D) BMDMs. Scale bars: 40 µm. E) PC mRNA levels in the PBMCs of healthy participants (non‐CAD) (n = 27; male vs female: 15:12) and patients with CAD (CAD) (n = 53; male vs female: 35:18). F) Representative immunofluorescence images of PC and CD68 in the plaques of aortic sinuses from ApoE−/− male mice fed with chow or HFD (n = 5). The fluorescence intensity of PC was quantified. Scale bars: 100 µm. Data are presented as means ± SD. B–D,F) Unpaired two‐tailed t‐test was used. E) Two‐way analysis of variance with Tukey's correction was used. VLDL, very low‐density lipoprotein; HMDM, human monocyte‐derived macrophage; BMDM, bone marrow‐derived macrophage; CAD, coronary artery diseases; PBMC, peripheral blood mononuclear cell; HFD, high‐fat diet; PC, pyruvate carboxylase.
Figure 2
Figure 2
PC deficiency in macrophages mitigated atherosclerosis in AAV‐PCSK9DY ‐induced mice and chimeric ApoE−/− mice. A) Male PCfl/fl and PCMKO mice were administered with AAV‐PCSK9DY followed by 12 weeks of chow diet or HFD feeding. B) Representative images and quantification of the Oil Red O‐stained aortas from PCfl/fl and PCMKO mice administered with AAV‐PCSK9DY and fed with a 12‐week HFD (n = 8). C) Representative images and quantification of the Oil Red O‐stained aortic root sections (n = 8). Scale bars: 250 µm. D,E) Representative images of HE staining in aortic root sections from PCfl/fl and PCMKO mice administered with AAV‐PCSK9DY and fed with a 12‐week HFD (n = 8). Lesion area D) and necrotic core area E) of the aortic root were quantified. Scale bars for (D): 250 µm; Scale bars for (E): 150 µm. F) Representative images and collagen quantification of the aortic roots stained with Masson staining (n = 8). Scale bars: 250 µm. G) Representative immunofluorescence images of the macrophage marker CD68 in the aortic root (n = 8). Scale bars: 100 µm. H) Procedure of conducting bone marrow transplantation in male ApoE−/ mice. I) Representative images and quantification of the Oil Red O‐stained aortas from chimeric ApoE−/ mice that underwent bone marrow transplantation with bone marrow from PCfl/fl or PCMKO mice after a 12‐week HFD (n = 8). J) Representative images and quantification of the Oil Red O‐stained aortic root sections (n = 8). Scale bars: 250 µm. K,L) Representative images of HE staining in aortic root sections from chimeric ApoE−/ mice receiving bone marrow from PCfl/fl or PCMKO mice after a 12‐week HFD (n = 8). Lesion area K) and necrotic core area L) of the aortic root were quantified. Scale bars for (K): 250 µm; Scale bars for (L): 150 µm. M) Representative images and collagen quantification of the aortic roots stained with Masson staining (n = 8). Scale bars: 250 µm. N) Representative immunofluorescence images of the macrophage marker CD68 in the aortic root (n = 8). Scale bars: 100 µm. Data are presented as means ± SD. B,C,E–G,I–N Unpaired two‐tailed t‐test was used. D) Mann–Whitney U test with the exact method was used. AAV, adeno‐associated virus; HFD, high‐fat diet; PC, pyruvate carboxylase; HE, hematoxylin and eosin; bone marrow‐derived macrophage; BMT, bone marrow transplantation.
Figure 3
Figure 3
PC promoted an inflammatory macrophage phenotype and foam cell formation. A) Serum levels of TNF‐α, IL‐6, IL‐1β, IL‐10, and TGF‐β in PCfl/fl and PCMKO mice administered with AAV‐PCSK9DY and fed with a 12‐week HFD (n = 8). B) Quantification of selected mRNA in BMDMs from PCfl/fl and PCMKO mice treated differently (n = 6). C–H) BMDMs from male PCfl/fl and PCMKO mice were treated with oxLDL (80 µg mL−1) (n = 6). C) Representative images of foam cells in PCfl/fl and PCMKO BMDMs. Scale bars: 40 µm. Quantification of the ratio of foam cells D), unesterified cholesterol E), and cholesteryl ester F) in BMDMs from PCfl/fl and PCMKO mice. Representative images of binding G) and uptake H) of Dil labeled oxLDL (Dil‐oxLDL) in BMDMs. Scale bars: 40 µm. I–N) Primary BMDMs transfected with Ad‐LacZ or Ad‐PC were treated with oxLDL (80 µg mL−1) or PBS (n = 6). I) Representative images of foam cells in BMDMs transfected with Ad‐LacZ and Ad‐PC. Scale bars: 40 µm. Quantification of the ratio of foam cells J), unesterified cholesterol K), and cholesteryl ester L) in BMDMs. Representative images of binding M) and uptake N) of Dil‐oxLDL in BMDMs. Scale bars: 40 µm. Data are presented as means ± SD. A,B,D–H) Unpaired two‐tailed t‐test was used. J–N) Two‐way analysis of variance with Tukey's correction was used. LPS, lipopolysaccharide; IFN‐γ, interferon‐γ; IL, interleukin; oxLDL, oxidized low‐density lipoproteins; BMDM, bone marrow‐derived macrophage; PC, pyruvate carboxylase.
Figure 4
Figure 4
PC deletion reduced metabolic reprogramming and mitochondrial damage in macrophages. A–F) Male PCfl/fl and PCMKO mice that were administered with AAV‐PCSK9DY and fed with a 12‐week HFD were sacrificed. BMDMs were collected for the Seahorse Mito Stress Test (n = 5). Normalized OCR tracing A), basal OCR B), maximal OCR C), proton leak D), ATP production E), and coupling efficiency F) in PCfl/fl and PCMKO BMDMs. G–I) PCfl/fl and PCMKO mice that were administered with AAV‐PCSK9DY and fed with a 12‐week HFD were sacrificed. BMDMs from PCfl/fl and PCMKO mice administered with AAV‐PCSK9DY and fed with a 12‐week HFD were collected for the Seahorse Glycolytic Rate Assay (n = 5). Normalized ECAR tracing G), basal glycolysis H), and compensatory glycolysis I) in PCfl/fl and PCMKO BMDMs. J) Lactate levels in BMDMs from PCfl/fl and PCMKO mice administered with AAV‐PCSK9DY and fed with a 12‐week HFD (n = 6). K) Mitochondrial morphology observed via transmission electron microscopy. Magnification ×15, scale bar: 500 nm. L) PCfl/fl and PCMKO mice that were administered with AAV‐PCSK9DY and chimeric ApoE−/ mice that underwent bone marrow transplantation from PCfl/fl or PCMKO mice were sacrificed to collect BMDMs. Representative images of DHE staining for ROS detection in BMDMs (n = 6). Scale bars: 50 µm. M) Representative JC‐1 staining and relative JC‐1 signal intensity in PCfl/fl and PCMKO BMDMs treated with vehicle or LPS (100 ng mL−1, 12 h) (n = 6). Scale bars: 40 µm. Data are presented as means ± SD. B–E,H,J,L Unpaired two‐tailed t‐test was used. F,I) Mann–Whitney U test with the exact method was used. M) Two‐way analysis of variance with Tukey's correction was used. OCR, oxygen consumption rate; ECAR, extracellular acidification rate; DHE, dihydroethidium; LPS, lipopolysaccharides; BMDM, bone marrow‐derived macrophage; HFD, high‐fat diet; PC, pyruvate carboxylase.
Figure 5
Figure 5
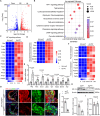
PC activated the HIF‐1 signaling pathway by initiating metabolic reprogramming in macrophages. A–D,F) RNA‐sequencing analysis of BMDMs transfected with Ad‐LacZ and Ad‐PC (n = 3). A) Volcano plot representing the comparison of gene expression in BMDMs transfected with Ad‐LacZ and Ad‐PC. Differentially expressed genes were defined as those with a greater than twofold change and an adjusted P value (Padj) <0.05. Upregulated and downregulated differentially expressed genes are colored in red and blue, respectively. B) KEGG enrichment analysis of RNA sequencing data. C) Heatmap showing the comparison of differentially expressed genes in the HIF‐1 signaling pathway. D) Heatmap revealing the comparison of differentially expressed genes associated with glycolysis and gluconeogenesis. E) Quantification of mRNA levels of genes involved in the HIF‐1 signaling pathway in BMDMs transfected with Ad‐LacZ and Ad‐PC (n = 6). F) Heatmap showing the comparison of differentially expressed genes in pyruvate and fatty acid metabolism. G–I) PCfl/fl and PCMKO mice that were administered with AAV‐PCSK9DY and fed with a 12‐week HFD were sacrificed, and BMDMs were collected for examination (n = 8). G) Representative immunofluorescence images of HIF‐1α and CD68 in the plaques of aortic sinuses from PCfl/fl and PCMKO mice. Scale bars: 100 µm, enlarged: 50 µm. H) Representative HIF‐1α western blotting and protein quantification in PCfl/fl and PCMKO BMDMs. I) HIF‐1α mRNA levels in PCfl/fl and PCMKO BMDMs. Data are presented as means ± SD. E,G–I) Unpaired two‐tailed t‐test was used. AAV, adeno‐associated virus; BMDM, bone marrow‐derived macrophage; HIF‐1, hypoxia‐inducible factor 1; PC, pyruvate carboxylase; KEGG, Kyoto Encyclopedia of Genes and Genomes; HFD, high‐fat diet.
Figure 6
Figure 6
PC upregulated HIF‐1α by preventing its proteasome degradation in macrophages. A,B) BMDMs were isolated from male PCMKO mice and treated with cycloheximide (CHX, 50 µg mL−1), along with MG132 (10 µmol L−1) or chloroquine (CQ, 20 µmol L−1) at different timepoints (n = 6). Representative western blotting A) and quantification B) of HIF‐1α protein in BMDMs with different treatments. C,D) Mouse primary BMDMs were transfected with HA‐HIF‐1α plasmids and Ad‐LacZ or Ad‐PC, followed by CHX treatment at the indicated time (n = 5). HIF‐1α expression C) and quantification D) in BMDMs at different timepoints are presented. E,F) BMDMs were isolated from male PCfl/fl and PCMKO mice and treated with DMSO or MG132 (10 µmol L−1) (n = 6). Representative western blotting E) and quantification F) of HIF‐1α protein in BMDMs with different treatments. G,H) Mouse primary BMDMs were treated with MG132 (10 µmol L−1) and transfected with Ad‐LacZ or Ad‐PC, followed by LPS (100 ng mL−1) stimulation for 12 h (n = 6). Lysates were immunoprecipitated using the HIF‐1α antibody and immunoblotted with antibodies against the indicated proteins. Representative western blotting G) and quantification H) of indicated proteins in BMDMs with different treatments. I,J) BMDMs were isolated from PCfl/fl and PCMKO mice fed with HFD (n = 8). Selected proteins expression I) and quantification J) in BMDMs are presented. K,L) BMDMs were isolated from male PCfl/fl and PCMKO mice and treated with lactate (5 mm) for 12 h (n = 6). Representative western blotting K) and quantification L) of HIF‐1α protein in BMDMs with different treatments. M,N) BMDMs from male ApoE−/‐ mice fed with a chow diet or HFD were collected and transfected with Ad‐LacZ or Ad‐PC (n = 6). HIF‐1α expression M) and quantification N) in BMDMs are presented. O,P) BMDMs from male PCfl/fl and PCMKO mice administrated with AAV‐PCSK9DY and fed with a chow diet or HFD were collected (n = 8). HIF‐1α expression O) and quantification P) in BMDMs are presented. Data are presented as means ± SD. B) One‐way analysis of variance (ANOVA) with Tukey's correction was used. D) Two‐way ANOVA with Bonferroni's multiple comparisons test was used. F,H,L,N,P) Two‐way ANOVA with Tukey's correction was used. J) Unpaired two‐tailed t‐test was used. DMSO, dimethyl sulfoxide; CHX, cycloheximide; CQ chloroquine; HFD, high‐fat diet; BMDM, bone marrow‐derived macrophage; HIF‐1, hypoxia‐inducible factor 1; PC, pyruvate carboxylase.
Figure 7
Figure 7
HIF‐1α regulation by PC in macrophages played a significant role in atherosclerosis. A–I) Male PCMKO mice were administrated with AAV‐PCSK9DY , followed by HFD feeding for 12 weeks and injected with HIF‐1α stabilizer DMOG (8 mg per mouse) or saline for the last 3 weeks (n = 8). BMDMs of PCMKO mice were collected for examination. A) Representative immunofluorescence images of HIF‐1α and CD68 in the plaques of aortic sinuses from PCMKO mice administrated with DMOG or saline. Fluorescence intensity of HIF‐1α in the nucleus of macrophages was quantified. Scale bars: 100 µm, enlarged: 25 µm. B) Representative immunofluorescence images of HIF‐1α and CD68 in BMDMs from PCMKO mice administrated with DMOG or saline. Fluorescence intensity of HIF‐1α in the nucleus of macrophages was quantified. Scale bars: 20 µm. C) Nuclear and cytosolic expression of HIF‐1α in BMDMs from PCMKO mice with DMOG or saline injection (n = 8). D) Representative images and quantification of the Oil Red O‐stained aortas from PCMKO mice. E) Representative images and quantification of the Oil Red O‐stained aortic root sections from PCMKO mice. Scale bars: 250 µm. F,G) Representative images of HE staining in aortic root sections from PCMKO mice. Lesion area F) and necrotic core area G) of the aortic root were quantified. Scale bars for (F): 250 µm; Scale bars for (G): 150 µm. H) Representative images and collagen quantification of the aortic roots stained with Masson staining. Scale bars: 250 µm. I) Quantification of selected mRNA in BMDMs from PCMKO mice administrated with DMOG or saline. J,K) Mouse primary BMDMs were transfected with Ad‐LacZ or Ad‐PC and treated with LW6 (20 µmol L−1) or DMSO for 24 h (n = 6). J) Representative HIF‐1α western blotting and protein quantification in BMDMs transfected with Ad‐LacZ or Ad‐PC, with or without LW6 treatment. K) Selected mRNA levels in BMDMs with different treatments, including LPS/IFN‐γ and IL‐4. Data are presented as means ± SD. A–I), Unpaired two‐tailed t‐test was used. J,K) Two‐way analysis of variance (ANOVA) with Tukey's correction was used. DMOG, dimethyloxalylglycine; AAV, adeno‐associated virus; HFD, high‐fat diet; LPS, lipopolysaccharides; IFN‐γ, interferon‐γ; IL‐4, interleukin‐4; oxLDL, oxidized low‐density lipoproteins; BMDM, bone marrow‐derived macrophage, HIF‐1, hypoxia‐inducible factor 1; PC, pyruvate carboxylase; HE, hematoxylin and eosin.
Figure 8
Figure 8
Pyruvate carboxylase in macrophages aggravates atherosclerosis by regulating metabolism reprogramming to promote inflammatory responses through HIF‐1 signal pathway. PC, pyruvate carboxylase; TCA cycle, tricarboxylic acid cycle; ROS, reactive oxygen species.

Similar articles

References

    1. Arnett D. K., Blumenthal R. S., Albert M. A., Buroker A. B., Goldberger Z. D., Hahn E. J., Himmelfarb C. D., Khera A., Lloyd‐Jones D., McEvoy J. W., Michos E. D., Miedema M. D., Muñoz D., Smith S. C., Virani S. S., Williams K. A., Yeboah J., Ziaeian B., J. Am. Coll. Cardiol. 2019, 74, 177. - PMC - PubMed
    1. Barrett T. J., Arterioscler. Thromb. Vasc. Biol. 2020, 40, 20. - PMC - PubMed
    1. Stary H. C., Chandler A. B., Dinsmore R. E., Fuster V., Glagov S., Insull W., Rosenfeld M. E., Schwartz C. J., Wagner W. D., Wissler R. W., Arterioscler. Thromb. Vasc. Biol. 1995, 15, 1512. - PubMed
    1. Seimon T. A., Nadolski M. J., Liao X., Magallon J., Nguyen M., Feric N. T., Koschinsky M. L., Harkewicz R., Witztum J. L., Tsimikas S., Golenbock D., Moore K. J., Tabas I., Cell Metab. 2010, 12, 467. - PMC - PubMed
    1. Libby P., Ridker P. M., Maseri A., Circulation 2002, 105, 1135. - PubMed

MeSH terms

Substances

LinkOut - more resources