. 2025 Jun 11;16(6):e0093025.
doi: 10.1128/mbio.00930-25. Epub 2025 May 20.

Microbial vitamin biosynthesis links gut microbiota dynamics to chemotherapy toxicity

Affiliations

Microbial vitamin biosynthesis links gut microbiota dynamics to chemotherapy toxicity

Lars E Hillege et al. mBio. .

Abstract

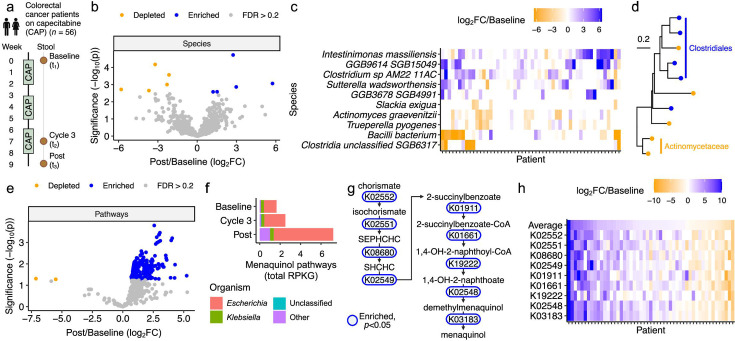
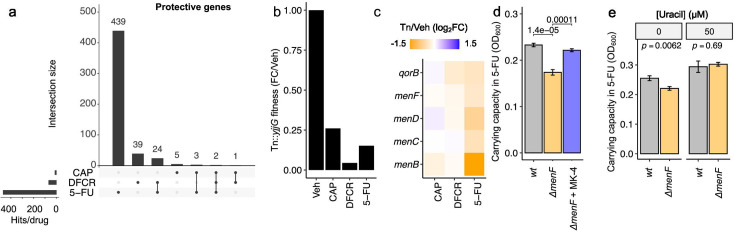
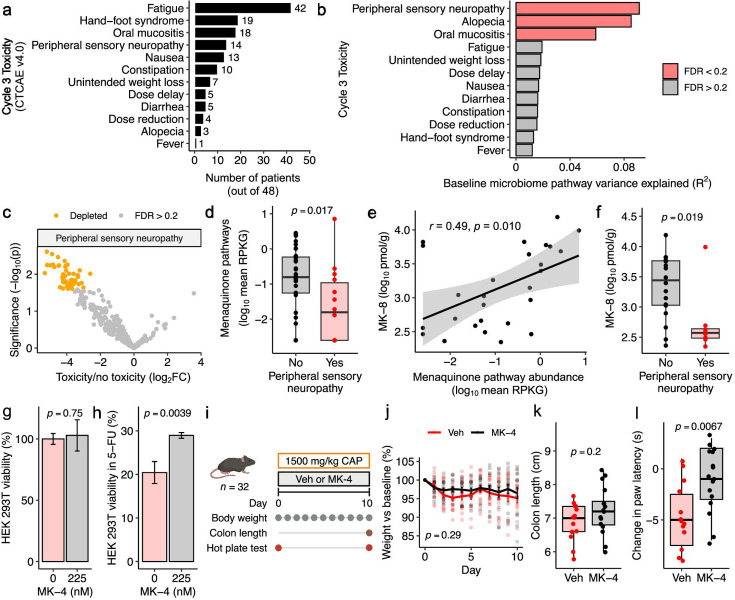
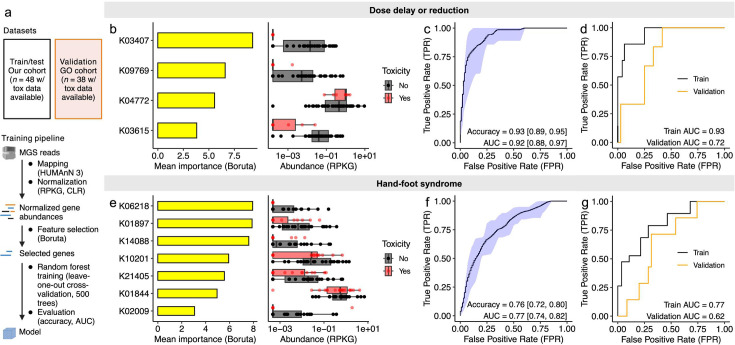
Dose-limiting toxicities pose a major barrier to cancer treatment. While preclinical studies show that the gut microbiota influences and is influenced by anticancer drugs, data from patients paired with careful side effect monitoring remains limited. Here, we investigate capecitabine (CAP)-microbiome interactions through longitudinal metagenomic sequencing of stool from 56 advanced colorectal cancer patients. CAP significantly altered the gut microbiome, enriching for menaquinol (vitamin K2) biosynthesis genes. Transposon library screens, targeted gene deletions, and media supplementation revealed that menaquinol biosynthesis protects Escherichia coli from drug toxicity. Stool menaquinol gene and metabolite levels were associated with decreased peripheral sensory neuropathy. Machine learning models trained in this cohort predicted toxicities in an independent cohort. Taken together, these results suggest treatment-associated increases in microbial vitamin biosynthesis serve a chemoprotective role for bacterial and host cells. Further, our findings provide a foundation for in-depth mechanistic dissection, human intervention studies, and extension to other cancer treatments.IMPORTANCESide effects are common during the treatment of cancer. The trillions of microbes found within the human gut are sensitive to anticancer drugs, but the effects of treatment-induced shifts in gut microbes for side effects remain poorly understood. We profiled gut microbes in colorectal cancer patients treated with capecitabine and carefully monitored side effects. We observed a marked expansion in genes for producing vitamin K2 (menaquinone). Vitamin K2 rescued gut bacterial growth and was associated with decreased side effects in patients. We then used information about gut microbes to develop a predictive model of drug toxicity that was validated in an independent cohort. These results suggest that treatment-associated increases in bacterial vitamin production protect both bacteria and host cells from drug toxicity, providing new opportunities for intervention and motivating the need to better understand how dietary intake and bacterial production of micronutrients like vitamin K2 influence cancer treatment outcomes.

Keywords: chemotherapy; colorectal cancer; human gut microbiome; metagenomics; vitamin K.


Conflict of interest statement

For conflicts of interest, see Acknowledgments.

Figures

Fig 1
Fig 1
Capecitabine (CAP) alters the human gut microbiome. (a) Study design. Patients with advanced colorectal cancer (CRC) were treated with three cycles of CAP, with stool collected at baseline (t1), during cycle 3 (t2), and post-treatment (t3). Created with BioRender.com. (b) Volcano plot of species post-treatment (t3) versus baseline (t1). Points represent significantly enriched (blue) and depleted (orange) species (FDR < 0.2). (c) Heatmap of differentially abundant species from panel b, with patients and species ordered by McQuitty hierarchical clustering of log2 fold change (log2FC) of post (t3) versus baseline (t1). (d) Phylogenetic tree of differentially abundant species from panel b, with labels for clades where treatment affected multiple clade members similarly (enriched [blue] or depleted [orange]). (e) Volcano plot of HUMAnN 3.0 gene pathways at post (t3) versus baseline (t1). Points represent significantly enriched (blue) and depleted (orange) pathways (FDR < 0.2). Seven of the top 10 most significantly altered pathways are menaquinol biosynthesis pathways. (f) Genera of microbes contributing to menaquinol biosynthesis pathways. (g) KEGG orthologous groups (KOs) shared across all enriched menaquinol biosynthesis pathways in panel f. Blue indicates P < 0.05. (h) Heatmap of all KOs from panel g, with patients ordered by average log2FC (top row, “average”) and KOs ordered by occurrence in the menaquinol biosynthesis pathway. (b, e, g) P-value: mixed effects model of central log ratio (CLR)-normalized abundance versus time, with patient as a random effect.
Fig 2
Fig 2
Menaquinol biosynthesis rescues bacterial sensitivity to fluoropyrimidines. (a–c) An E. coli RB-TnSeq library was treated with 500 µM of capecitabine (CAP), 5′-deoxy-5-fluorocytidine (DFCR), 5-fluorouracil (5-FU), or vehicle (Veh) in duplicate for 48 hours. (a) Upset plot of significantly depleted transposon-disrupted genes (intact gene is protective) across all three conditions. (b) Fitness of Tn::yjjG mutant in all four conditions, relative to vehicle. Values represent the mean of two biological replicates. (c) Gene set enrichment analysis of protective genes from panel a revealed quinone biosynthesis as the sole significantly enriched pathway (hypergeometric P < 0.01). RB-TnSeq fold changes of enriched protective quinone biosynthesis genes are depicted. (d and e) E. coli BW25113 wild-type (wt) and ΔmenF::KanRmenF) were treated with 500 µM 5-FU ± 225 nM menaquinone (MK-4) (d) or ± 50 µM uracil (e) for 24 hours, with carrying capacity quantified with Growthcurver. P-values: deviation from linearity on quantile-quantile plot (a), Student’s t-test (d and e).
Fig 3
Fig 3
Pre-treatment microbial gene pathways are associated with the development of toxicities during treatment. (a) Distribution of Grade 1+ toxicities in patients at cycle 3 (t2). (b) Permutational multivariate analysis of variance (PERMANOVA) testing of cycle 3 (t2) toxicities with respect to baseline bacterial gene family composition. P-value: PERMANOVA test using the central log ratio (CLR)-transformed Euclidean metric of baseline bacterial pathway composition, with FDR calculated with Benjamini-Hochberg multiple-testing correction. (c) Volcano plot of baseline gene pathways in patients who went on to have peripheral sensory neuropathy (PSN) or no PSN during treatment. Colored points represent significantly depleted (orange) pathways (FDR < 0.2). P-value: linear model of abundance versus toxicity. Five of the top 10 most significantly altered pathways are menaquinol biosynthesis superpathways. (d) Baseline menaquinone pathway gene abundance versus t2 PSN. P-value: Wilcoxon rank-sum test. (e) Menaquinone pathway gene abundance versus stool menaquinone-8 (MK-8) metabolite abundance. R, P-value: Pearson’s correlation. (f) Baseline stool MK-8 metabolite abundance versus t2 PSN. P-value: Wilcoxon rank-sum test. (g and h) HEK 293T cells were incubated for 48 hours ±225 nM menaquinone (MK-4) in the absence (g) and presence (h) of 75 µM 5-FU, with viability measured by MTT assay and normalized to cells grown in MK-4-free, 5-FU-free media. (i–l) Thirty-two mixed-sex mice were treated with 1,500 mg/kg capecitabine (CAP) ± 40 mg/kg MK-4 by oral gavage daily for 10 days, with body weight measured daily, colon length measured on day 10, and paw latency at 52°C hot plate test measured on days 0 and 10. (i) Experimental design schematic. (j) Body weights. (k) Endpoint colon length. (l) Per-mouse change in paw withdrawal latency between day 0 and day 10. Negative values correspond with more severe paw sensitivity. P-values: Mann-Whitney U-test (g, h, k), two-way ANOVA (j), Wilcoxon signed-rank test (l). Sample size: patients with at least one documented t2 toxicity event (n = 48; a and b); patients with documented PSN status (n = 47; c and d); patients with stool metabolite data (n = 27; e); patients with stool metabolite data and documented PSN status (n = 26; f); biological replicate wells (n = 6/group; g and h); mice (n = 32; i–l).
Fig 4
Fig 4
The baseline gut microbiome predicts drug side effect profiles. (a) Random forest pipeline. For each toxicity of interest, metagenomic sequencing reads were mapped to KEGG orthologous groups (KOs) using HUMAnN 3 and normalized as reads per kilobase per genome equivalent (RPKG), followed by a central log ratio (CLR) transform, followed by feature selection with Boruta. A random forest algorithm was trained on these features using leave-one-out cross-validation (LOOCV) with 500 trees, followed by evaluation on our cohort and an independent validation cohort of 38 American patients with toxicity data available (12). Created with BioRender.com. (b and e) Importance scores and baseline (t1) abundances of Boruta-selected KOs to classify dosing changes (b) or hand-foot syndrome (HFS) (e) during treatment (t2). (c and f) Receiver operating characteristic (ROC) curve for classification of dosing changes (c) or HFS (f) with random forest models built with Boruta-selected KOs tested with LOOCV. The black line represents the mean, and the blue shaded area represents the 95% confidence interval obtained across 100 independent models. Accuracy and area under the curve (AUC) are displayed, with 95% confidence intervals in brackets. (d and g) Evaluation of a model trained on our data set and validated on an independent cohort of 38 American patients to predict dosing changes (d) or HFS (g).

References

    1. de la Cuesta-Zuluaga J, Boldt L, Maier L. 2024. Response, resistance, and recovery of gut bacteria to human-targeted drug exposure. Cell Host Microbe 32:786–793. doi: 10.1016/j.chom.2024.05.009 - DOI - PubMed
    1. Trepka KR, Olson CA, Upadhyay V, Zhang C, Turnbaugh PJ. 2025. Pharma[e]cology: how the gut microbiome contributes to variations in drug response. Annu Rev Pharmacol Toxicol 65:355–373. doi: 10.1146/annurev-pharmtox-022724-100847 - DOI - PMC - PubMed
    1. Schuurhuizen CS, Verheul HM, Braamse AM, Buffart LM, Bloemendal HJ, Dekker J, Konings IR. 2018. The predictive value of cumulative toxicity for quality of life in patients with metastatic colorectal cancer during first-line palliative chemotherapy. Cancer Manag Res 10:3015–3021. doi: 10.2147/CMAR.S166468 - DOI - PMC - PubMed
    1. Van Cutsem E, Cervantes A, Adam R, Sobrero A, Van Krieken JH, Aderka D, Aranda Aguilar E, Bardelli A, Benson A, Bodoky G, et al. 2016. ESMO consensus guidelines for the management of patients with metastatic colorectal cancer. Ann Oncol 27:1386–1422. doi: 10.1093/annonc/mdw235 - DOI - PubMed
    1. Benson AB, Venook AP, Al-Hawary MM, Arain MA, Chen Y-J, Ciombor KK, Cohen S, Cooper HS, Deming D, Farkas L, et al. 2021. Colon cancer, version 2.2021, NCCN clinical practice guidelines in oncology. J Natl Compr Canc Netw 19:329–359. doi: 10.6004/jnccn.2021.0012 - DOI - PubMed

MeSH terms