Multicenter Study
. 2025 Jun 11;16(6):e0063425.
doi: 10.1128/mbio.00634-25. Epub 2025 May 20.

Metformin as antiviral therapy protects hyperglycemic and diabetic patients

Affiliations
Multicenter Study

Metformin as antiviral therapy protects hyperglycemic and diabetic patients

Xi Wang et al. mBio. .

Abstract

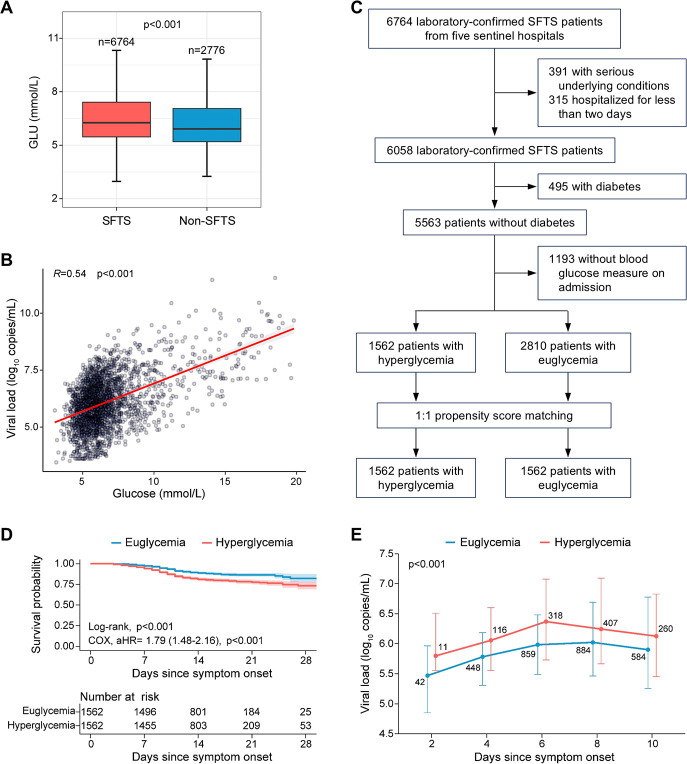
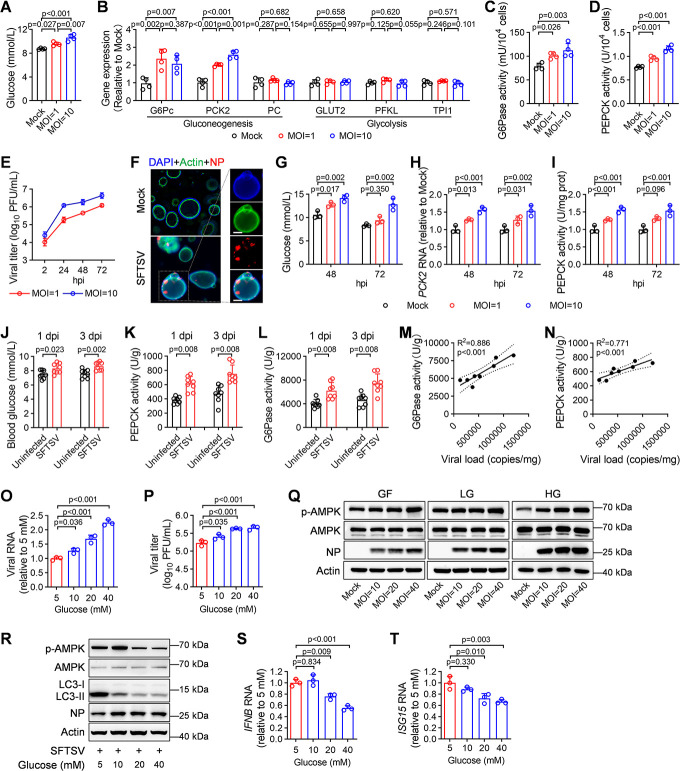
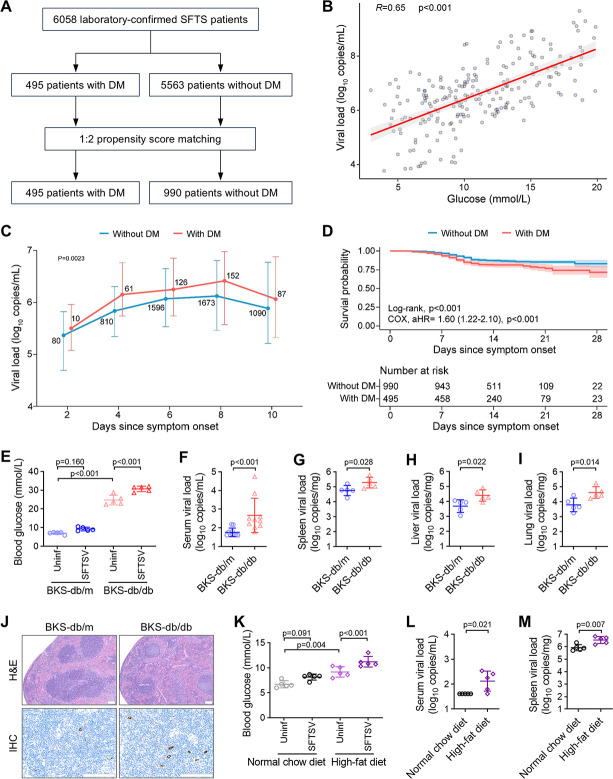
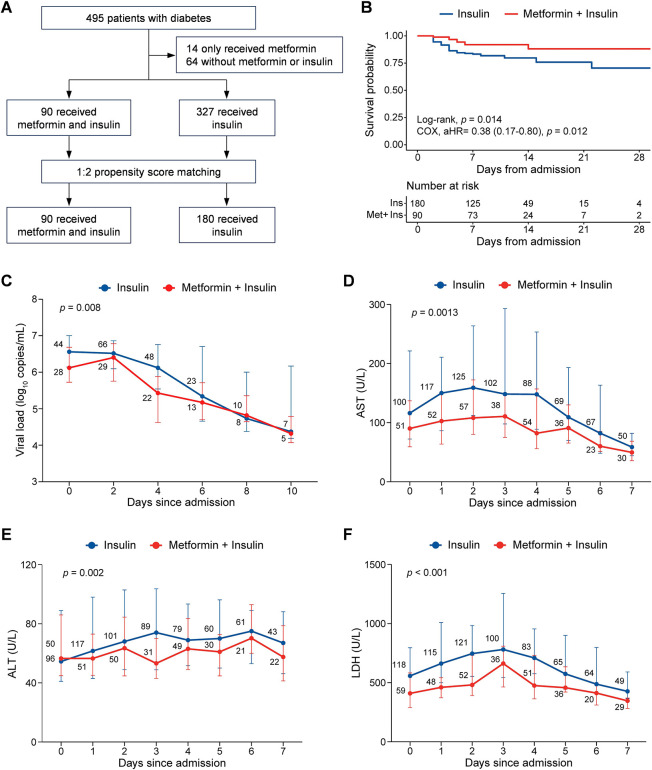
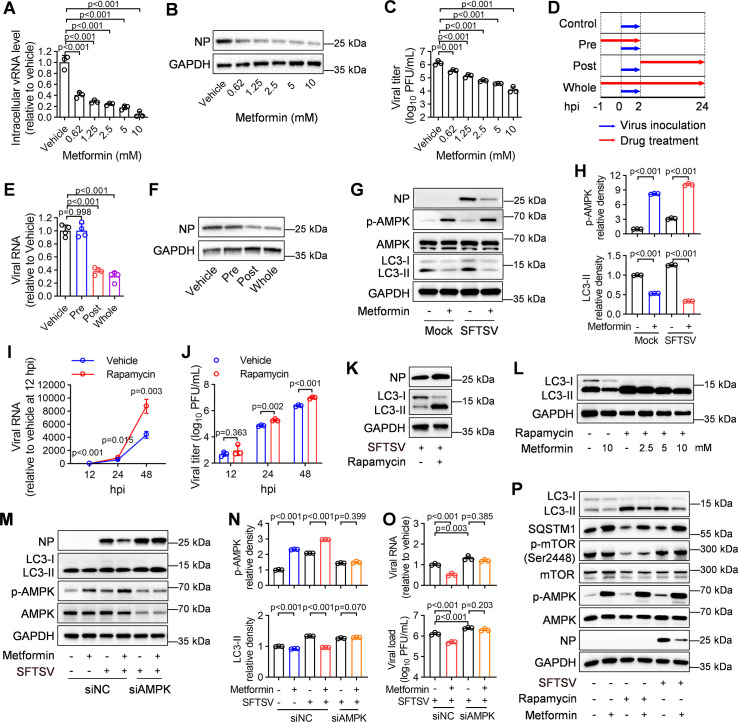
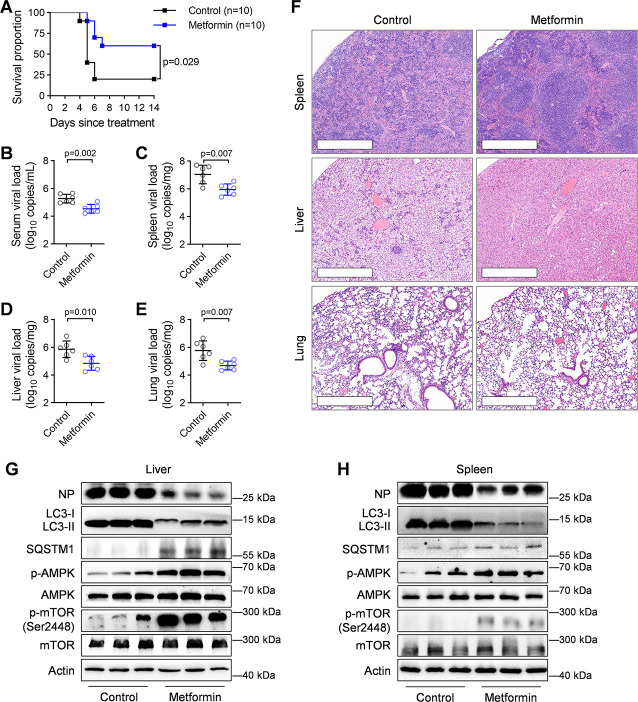
Viral infections disrupt glucose metabolism; however, their impact on disease prognosis in highly pathogenic viruses remains largely unknown. There is an additional need to investigate the antiviral mechanisms of glucose-lowering therapeutics. Here, our multicenter clinical study shows that hyperglycemia and pre-existing diabetes are independent risk factors for mortality in patients infected with severe fever with thrombocytopenia syndrome virus (SFTSV), an emerging and highly pathogenic bunyavirus. SFTSV infection triggers gluconeogenesis, which, in turn, inhibits AMPK activity and subsequent interferon I (IFN-I) responses, thereby facilitating viral replication. In vitro and animal studies further reveal that metformin inhibits SFTSV replication by suppressing autophagy through the AMPK-mTOR pathway, contributing to protection against lethal SFTSV infection in mice. Importantly, our large cohort study demonstrates that metformin reduces viremia and SFTSV-related mortality in patients with hyperglycemia or pre-existing diabetes, contrasting with the disadvantageous effect of insulin. These findings highlight the promising therapeutic potential of metformin in treating viral infections, particularly among individuals with hyperglycemia or diabetes.

Importance: Severe fever with thrombocytopenia syndrome virus (SFTSV), an emerging tick-borne bunyavirus, causes severe hemorrhagic fever with a high mortality rate. Previous studies have shown metabolic disturbances, particularly hyperglycemia, in SFTSV-infected individuals. However, the mechanism underlying this metabolic derangement remains unclear, and further investigation is needed to determine whether glucose-lowering therapeutics could be beneficial for SFTSV-infected patients. In this study, our multicenter clinical data show that hyperglycemia and pre-existing diabetes are independent risk factors for mortality in patients with SFTSV infection. Furthermore, we observed that SFTSV infection triggers gluconeogenesis, which promotes viral replication through the regulation of the AMPK-IFN-I signaling pathway. Notably, metformin significantly reduces viremia and SFTSV-related mortality in patients with hyperglycemia or pre-existing diabetes, attributed to its inhibitory effect on autophagy through the AMPK-mTOR pathway. Therefore, our study uncovers the interaction between SFTSV infection and glucose metabolic disorder and highlights the promising therapeutic potential of metformin for treating SFTSV infection.

Keywords: antiviral therapy; diabetes; hyperglycemia; metformin; severe fever with thrombocytopenia syndrome virus.


Conflict of interest statement

The authors declare no conflict of interest.

Figures

Fig 1
Fig 1
SFTSV infection induces hyperglycemia that leads to poor prognosis in individuals without underlying diabetes. (A) Comparison of blood glucose (GLU) levels at admission between SFTS and non-SFTS patients. The P-value was calculated by the Wilcoxon rank-sum test. (B) Pearson correlation coefficient between blood glucose levels and SFTSV viral loads in SFTS patients. (C) Flowchart of the recruitment and grouping process for SFTS patients. A total of 6,764 patients admitted into five sentinel hospitals for SFTS were included in the retrospective clinical investigation and divided into hyperglycemia and euglycemia groups using propensity score matching. (D) Analysis of hyperglycemia on the survival probability of SFTS patients. The Kaplan-Meier method was used to analyze time-to-event data. Adjusted HR and 95% CI were conducted by a multivariable COX regression with adjustment for age, sex, onset-to-admission interval, and pre-existing comorbidities. (E) Dynamic profiles of SFTSV viral loads between the hyperglycemia and euglycemia groups. Data were presented as median and interquartile range. A GEE model was performed to consider the effect of age, sex, and onset-to-admission interval. The number of SFTS patients included for analysis at each time point was added to the line graphs.
Fig 2
Fig 2
SFTSV infection triggers gluconeogenesis to facilitate viral replication. (A) Glucose level was measured in the supernatant of mock- and SFTSV-infected Huh7 cells at 48 hours post-infection (hpi); n = 4 biologically independent samples. (B) The mRNA levels of gluconeogenesis (G6Pc, PCK2, and PC) and glycolysis genes (GLUT2, PFKL, and TPI1) were measured in mock-infected and SFTSV-infected Huh7 cells at 48 hpi; n = 4 biologically independent samples. (C, D) The levels of G6pase (C) and PEPCK activity (D) were measured in mock- and SFTSV-infected Huh7 cells at 48 hpi; n = 4 biologically independent samples. (E) Viral titers were measured in the supernatant of primary human hepatocytes (PHHs)-derived liver organoids infected with SFTSV (MOI = 10) at 2, 24, 48, and 72 hpi; n = 3 biologically independent samples. (F) Immunofluorescence analysis of mock- and SFTSV-infected PHHs-derived liver organoids at 72 hpi. The enlarged images on the right are from SFTSV-infected PHHs-derived liver organoids. Scale bars, 100 µm. (G–I) The supernatant glucose levels (G), PCK2 mRNA levels (H), and PEPCK activity (I) were measured in mock- and SFTSV-infected liver organoids at 48 and 72 hpi; n = 3 biologically independent samples. (J–L) The levels of blood glucose (J), PEPCK activity (K), and G6Pase activity (L) in liver from uninfected or SFTSV-infected mice at 1 and 3 days post-infection (dpi) (n = 8 per group). (M, N) Pearson correlation coefficient between viral loads and G6Pase activity (M) or PEPCK activity (N) in liver (n = 8). Dotted lines indicate the 95% confidence interval. (O, P) Intracellular SFTSV RNA level (O) and supernatant viral titers (P) were measured in SFTSV-infected Huh7 cells (MOI = 0.1) cultured with DMEM containing indicated glucose concentrations at 24 hpi; n = 3 biologically independent samples. (Q) Whole-cell extracts (WCEs) from SFTSV-infected Huh7 cells cultured in glucose-free (0 mM glucose, GF), low-glucose (5 mM glucose, LG), or high-glucose (20 mM glucose, HG). DMEM were analyzed by immunoblotting analysis using the indicated antibodies at 24 hpi. (R) WCEs from SFTSV-infected Huh7 cells (MOI = 1) cultured with DMEM containing indicated glucose concentrations were analyzed by immunoblotting analysis using the indicated antibodies at 24 hpi. (S, T) The mRNA levels of IFNB (S) and ISG15 (T) were measured in SFTSV-infected Huh7 (MOI = 0.1) cultured with DMEM containing indicated glucose concentrations at 24 hpi; n = 3 biologically independent samples. Data were presented as mean ± s.d. The two-sided P values were examined using Student’s t test (J) or Wilcoxon test (K, L) for comparison of variables between two groups or one-way ANOVA followed by Tukey’s multiple comparisons test for comparison of continuous variables among multiple groups (A–D, G–I, O, P, S, T). The presented images are representative of three independent experiments in immunoblotting analysis (F, Q, R).
Fig 3
Fig 3
Underlying diabetes is associated with increased risk for enhanced viremia levels and increased fatality of SFTSV infection. (A) Flowchart of the recruitment and grouping process for SFTS patients. Among 6,058 laboratory-confirmed SFTS patients recruited, 495 patients with underlying diabetes and 990 patients without underlying diabetes matched by propensity score matching were included for analysis. (B) Pearson correlation coefficient between blood glucose levels and SFTSV viral loads in SFTS patients. (C) Dynamic profiles of SFTSV viral loads between patients with diabetes and those without diabetes. Data were presented as median and interquartile range. A GEE model was performed to consider the effect of age, sex, and onset-to-admission interval. The number of SFTS patients included for analysis at each time point was added to the line graphs. (D) Analysis of underlying diabetes on survival probability. The Kaplan-Meier method was used to analyze time-to-event data. Adjusted HR and 95% CI were conducted by a multivariable COX regression adjusted for age, sex, onset-to-admission interval, and pre-existing comorbidities. (E) Blood glucose levels of uninfected or SFTSV-infected BKS-db/bd and BKS-db/m mice at 3 days post-infection (dpi) (n = 5 per group). (F–I) Viral loads in serum (F; n = 10 per group) and tissue samples (n = 5 per group), including spleen (G), liver (H), and lung (I), collected from SFTSV-infected BKS-db/bd and BKS-db/m mice at 3 dpi. (J) Representative images from three biologically independent samples of spleen sections from SFTSV-infected BKS-db/bd and BKS-db/m mice at 3 dpi, stained with H&E or a rabbit polyclonal antibody against SFTSV NP. (K) Blood glucose levels of uninfected or SFTSV-infected normal chow diet and high-fat diet fed mice at 3 dpi (n = 5 per group). (L, M) Viral loads in serum (L) and spleen (M) from SFTSV-infected normal chow diet and high-fat diet fed mice at 3 dpi (n = 5 per group). Data were presented as mean ± s.d. The two-sided P values were examined using the Wilcoxon test (F) or Student’s t test (G–I, L, M) for comparison of variables between two groups, or using a two-way ANOVA multiple comparisons test for comparison of continuous variables among multiple groups (E, K).
Fig 4
Fig 4
Clinical efficacy of metformin in treating SFTS patients with underlying diabetes. (A) Flowchart of the recruitment and grouping process for SFTS patients. Among 495 laboratory-confirmed SFTS patients with underlying diabetes recruited, 90 patients receiving combined metformin and insulin and 180 patients receiving insulin treatment alone by propensity score matching were included for analysis. (B) Analysis of metformin treatment on the survival probability of SFTS patients. The Kaplan-Meier method was used to analyze time-to-event data. Adjusted HR and 95% CI were conducted by a multivariable COX regression adjusted for age, sex, onset-to-admission interval, and pre-existing comorbidity. (C–F) Dynamic profiles of SFTSV viral load (C) and levels of AST (D), ALT (E), and LDH (F), between patients receiving combined metformin and insulin and those receiving insulin treatment alone. Data were presented as median and interquartile range. A GEE model was performed to consider the effect of age, sex, and onset-to-admission interval. The number of SFTS patients included for analysis at each time point was added to the line graphs.
Fig 5
Fig 5
Metformin suppresses autophagy via modulation of the AMPK-mTOR pathway to inhibit SFTSV replication. (A–C) Intracellular SFTSV RNA level (A), NP levels (B), and supernatant viral titers (C) were measured in SFTSV-infected Huh7 cells (MOI = 1) cultured with indicated concentrations of metformin at 24 hpi; n = 3 biologically independent samples. (D) Schematic diagram of the time-of-addition assay of metformin. (E, F) Huh7 cells infected with SFTSV (MOI = 0.1) for 2 h were treated with vehicle (control) or metformin in pre-infection, post-infection, or whole time. Intracellular SFTSV RNA levels (E) and NP levels (F) were measured at 24 hpi; n = 4 biologically independent samples. (G, H) SFTSV-infected Huh7 cells (MOI = 1) cultured with DMEM containing 20 mM glucose were treated with metformin (5 mM) for 24 h. Whole-cell extracts (WCEs) were analyzed by immunoblotting analysis using the indicated antibodies (G). The relative density of p-AMPK and LC3-II was compared among groups (H). (I, J) Intracellular SFTSV RNA level (I) and supernatant viral titers (J) were measured in SFTSV-infected Huh7 cells (MOI = 0.1) treated with rapamycin (10 µM) at 12, 24, and 48 hpi; n = 3 biologically independent samples. (K) WCEs from rapamycin-treated Huh7 cells at 24 hpi were analyzed by immunoblotting analysis using the indicated antibodies. (L) WCEs from Huh7 cells treated with rapamycin (10 µM) and metformin for 24 h were analyzed by immunoblotting analysis using the indicated antibodies. (M–O) AMPK-knockdown Huh7 cells were infected with SFTSV (MOI = 1) and treated with metformin. Indicated proteins in WCEs (M), intracellular SFTSV RNA levels, and supernatant viral titers (O) were measured at 24 hpi; n = 3 biologically independent samples. The relative density of p-AMPK and LC3-II was compared among groups (N). (P) WCEs from SFTSV-infected or rapamycin-treated Huh7 cells in the presence or absence of metformin were analyzed by immunoblotting analysis using the indicated antibodies. Data were presented as mean ± s.d. The two-sided P values were examined using Student’s t test for comparison of variables between two groups (I, J), one-way ANOVA followed by Tukey’s multiple comparisons test (A, C, E, N), or two-way ANOVA for comparison of continuous variables among multiple groups (H, O). The presented images are representative of three independent experiments in immunoblotting analysis (G, K, L, M, P).
Fig 6
Fig 6
Treatment effectiveness of metformin against lethal SFTSV infection in BKS-db/db mice. (A) Survival curves of metformin- or vehicle-treated BKS-db/bd mice (n = 10 per group) that were pretreated with anti-IFNAR1 IgG antibody and infected with SFTSV (4 × 10⁴ PFU per mouse). The Kaplan-Meier method was used to analyze time-to-event data. (B–E) Viral loads in serum (B), spleen (C), liver (D), and lung (E) from SFTSV-infected SK-db/bd mice with or without (control group) metformin treatment at 5 days post-infection (dpi) (n = 6 per group). Data were presented as mean ± s.d. The two-sided P values were examined using Student’s t test. (F) Representative hematoxylin and eosin (H&E) images from three biologically independent samples of spleen, liver, and lung sections from SFTSV-challenged BKS-db/bd mice with or without metformin treatment at 5 dpi. Scare bar: 500 µm. (G, H) Liver (G) and spleen samples (H) from SFTSV-challenged BKS-db/bd mice with or without metformin treatment at 5 dpi were analyzed by immunoblotting with the indicated antibodies (n = 3 biologically independent samples).

Similar articles

References

    1. Häusl AS, Balsevich G, Gassen NC, Schmidt MV. 2019. Focus on FKBP51: a molecular link between stress and metabolic disorders. Mol Metab 29:170–181. doi: 10.1016/j.molmet.2019.09.003 - DOI - PMC - PubMed
    1. Han HS, Kang G, Kim JS, Choi BH, Koo SH. 2016. Regulation of glucose metabolism from a liver-centric perspective. Exp Mol Med 48:e218. doi: 10.1038/emm.2015.122 - DOI - PMC - PubMed
    1. Gassen NC, Papies J, Bajaj T, Emanuel J, Dethloff F, Chua RL, Trimpert J, Heinemann N, Niemeyer C, Weege F, et al. 2021. SARS-CoV-2-mediated dysregulation of metabolism and autophagy uncovers host-targeting antivirals. Nat Commun 12:3818. doi: 10.1038/s41467-021-24007-w - DOI - PMC - PubMed
    1. Singh S, Singh PK, Suhail H, Arumugaswami V, Pellett PE, Giri S, Kumar A. 2020. AMP-activated protein kinase restricts Zika virus replication in endothelial cells by potentiating innate antiviral responses and inhibiting glycolysis. J Immunol 204:1810–1824. doi: 10.4049/jimmunol.1901310 - DOI - PMC - PubMed
    1. Barreto EA, Cruz AS, Veras FP, Martins R, Bernardelli RS, Paiva IM, Lima TM, Singh Y, Guimarães RC, Damasceno S, et al. 2023. COVID-19-related hyperglycemia is associated with infection of hepatocytes and stimulation of gluconeogenesis. Proc Natl Acad Sci USA 120:e2217119120. doi: 10.1073/pnas.2217119120 - DOI - PMC - PubMed

MeSH terms

LinkOut - more resources