. 2025 May 20;41(1):86.
doi: 10.1007/s10565-025-10035-5.

Neuron-like macrophage differentiation via the APOE-TREM2 axis contributes to chronic pain in nasopharyngeal carcinoma

Affiliations

Neuron-like macrophage differentiation via the APOE-TREM2 axis contributes to chronic pain in nasopharyngeal carcinoma

Hongxi Li et al. Cell Biol Toxicol. .

Abstract

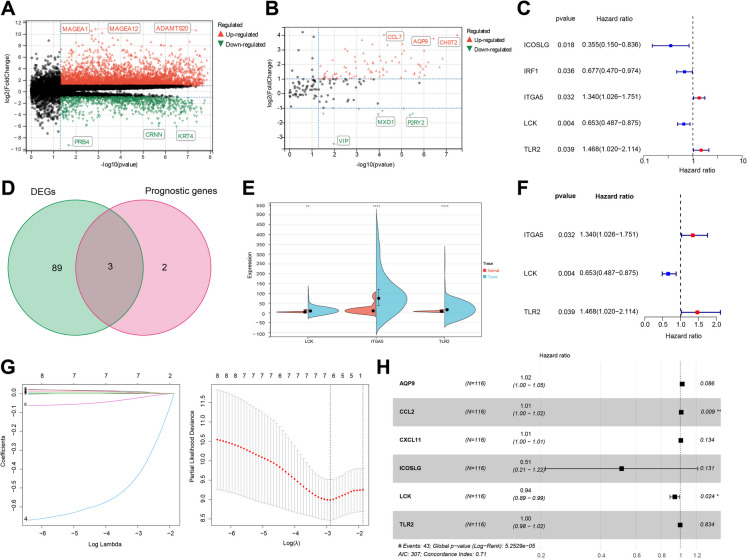
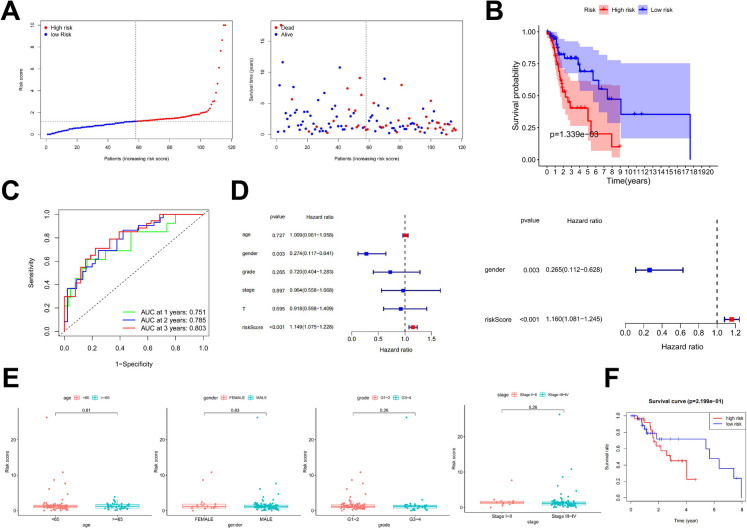
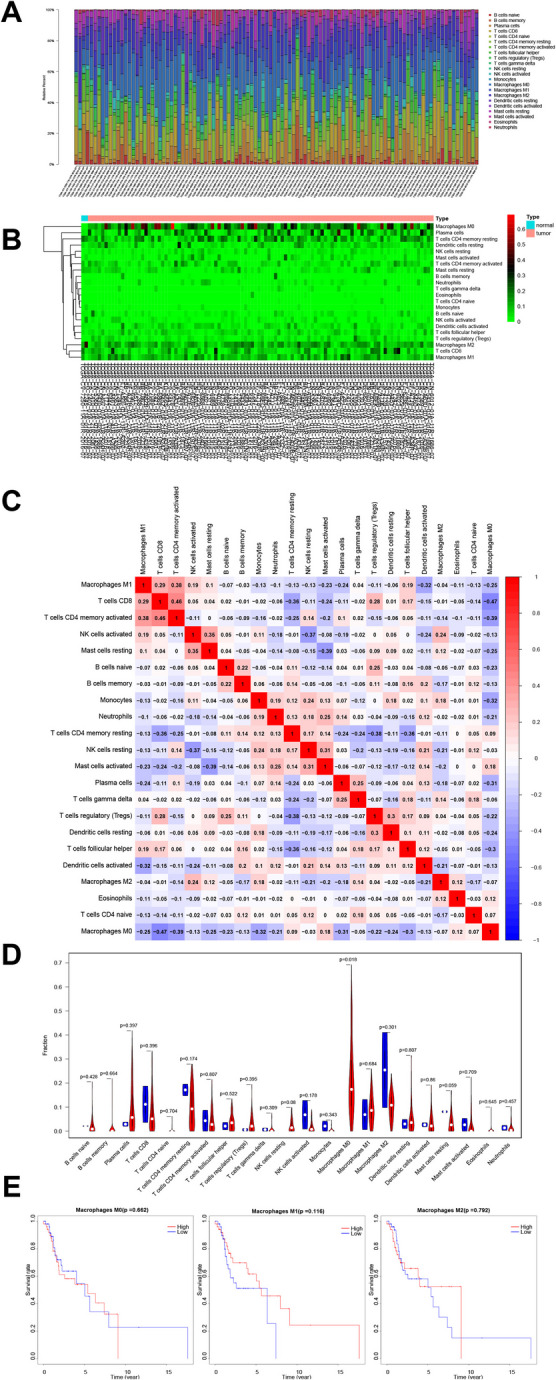
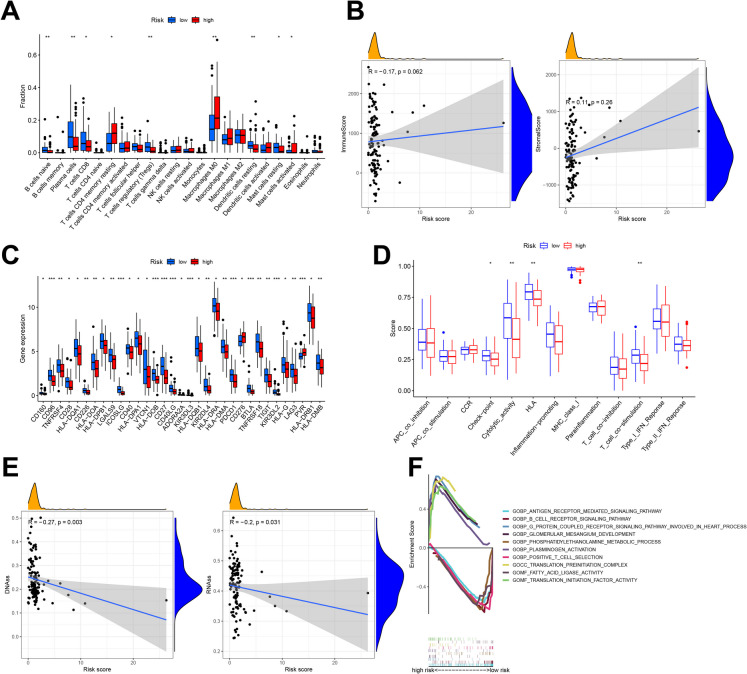
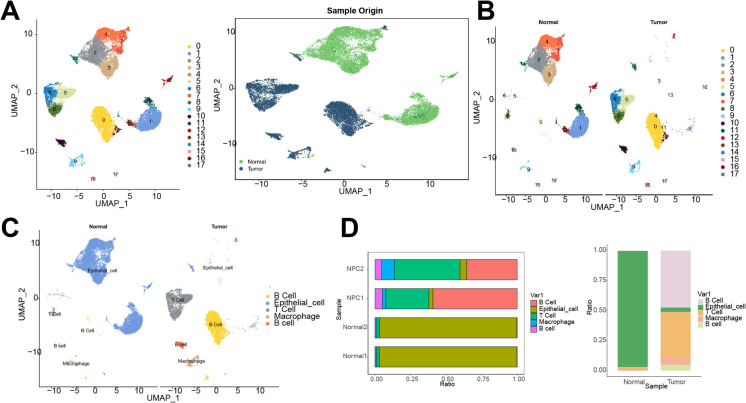
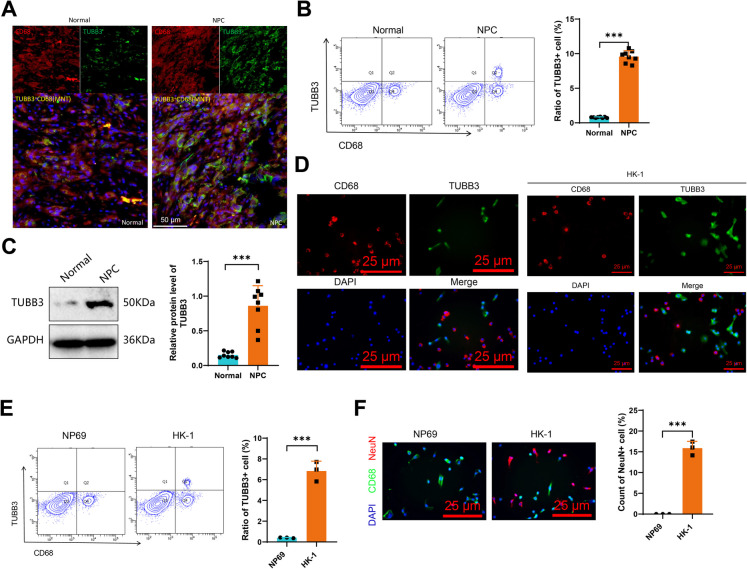
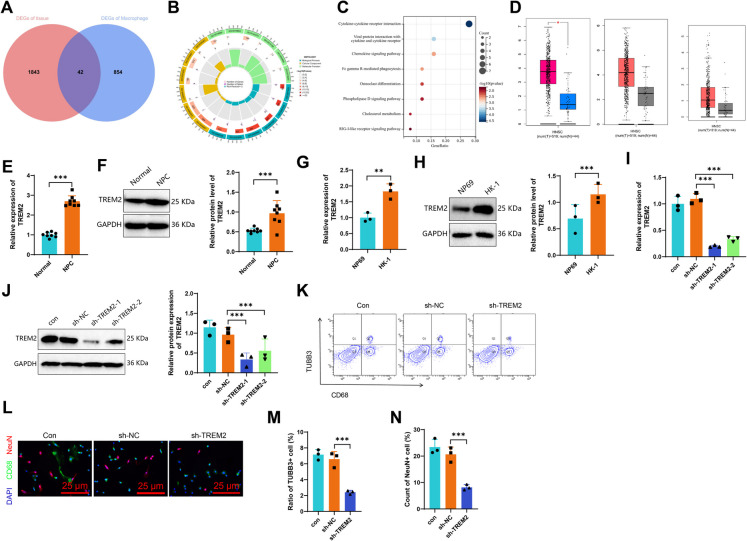
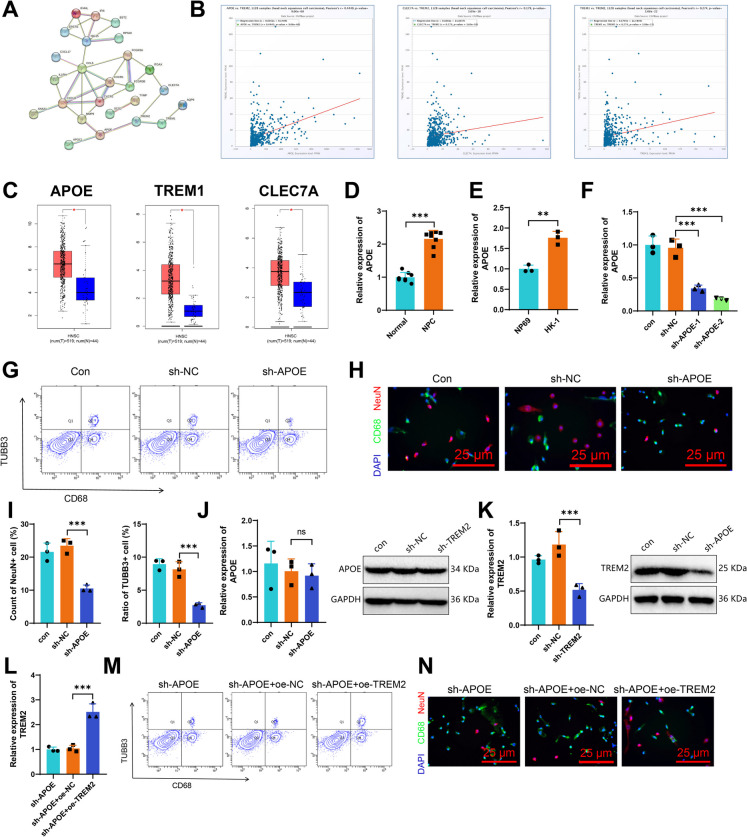
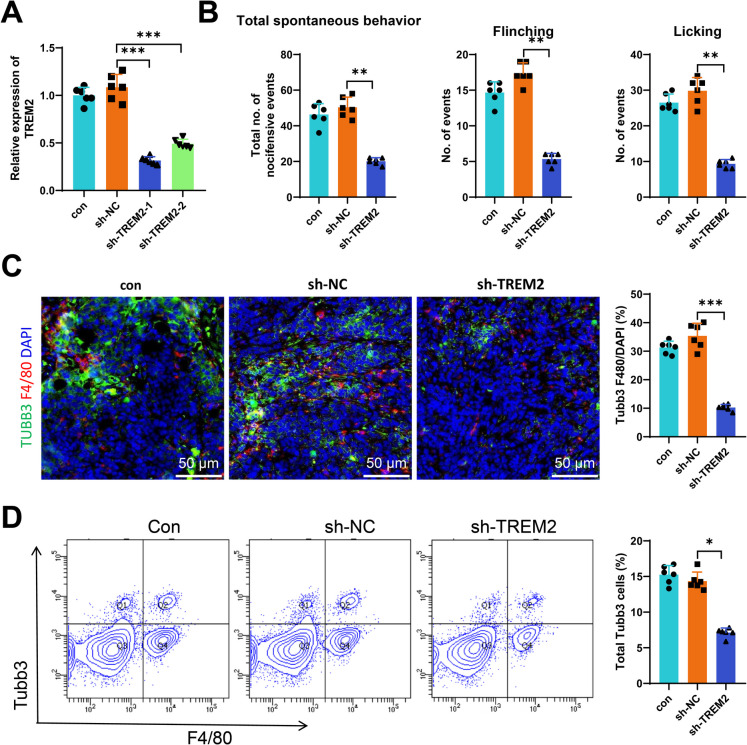
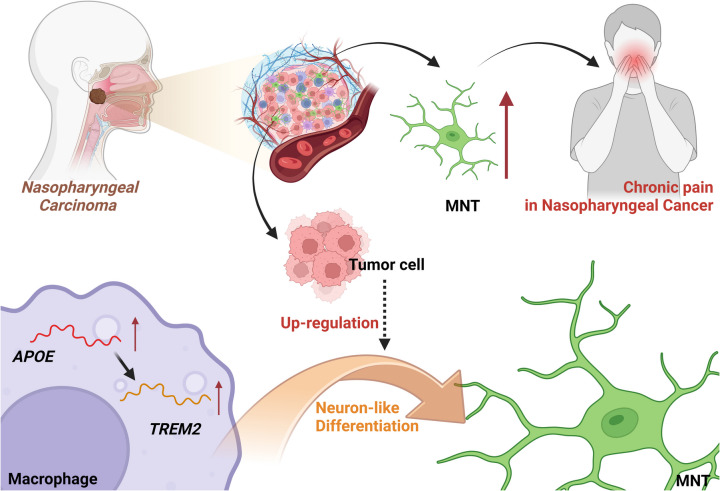
Chronic pain is a prevalent and debilitating symptom in patients with nasopharyngeal carcinoma (NPC). Fresh insights indicate that tumor-associated macrophages (TAMs) within the tumor microenvironment (TME) may undergo neuron-like differentiation, potentially contributing to pain mechanisms. By examining the apolipoprotein E (APOE) together with the triggering receptor expressed on myeloid cells 2 (TREM2), this study aims to clarify their joint function in modulating differentiation and how this interplay might be implicated in chronic pain associated with NPC. Through comprehensive analysis using TCGA-NPC transcriptomic datasets and single-cell RNA sequencing (scRNA-seq), we assessed the molecular landscapes of both NPC-affected and healthy nasopharyngeal tissues. Differential gene expression and immune cell profiling identified macrophages as key players in the inflammatory response. Single-cell sequencing revealed a distinct subpopulation of neuron-like macrophages expressing neurogenesis-related genes. Macrophage-to-neuron-like cell transformation in response to NPC cells was examined through in vitro co-culture systems, highlighting the involvement of the APOE-TREM2 regulatory pathway. In vivo studies involved macrophage depletion and TREM2 knockdown in mouse models to evaluate the impact on chronic pain development. Infiltrating macrophages were significantly more abundant in NPC samples, with many exhibiting neuron-like features that were positively linked to high levels of WNT5 A expression. In vitro, NPC cells induced macrophage differentiation into neuron-like cells, a process regulated by TREM2 and APOE. TREM2 knockdown in macrophages resulted in a reduction of chronic pain behaviors in mouse models, highlighting the contribution of the APOE-TREM2 Axis to NPC-associated chronic pain. Our findings demonstrate that NPC cells promote macrophage reprogramming through the APOE-TREM2 Axis, leading to neuron-like differentiation and contributing to chronic pain in NPC patients. Targeting this pathway may offer novel therapeutic strategies for managing chronic pain in NPC.

Keywords: Chronic pain; Nasopharyngeal carcinoma; Neuron-like macrophages; Single-cell sequencing; TCGA; TREM2.


Conflict of interest statement

Declarations. Ethics approval and consent to participate: This study adheres to the Helsinki Declaration and has obtained informed consent from the patients, as well as approval from the ethics committee of Shengjing Hospital of China Medical University for conducting medical research. All animal experiments conducted in this research institute have received approval from the Animal Ethics Committee of Shengjing Hospital of China Medical University and adhere to local principles for the management and utilization of experimental animals. Consent for publication: Not applicable. Competing interests: The authors declare no competing interests.

Figures

Fig. 1
Fig. 1
Differential Analysis based on the TCGA Database and Construction of a Prognostic Risk Model based on Inflammation-related Marker Genes. Note: (A) Volcano plot showing differential genes between normal tissue (n = 12) and cancer tissue (n = 116) in NPC patients from TCGA database; (B) Volcano plot showing differential inflammation-related genes between normal tissue (n = 12) and cancer tissue (n = 116) in NPC patients from TCGA database; (C) Forest plot of univariate COX analysis on inflammation-related genes based on the TCGA database (5 prognosis-related genes are shown, represented by red for positive correlation and blue for negative correlation); (D) Venn diagram showing the overlap between inflammation-related differential genes and inflammation-related prognostic genes; (E) Expression levels of LCK, ITGA5, and TLR2 in normal tissue (n = 12) and cancer tissue (n = 116) of NPC patients from TCGA database, *p < 0.01, **p < 0.0001; (F) Correlation between LCK, ITGA5, TLR2, and prognosis in NPC patients; (G) Distribution plot of Lasso coefficients (each line represents a gene, and the vertical coordinate at the end of the line represents the gene's coefficient) and Lasso regression model plot (the vertical coordinate represents cross-validation error, and the number of genes corresponding to the point of minimum error is the optimal model); (H) Forest plot of COX risk scoring model (displaying model genes and their risk coefficients)
Fig. 2
Fig. 2
Performance Evaluation of the Prognostic Risk Score Model based on Inflammatory Marker Genes. Note: (A) Risk curve (left) and risk heatmap (right) between high and low-risk groups of NPC patients in TCGA training set (n = 58); (B) OS analysis between high and low-risk groups of NPC patients in TCGA training set (n = 58); (C) ROC curve analysis predicting 1–3 year prognosis of NPC patients based on risk values in TCGA training set (n = 58); (D) Univariate analysis (left) and multivariate analysis (right) of prognosis-related factors predicting NPC patient prognosis in TCGA training set (n = 58); (E) Correlation analysis of NPC patient risk values and clinical characteristics in TCGA training set (n = 58); (F) OS analysis between high and low-risk groups of NPC patients in TCGA test set (n = 58)
Fig. 3
Fig. 3
Analysis of Immune Cell Infiltration in NPC Tumor Tissue based on the TCGA Database. Note: (A) Stacked column chart showing the composition of immune cells in normal tissue (n = 12) and tumor tissue (n = 116) of NPC patients from TCGA database; (B) Heatmap showing the composition of immune cells in normal tissue (n = 12) and tumor tissue (n = 116) of NPC patients from TCGA database; (C) Heatmap showing the correlation of immune cells between normal tissue and tumor tissue of NPC patients from TCGA database; (D) Violin plot showing the differential content of immune cells between normal tissue (blue) and tumor tissue (red) of NPC patients from TCGA database; (E) Correlation analysis between different macrophage content and OS time of NPC patients in tumor tissue (n = 116)
Fig. 4
Fig. 4
TME in NPC Tumor Tissue based on Different Inflammation Risk Groups from the TCGA Database. Note: (A) Analysis of differential immune cell infiltration between high-risk (n = 58) and low-risk (n = 58) groups of NPC patients in the TCGA database; (B) Correlation analysis between risk values and the total amount of immune cells (left) and stromal cells (right) in NPC tumor tissue from the TCGA database; (C) Analysis of differential immune checkpoint expression between high-risk (n = 58) and low-risk (n = 58) groups of NPC patients in the TCGA database; (D) Analysis of differential immune function between high-risk (n = 58) and low-risk (n = 58) groups of NPC patients in the TCGA database; (E) Correlation analysis between risk values and tumor stem-like characteristics in NPC tumor tissue from the TCGA database; (F) GSEA analysis of functional enrichment of differential genes in NPC tumor tissue between high-risk (n = 58) and low-risk (n = 58) groups. * denotes comparison between groups, *p < 0.05, **p < 0.01, ***p < 0.001
Fig. 5
Fig. 5
UMAP Cell Clustering and Annotation of scRNA-seq Data. Note: (A) Visualization of UMAP clustering results, where each color represents a cluster, and the right plot shows the cell aggregation and distribution of samples from the Normal and Tumor groups; (B) Cell aggregation and distribution of samples from different sources; (C) Visualization of cell annotation results based on UMAP clustering, where each color represents a cell population; (D) Percentage of different cell populations in samples from the Normal and Tumor groups
Fig. 6
Fig. 6
Validation of the Experiment Inducing Macrophage Differentiation into MNT in NPC through Immunofluorescence Staining and Flow Cytometry. Note: (A-B) Immunofluorescence staining and flow cytometry experiments were conducted to detect the quantity of TUBB3 + macrophages in NPC tumor tissue (n = 6, Scale bars = 50 μm). Red represents CD68+ macrophages (1 µg/mL), green represents TUBB3+ cells (1:50), and yellow represents TUBB3+ CD68 macrophages; Forward scatter (FSC) and side scatter (SSC) gating strategy was used to classify cell populations into four quadrants (Q1-Q4) to distinguish cell size and granularity. CD68+ cells: Macrophages. TUBB3+ cells: Neuron-like differentiated macrophages; (C) Western blot experiment was conducted to detect the expression level of TUBB3 protein in NPC tumor tissue (n = 6); (D-E) Immunofluorescence staining and flow cytometry analysis to detect the number of TUBB3 + macrophages after co-culture with NP69 or HK-1 cells. Red represents CD68 + macrophages (1 µg/mL), green represents TUBB3+ cells (1:50), and blue represents DAPI (Scale bars = 25 μm); (E) Scatter plot showing the expression of neural differentiation-related genes in different cell populations. Darker red indicates higher average expression levels. Forward scatter (FSC) and side scatter (SSC) gating strategy was used to classify cell populations into four quadrants (Q1-Q4) to distinguish cell size and granularity. CD68.+ cells: Macrophages. TUBB3 + cells: Neuron-like differentiated macrophages; (F) Immunofluorescence staining to detect the number of NeuN + macrophages after co-culture with NP69 or HK-1 cells (Scale bars = 25 μm). Green represents CD68 + macrophages (1 µg/mL), red represents NeuN + neuron-like cells (1:50), and blue represents DAPI.. The cellular experiments were repeated 3 times, and * indicates a comparison between two groups, * indicates a comparison between two groups, *p < 0.05, **p < 0.01, ***p < 0.001
Fig. 7
Fig. 7
Investigation of Key Genes Regulating Macrophage Differentiation into MNT in NPC. Note: (A) Venn diagram showing the overlapping genes between DEGs in TCGA-NPC and scRNA-seq macrophages; (B-C) GO and KEGG enrichment analysis of the intersection genes; (D) GEPIA website validation of TREM2, FCGR3 A and FCGR3B expression level in HNSC, where pink represents tumor tissue and blue represents normal tissue; (E) RT-qPCR and Western blot experiments were conducted to detect the expression level of TREM2 mRNA and protein in NPC tumor tissue (n = 6); (F) Western blot analysis of TREM2 protein expression in tumor tissues of NPC patients (n = 8); (G) RT-qPCR and Western blot experiments were conducted to detect the expression level of TREM2 mRNA and protein in macrophages co-cultured with NP69 and HK-1 cells; (H) Western blot analysis of TREM2 protein expression in macrophages co-cultured with NP69 and HK-1 cells; (I) RT-qPCR experiment was conducted to detect the silencing efficiency of TREM2-specific shRNA; (J) Western blot analysis to detect the silencing efficiency of TREM2-specific shRNA; (K-L) Flow cytometry and immunofluorescence staining experiments were conducted to detect the quantity of TUBB3 + and NeuN + macrophages after silencing TREM2 and co-culturing with NP69 and HK-1 cells (Scale bars = 50 μm). Green represents CD68 + macrophages (1 µg/mL), red represents NeuN+ neuron-like cells (1:50), and blue represents DAPI. FSC/SSC gating strategy was used to classify cell populations into four quadrants (Q1-Q4) to distinguish cell size and granularity. CD68+ cells: Macrophages. TUBB3.+ cells: Neuron-like differentiated macrophages; (M–N) Statistical results of the quantity of TUBB3 + and NeuN + macrophages after silencing TREM2 and co-culturing with NHNECs and HK-1 cells using flow cytometry and immunofluorescence staining. The cellular experiments were repeated 3 times, and * indicates a comparison between two groups, *p < 0.05, **p < 0.01, ***p < 0.001
Fig. 8
Fig. 8
Investigation of the Mechanism of Macrophage Differentiation into MNT in NPC. Note: (A) PPI network of the overlapping 42 genes by String, with a minimum confidence value of 0.7; (B) Co-expression relationship of TREM2 with APOE, TREM1, and CLEC7 A in HNSC tumor tissue determined by ChIPBase website; (C) Expression levels of APOE, TREM1, and CLEC7 A in HNSC tumor tissue determined by GEPIA website, where red represents tumor tissue and blue represents normal tissue; (D) RT-qPCR experiments were conducted to detect the expression level of APOE mRNA in NPC tumor tissue (n = 8); (E) RT-qPCR experiments were conducted to detect the expression level of APOE mRNA in macrophages co-cultured with NP69 and HK-1 cells; (F) RT-qPCR experiments were conducted to detect the silencing efficiency of APOE-specific shRNA; (G-H) Flow cytometry and immunofluorescence staining experiments were conducted to detect the quantity of TUBB3 + and NeuN + macrophages after silencing APOE and co-culturing with HK-1 cells (Scale bars = 50 μm). Green represents CD68+ macrophages (1 µg/mL), red represents NeuN+ neuron-like cells (1:50), and blue represents DAPI. FSC/SSC gating strategy was used to classify cell populations into four quadrants (Q1-Q4) to distinguish cell size and granularity. CD68+ cells: Macrophages. TUBB3+ cells: Neuron-like differentiated macrophages; (I) Statistical results of the quantity of TUBB3 + and NeuN + macrophages after silencing APOE and co-culturing with HK-1 cells using flow cytometry and immunofluorescence staining; (J) RT-qPCR and Western blot experiments were conducted to detect the expression level of APOE in macrophages after silencing TREM2 and co-culturing with HK-1 cells; (K) RT-qPCR and Western blot experiments were conducted to detect the expression level of TREM2 in macrophages after silencing APOE and co-culturing with HK-1 cells; (L) RT-qPCR experiments were conducted to detect the expression level of TREM2 in macrophages after silencing APOE and overexpressing TREM2 and co-culturing with HK-1 cells; (M–N) Flow cytometry and immunofluorescence staining experiments were conducted to detect the quantity of TUBB3 + and NeuN + macrophages after silencing APOE and overexpressing TREM2 in macrophages co-cultured with HK-1 cells(Scale bars = 50 μm). Green represents CD68 + macrophages (1 µg/mL), red represents NeuN+ neuron-like cells (1:50), and blue represents DAPI. FSC/SSC gating strategy was used to classify cell populations into four quadrants (Q1-Q4) to distinguish cell size and granularity. CD68+ cells: Macrophages. TUBB3.+ cells: Neuron-like differentiated macrophages. The cellular experiments were repeated 3 times, and * indicates a comparison between two groups, *p < 0.05, **p < 0.01, ***p < 0.001
Fig. 9
Fig. 9
In vivo Experiment Investigating the Impact of Silencing TREM2 on Macrophage Differentiation into MNT in NPC. Note: (A) RT-qPCR experiment was conducted to detect the silencing efficiency of TREM2-specific shRNA; (B) Results of pain behavior observation in nude mice on the 20 th day after the start of the Experiment (n = 6); (C) Immunofluorescence staining experiment was conducted to detect the quantity of TUBB3 + macrophages in different groups of tumor tissue in nude mice (n = 6, Scale bars = 50 μm), Green represents TUBB3+ cells (1:50), Red represents F4/80+ macrophages (5 µg/mL), Blue represents DAPI; (D) Quantity of TUBB3+ macrophages in different groups of tumor tissue in nude mice (n = 6). FSC/SSC gating strategy was used to classify cell populations into four quadrants (Q1-Q4) to distinguish cell size and granularity. TUBB3+ cells: Neuron-like differentiated macrophages. F4/80.+ cells: Macrophages. The cellular experiments were repeated 3 times, and * indicates a comparison between two groups, *p < 0.05, **p < 0.01, ***p < 0.001
Fig. 10
Fig. 10
Molecular mechanisms underlying chronic pain in NPC mediated by tumor cell-induced neuronal-like differentiation through upregulation of the macrophage APOE-TREM2 Axis

Similar articles

References

    1. Caushi JX, Zhang J, Ji Z, Vaghasia A, Zhang B, Hsiue EH-C, et al. Transcriptional programs of neoantigen-specific TIL in anti-PD-1-treated lung cancers. Nature. Springer Science and Business Media LLC; 2021 [cited 2025 Apr 18]. p. 126–32. Available from: 10.1038/s41586-021-03752-4 - PMC - PubMed
    1. Chang ET, Ye W, Zeng Y-X, Adami H-O. The Evolving Epidemiology of Nasopharyngeal Carcinoma. Cancer Epidemiol Biomarkers Prev. American Association for Cancer Research (AACR); 2021 [cited 2025 Apr 18]. p. 1035–47. Available from: 10.1158/1055-9965.epi-20-1702 - PubMed
    1. Chen S, Peng J, Sherchan P, Ma Y, Xiang S, Yan F, et al. TREM2 activation attenuates neuroinflammation and neuronal apoptosis via PI3K/Akt pathway after intracerebral hemorrhage in mice. J Neuroinflammation. Springer Science and Business Media LLC; 2020 [cited 2025 Apr 18]. Available from: 10.1186/s12974-020-01853-x - PMC - PubMed
    1. Chen M, Yan X, Hong B, Xiao Y, Qian Y. The Expression and Prognostic Significance of ICOS in NSCLC Integrated Pan-Cancer and Multi-Omics Analyses. Int J Med Sci. Ivyspring International Publisher; 2024 [cited 2025 Apr 18]. p. 795–808. Available from: 10.7150/ijms.93262 - PMC - PubMed
    1. Cohen SP, Vase L, Hooten WM. Chronic pain: an update on burden, best practices, and new advances. Lancet. Elsevier BV; 2021 [cited 2025 Apr 18]. p. 2082–97. Available from: 10.1016/s0140-6736(21)00393-7 - PubMed

MeSH terms

LinkOut - more resources