. 2025 Jul;35(7):2549-2566.
doi: 10.1007/s11695-025-07798-5. Epub 2025 May 20.

A New Nomogram for Predicting Early Weight Loss Outcomes in Patients with Obesity Following Laparoscopic Sleeve Gastrectomy

Affiliations

A New Nomogram for Predicting Early Weight Loss Outcomes in Patients with Obesity Following Laparoscopic Sleeve Gastrectomy

Wenzhi Wu et al. Obes Surg. 2025 Jul.

Abstract

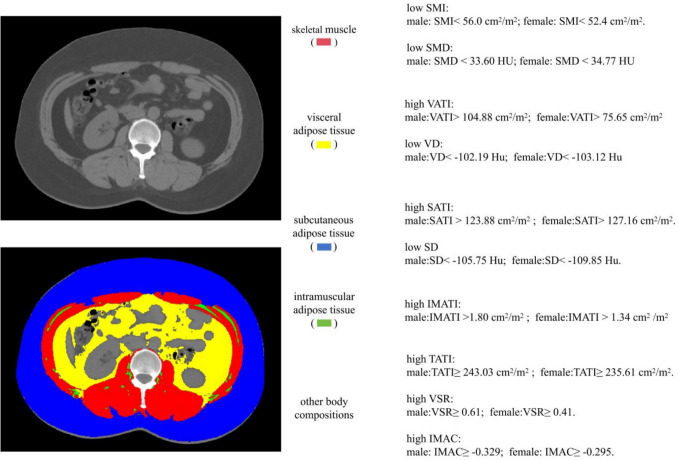
Purpose: Laparoscopic sleeve gastrectomy (LSG) is an effective treatment for obesity, but early weight loss outcomes vary owing to individual nutritional and metabolic differences. We developed a nomogram model to predict early weight loss after LSG, incorporating computed tomography (CT)-based body composition metrics and preoperative inflammatory-nutritional markers.

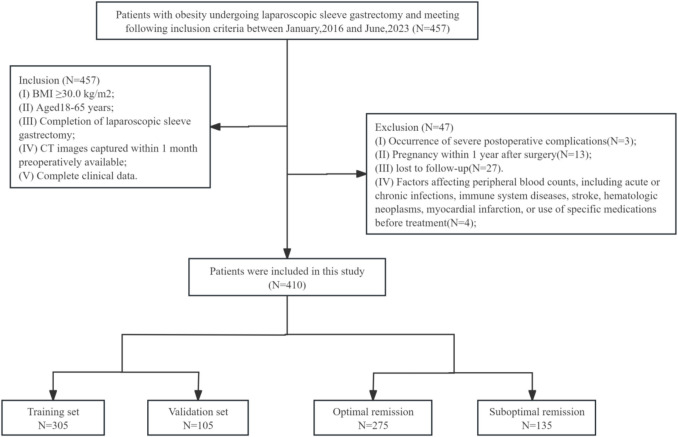
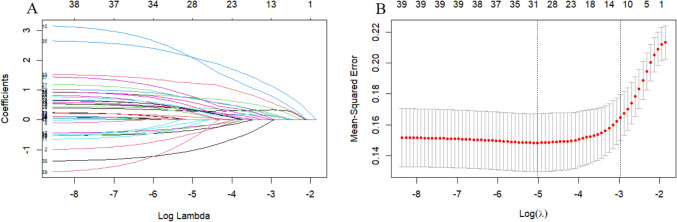
Methods: We retrospectively analyzed 305 patients with obesity who underwent LSG at the Affiliated Hospital of Qingdao University between January 2016 and June 2023. An external validation cohort of 105 patients from a separate institution was also included. Patients were categorized into optimal remission (%total weight loss [%TWL] ≥ 25%) and suboptimal remission (%TWL < 25%) weight loss groups one year postoperatively. Predictive variables were identified using Least Absolute Shrinkage and Selection Operator (LASSO) regression and multivariate logistic regression. A nomogram was constructed based on the significant predictors. Model performance was assessed using the area under the receiver operating characteristic curve (AUC), calibration curves, decision curve analysis (DCA), and clinical impact curve (CIC).

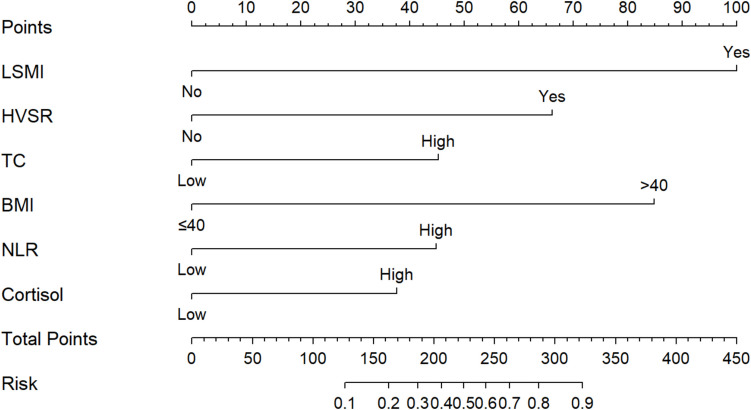
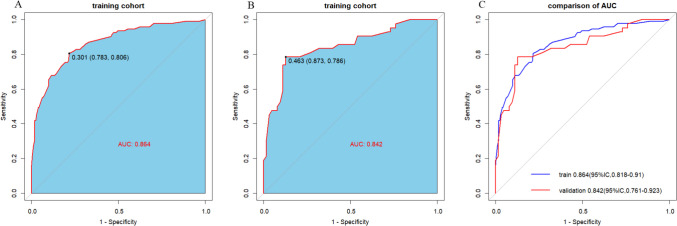
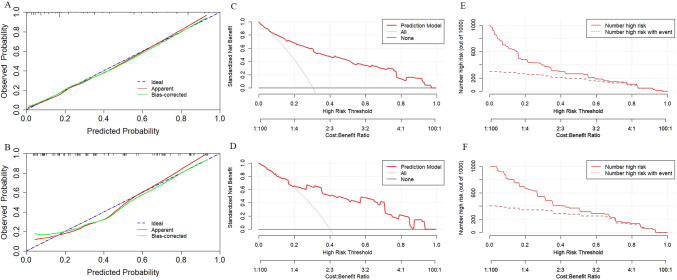
Results: Independent predictors of suboptimal remission included BMI > 40 kg/m2, elevated total cholesterol, high neutrophil-to-lymphocyte ratio, high cortisol, low skeletal muscle index, and elevated visceral-to-subcutaneous adipose tissue area ratio. The constructed nomogram demonstrated strong predictive performance, with AUCs of 0.864 and 0.842 in the training and external validation cohorts, respectively. Calibration curves indicated excellent agreement between predicted and observed outcomes. DCA and CIC confirmed the model's clinical utility in both cohorts.

Conclusion: The developed nomogram effectively predicts early weight loss outcomes after LSG, supporting targeted perioperative management and personalized nutritional interventions.

Keywords: Body composition; Laparoscopic sleeve gastrectomy; Nomogram; Obesity; Predictors.


Conflict of interest statement

Declarations. Ethical Approval: The 1964 Helsinki Declaration and any updates or similar ethical standards, as well as institutional and/or national research committee ethical standards, were followed in all procedures employed in the research involving human beings. The study protocol was approved by Affiliated Hospital of Qingdao University’s ethics committee (approval number, QYFYWZLL28855). Patient Consent Statement: This study was a retrospective study and informed consent was not required. Conflict of Interest: The authors declare no competing interests.

Figures

Fig. 1
Fig. 1
Patients inclusion and exclusion flow chart. BMI, body mass index; CT, computed tomography
Fig. 2
Fig. 2
Cross-sectional computed tomography images of the third lumbar vertebra used to quantify body composition variables and the cutoff values of Sarcopenia, SATI, VATI, and other body compositions. The red-, yellow-, blue-, and green-shaded regions show the skeletal muscle, visceral adipose tissue, subcutaneous adipose tissue, and intramuscular adipose tissue, respectively. BMI, body mass index; CT, computed tomography; HU, Hounsfield unit; IMAC, intramuscular adipose tissue content; IMATI, intramuscular adipose tissue index; SATI, subcutaneous adipose tissue index; SD, subcutaneous adipose tissue density; SMD, skeletal muscle density; SMI, skeletal muscle index; TATI, total adipose tissue index; VATI, visceral adipose tissue index; VD, visceral adipose density; VSR, visceral to subcutaneous adipose tissue area ratio
Fig. 3
Fig. 3
LASSO regression screened 7 potentials out of 39 candidate variables. Note: A Displays the distribution of LASSO regression coefficients for 39 characteristics, producing a logarithm (lambda) sequence coefficient profile graph. The upper horizontal axis represents the number of variables with non-zero coefficients in the model, while the lower horizontal axis represents log(λ). B Two vertical dashed lines from left to right represent lambda.min and lambda.1se, respectively. Lambda.min corresponds to the λ value that results in the smallest estimated model error, while lambda.1se corresponds to the λ value where the internal cross-validation error is at its maximum within one standard deviation. By determining the optimal λ, seven non-zero coefficients are derived
Fig. 4
Fig. 4
Nomogram for estimating the risk of the suboptimal remission of weight. The corresponding score for each indicator can be found by moving vertically down, and the total score for each patient can be obtained on the total points scale. BMI, body mass index; HVSR, high visceral to subcutaneous adipose tissue area ratio; LSMI, low skeletal muscle index; NLR, neutrophil–lymphocyte ratio; TC, total cholesterol
Fig. 5
Fig. 5
The receiver operator characteristic (ROC) curve of the suboptimal remission of weight prediction model. A Training set. B Validation set. C The AUC of the training set (blue lines) compared with the validation set (red lines)
Fig. 6
Fig. 6
Calibration curves, DCA curves and CIC for the training and external validation cohort. A Calibration curves for the training cohort. B Calibration for the external validation cohort. The blue diagonal dashed line is the ideal calibration line, and the red solid line is the actual line predicted by the nomogram. The closer the actual line is to the ideal line, the higher the calibration of the nomogram. C DCA curves for the training. D DCA for the external validation cohort. The Y-axis shows the net benefit. The X-axis shows the corresponding risk threshold. The gray line represents the assumption that all patients have early weight loss failure. The heavy black line represents the assumption that no patients have early weight loss failure. The red line represents the nomogram. E CIC in the training cohort. F CIC in the external validation cohort. Clinical impact curve for the risk model of 1000 patients, the red solid line shows the total number who would be deemed at high risk for each risk threshold. The red dashed line shows how many of these would be true positives cases. CIC, clinical impact curve; DCA, decision curve analysis

Similar articles

References

    1. Trends in adult body-mass index in 200 countries from 1975 to 2014: a pooled analysis of 1698 population-based measurement studies with 19·2 million participants. Lancet (London, England) 2016;387:1377-1396 - PMC - PubMed
    1. Piché M-E, Tchernof A, Després J-P. Obesity phenotypes, diabetes, and cardiovascular diseases. Circ Res. 2020;126:1477–500. - PubMed
    1. Colquitt JL, Pickett K, Loveman E, et al. Surgery for weight loss in adults. Cochrane Database Syst Rev. 2014;2014:CD003641. - PMC - PubMed
    1. Feng W, Zhu Z, Li X, et al. Weight loss and metabolic benefits of bariatric surgery in China: a multicenter study. J Diabetes. 2023;15:787–98. - PMC - PubMed
    1. Aminian A. Sleeve gastrectomy: metabolic surgical procedure of choice? Trends Endocrinol Metab. 2018;29:531–4. - PubMed