. 2025 May 20;10(12):e172370.
doi: 10.1172/jci.insight.172370. eCollection 2025 Jun 23.

Loss of genome maintenance is linked to mTOR complex 1 signaling and accelerates podocyte damage

Affiliations

Loss of genome maintenance is linked to mTOR complex 1 signaling and accelerates podocyte damage

Fabian Braun et al. JCI Insight. .

Abstract

DNA repair is essential for preserving genome integrity. Podocytes, postmitotic epithelial cells of the kidney filtration unit, bear limited regenerative capacity, yet their survival is indispensable for kidney health. Podocyte loss is a hallmark of the aging process and of many diseases, but the underlying factors remain unclear. We investigated the consequences of DNA damage in a podocyte-specific knockout mouse model for DNA excision repair protein Ercc1 and in cultured podocytes under genomic stress. Furthermore, we characterized DNA damage-related alterations in mouse and human renal tissue of different ages and patients with minimal change disease and focal segmental glomerulosclerosis. Ercc1 knockout resulted in accumulation of DNA damage and ensuing albuminuria and kidney disease. Podocytes reacted to genomic stress by activating mTOR complex 1 (mTORC1) signaling in vitro and in vivo. This was abrogated by inhibiting DNA damage signaling through DNA-dependent protein kinase (DNA-PK) and ataxia teleangiectasia mutated (ATM) kinases, and inhibition of mTORC1 modulated the development of glomerulosclerosis. Perturbed DNA repair gene expression and genomic stress in podocytes were also detected in focal segmental glomerulosclerosis. Beyond that, DNA damage signaling occurred in podocytes of healthy aging mice and humans. We provide evidence that genome maintenance in podocytes is linked to the mTORC1 pathway and is involved in the aging process as well as the development of glomerulosclerosis.

Keywords: Aging; Cell biology; Chronic kidney disease; DNA repair; Nephrology.


Conflict of interest statement

Conflict of interest: The authors have declared that no conflict of interest exists.

Figures

Figure 1
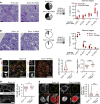
Figure 1. Podocyte-specific Ercc1 deletion causes glomerulosclerosis.
(A) Gene set enrichment analysis (GSEA) of gene classes according to transcript length. Shown are the shortest 5% (top left), shortest 1% (top right), longest 5% (bottom left), and longest 1% (bottom right) of genes. Bottom color-coded panel shows log2 fold-changes of microarray data in ranked order. Top panels show running enrichment score as orange line. Smallest 1% (normalized enrichment score [NES] of 2.01) and 5% (NES of 1.37) of genes are significantly enriched in upregulated genes, while longest 1% (NES of –1.69) and 5% (NES of –1.42) of genes are significantly enriched in downregulated genes in the comparison of Ercc1–/Δ 14 weeks versus WT 14 weeks (n = 4). (B) Representative electron microscopy image of 14-week-old WT and Ercc1–/Δ glomerular filtration barrier, scale bar indicating 2 μm. B, blood side; U, urinary side; asterisk, foot process (n = 4). (C) Quantitative PCR (qPCR) analysis for Ercc1 in FACS-sorted podocytes of Ercc1 ctrl, WT/pko (het), or pko mice (1-way ANOVA with Tukey’s multiple comparisons test, n = 3–6). (D) Survival of Ercc1 ctrl, WT/pko (het), and pko mice (Mantel-Cox test, n = 4–14). (E) Urinary albumin/creatinine analysis of Ercc1 ctrl and pko mice (2-way ANOVA with Šídák’s multiple comparisons test, n = 4–9). (F) Representative periodic acid–Schiff (PAS) staining of 13-week-old Ercc1 ctrl and pko mice, scale bars: 100 μm in overview, 30 μm in zoom (n = 6). (G) Kaplan-Meier curve depicting survival of Ercc1 ctrl and ipko mice (Mantel-Cox test, n = 5–6). (H) Representative Coomassie staining of Ercc1 ctrl and ipko urine 18 weeks after tamoxifen induction; bovine serum albumin was loaded as reference (n = 6). Values are in kilodaltons. (I) Representative PAS staining of Ercc1 ctrl and ipko mice 25 weeks after induction with tamoxifen (n = 6). Scale bar as in F. Scatterplots indicate mean plus 95% confidence interval. *P ≤ 0.05, **P ≤ 0.01, ***P ≤ 0.001, ****P ≤ 0.0001.
Figure 2
Figure 2. The podocyte-specific constitutive knockout of Ercc1 leads to foot process effacement and podocyte loss accompanied by accumulation of DNA damage.
(A) Representative electron microscopy image of 7- and 9-week-old Ercc1 ctrl and pko glomerular filtration barrier, scale bar: 2 μm. B, blood side; U, urinary side; asterisk: foot process (n = 3). (B) Representative immunofluorescence staining of synaptopodin (SNP, gray), dachshund family transcription factor 1 (Dach1, green) (75), and nuclei (Draq5, red) in sections of 9-week-old Ercc1 ctrl and pko kidneys, with quantification of podocyte number and density, scale bar indicating 10 μm (unpaired t test, n = 5). (C) Corresponding staining of SNP (gray), Dach1 (green) (75), and nuclei (red) in sections of 11-week-old Ercc1 ctrl and pko kidneys, scale bar indicating 10 μm (n = 5). (D) Representative immunofluorescence staining of SNP (gray), DNA damage marker gH2A.X (green), and Draq5 (red) in sections of 9-week-old Ercc1 ctrl and pko kidneys, with quantification of gH2A.X foci per podocyte nucleus and nuclear area, scale bar indicating 2 μm, yellow dotted line indicating nuclear border (unpaired t test, n = 5, 10 glomeruli per sample, 5 podocytes per glomerulus). (E) Representative immunofluorescence staining of SNP (gray), gH2A.X (green), and Draq5 (red) in sections of 11-week-old Ercc1 ctrl and pko kidneys, with quantification of gH2A.X foci per podocyte nucleus and nuclear area, scale bar indicating 2 μm (unpaired t test, n = 5, 10 glomeruli per sample, 5 podocytes per glomerulus). (F) Representative immunofluorescence staining of nephrin (yellow) with DAPI (gray) of Ercc1 ctrl at 13 weeks of age and pko kidneys at 7, 9, 11, and 13 weeks of age, scale bar indicating 10 μm (n = 5). All violin plots indicate median (black) and upper and lower quartile (gray). *P ≤ 0.05, **P ≤ 0.01, ****P ≤ 0.0001.
Figure 3
Figure 3. DNA damage accumulation in podocytes leads to a shift toward smaller transcripts and activates the mTORC1 pathway.
(A) Volcano plot depicting differentially expressed genes of Ercc1 pko versus control glomeruli. Significantly differentially expressed genes depicted in black, pseudogenes depicted in red. FDR, false discovery rate. (B) Gene length analysis of genes differentially expressed in Ercc1 pko versus control glomeruli. Downregulated genes (blue) are significantly larger than upregulated genes (red). P value: 1.52 × 10⁻⁷ (Mann-Whitney U test). (C) Correlation analysis plotting the NES of Kyoto Encyclopedia of Genes and Genomes pathway genes in Tsc2ko versus ctrl kidneys and Ercc1 pko versus ctrl glomeruli. (D) GSEA of differentially expressed genes (upregulation, fold-change ≥ 2) in Ercc1-pko glomeruli classified by the gene rank in the mTORC1 hyperactivation (Tsc2ko) data set. The running enrichment score is shown as a green line. The upregulated genes in Ercc1-pko glomeruli are significantly (adjusted P value: 1.67 × 10⁻⁵) more enriched (NES: 1.74) in the genes upregulated upon mTORC1 hyperactivation. (E) Representative immunofluorescence staining of SNP, p-S6RP, and DAPI in sections of 9-week-old Ercc1 ctrl and pko kidneys with quantification of SNP and p-S6RP double-positive cells per glomerulus and per total SNP-positive cells, scale bar indicating 20 μm & 10 μm in zoom (unpaired t test, n = 5, 10 glomeruli per sample). ****P ≤ 0.0001.
Figure 4
Figure 4. mTORC1 activation in podocytes upon genomic stress is mediated through DNA damage signaling kinases DNA-PK and ATM.
(A) Schematic in vitro protocol for the induction of DNA damage. (B) Representative immunoblot images of gH2A.X and loading control β-tubulin of immortalized murine podocyte lysates (n = 3). (C) Representative immunofluorescence images for p53 and DAPI in immortalized murine podocytes, scale bar indicating 20 μm (n = 3). (D) Representative immunoblot images of p-S6RP, S6RP, and loading control protein α-actin of immortalized murine podocyte lysates; p-S6RP and S6RP gels run in parallel (n = 3). All cells imaged or lysed after treatment with MMC or UV-C irradiation ± 10 ng/mL rapamycin or serum starvation (SS) (n ≥ 4). (E) Representative immunoblot images of p-S6RP, S6RP, and loading control protein α-actin of immortalized murine podocyte lysates (n = 3 MMC; n = 6 UV-C). All cells imaged or lysed after treatment with MMC or UV-C irradiation ± ATM inhibitor KU60019 or DNA-PK inhibitor nedisertib. (F) Representative immunofluorescence staining of synaptopodin (gray), p–DNA PKc (green), and DAPI (red) in sections of 9-week-old Ercc1 ctrl and pko kidneys, with quantification of SNP-positive cells with p–DNA PKc–positive nuclei per total SNP-positive cells. Yellow circles indicating positive nuclei, red circles indicating negative nuclei, scale bar indicating 50 μm (unpaired t test, n = 4–5, 10 glomeruli per sample). (G) Representative immunofluorescence staining of SNP (gray), p-ATM (green), and DAPI (red) in sections of 9-week-old Ercc1 ctrl and pko kidneys, with quantification of SNP-positive cells with p–ATM-positive nuclei per total SNP-positive cells. Yellow circles indicating positive nuclei, red circles indicating negative nuclei, scale bar indicating 10 μm (unpaired t test, n = 4–5, 10 glomeruli per sample). All violin plots indicate median (black) and upper and lower quartile (gray). ***P ≤ 0.001, ****P ≤ 0.0001. DNA-PK, DNA-dependent protein kinase; ATM, ataxia telangiectasia mutated serine/threonine kinase.
Figure 5
Figure 5. mTORC1 inhibition upon genomic stress can modulate podocyte damage and decrease DNA double-strand breaks.
(A) Representative PAS staining of Ercc1-pko mice treated with vehicle (Ercc1 pko) or 2 mg rapamycin/kg body weight (Ercc1 pko Rapa) from 6 weeks of age and glomerulosclerosis assessment of all glomeruli depicted as parts of a whole and scatterplot, scale bar: 50 μm (2-way ANOVA with Šídák’s multiple comparisons test, n ≥ 9, 50 glomeruli per sample). (B) Representative PAS staining of end-of-life Ercc1–/Δ mice treated with 14 mg rapamycin/kg food from 8 weeks of age and glomerulosclerosis assessment of all glomeruli depicted as parts of a whole and scatterplot, scale bar: 50 μm (2-way ANOVA with Šídák’s multiple comparisons test, n = 8, 50 glomeruli per sample). (C) Representative immunofluorescence staining of SNP, p-S6RP, and DAPI in sections of end-of-life Ercc1–/Δ kidneys treated (according to B) with quantification of SNP and p-S6RP double-positive cells per glomerulus and SNP-positive area per glomerulus, scale bar: 20 μm, 5 μm in zoom (unpaired t test, n = 5, 10 glomeruli per sample). (D) STED images of cleared kidney tissue of Ercc1–/Δ kidneys treated (according to B) after immunolabeling with an anti-nephrin antibody with quantification of slit diaphragm length, scale bar: 2 μm (unpaired t test, 5 areas per animal, n = 4 animals). (E) Representative immunofluorescence staining of SNP (gray), gH2A.X (green), and Draq5 (red) in sections of end-of-life Ercc1–/Δ kidneys treated (according to B) with quantification of gH2A.X foci per nuclear area. Yellow dotted line, nuclear border (n = 5, 10 glomeruli per sample, 5 podocytes per glomerulus); scale bar: 2 μm. All violin plots indicate median (black) and upper and lower quartile (gray); scatterplots indicate mean plus 95% confidence interval. *P ≤ 0.05, **P ≤ 0.01, ***P ≤ 0.001, ****P ≤ 0.0001.
Figure 6
Figure 6. mTORC1 overactivation is associated with increased DNA damage accumulation in podocytes.
(A) Representative immunofluorescence staining of SNP (gray), DNA damage marker gH2A.X (green), and nuclear marker Draq5 (red) in sections of 4-week-old Tsc1 ctrl and pko kidneys, with quantification of gH2A.X foci per podocyte nucleus and nuclear area of Ercc1 ctrl and pko kidneys, yellow dotted line indicating nuclear border (n = 5, 10 glomeruli per sample, 5 podocytes per glomerulus), scale bar indicating 2 μm. (B) Schematic overview depicting the potential interplay between defective DNA damage repair and increased mTORC1 signaling. In Ercc1-pko mice, accumulation of DNA damage triggers DNA damage signaling through DNA PKc/ATM affecting mTORC1 signaling. In Tsc1-pko mice, hyperactive mTORC1 signaling associates with increased DNA damage foci. All violin plots indicate median (black) and upper and lower quartile (gray); scatterplots indicate mean plus 95% confidence interval. ***P ≤ 0.001, ****P ≤ 0.0001.
Figure 7
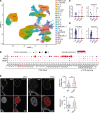
Figure 7. Podocytes accumulate DNA damage during human FSGS.
(A) Uniform manifold approximation and projection (UMAP) of a single-nucleus sequencing data set (47) depicting 24 cell types in analyzed control, MCD, and FSGS biopsies. FIB/Immune, fibroblasts/immune cells; C-TAL/MD, thick ascending limb of loop of Henle; PT-1–6, proximal tubular cells; DTL, descending thin limb; PC-CNT, connecting tubule; EC-PT, endothelial cell; FIB, fibroblast; DCT, distal convoluted tubule; IC-A, intercalated cell A; vSMC/MC-1, vascular smooth muscle cell/muscle cell 1; TAL, thick ascending limb of loop of Henle; T_Cell, T cells; MAC/MON, macrophage/monocyte; MD, medullary cell; vSMC/MC-2, vascular smooth muscle cell/muscle cell 2; PEC, parietal epithelial cell; GC-EC, glomerular endothelial cell; IC-B, intercalated cell B; POD, podocyte. (B) Bubble plot indicating the differences in DNA repair and mTORC1 target gene expression in podocytes between living donor (LD) kidney samples and MCD and FSGS biopsies obtained through single-nucleus sequencing (47). Bubble size indicates percentage of podocytes expressing the target gene, bubble color indicates expression level, and gray line indicates the split between DNA repair and mTORC1 target genes. (C) Selected scatterplots of ERCC1 and ERCC4 expression data of single podocytes obtained from LD, MCD, and FSGS biopsies. (D) Selected scatterplots of RNA polymerase 1–3 subunit POLR2K and RNA polymerase 2 subunit POLR2J of single podocytes obtained from LD, MCD, and FSGS biopsies. (E) Representative immunofluorescence staining of SNP, gH2A.X, and Draq5 in sections of human MCD and FSGS biopsies, yellow dotted line indicating nuclear border, scale bar indicating 2 μm with quantification of gH2A.X foci per podocyte nuclear area and per podocyte nucleus in human MCD and FSGS biopsies (unpaired t test, n = 4, 4 glomeruli per sample, 5 podocytes per glomerulus). All violin plots indicate median (black) and upper and lower quartile (gray). **P ≤ 0.01. ***P ≤ 0.001.

Similar articles

References

    1. Lindahl T, Nyberg B. Rate of depurination of native deoxyribonucleic acid. Biochemistry. 1972;11(19):3610–3618. doi: 10.1021/bi00769a018. - DOI - PubMed
    1. Loeb LA, Harris CC. Advances in chemical carcinogenesis: a historical review and prospective. Cancer Res. 2008;68(17):6863–6872. doi: 10.1158/0008-5472.CAN-08-2852. - DOI - PMC - PubMed
    1. Chatterjee N, Walker GC. Mechanisms of DNA damage, repair, and mutagenesis. Environ Mol Mutagen. 2017;58(5):235–263. doi: 10.1002/em.22087. - DOI - PMC - PubMed
    1. Ghosal G, Chen J. DNA damage tolerance: a double-edged sword guarding the genome. Transl Cancer Res. 2013;2(3):107–129. - PMC - PubMed
    1. Wolters S, Schumacher B. Genome maintenance and transcription integrity in aging and disease. Front Genet. 2013;4:19. doi: 10.3389/fgene.2013.00019. - DOI - PMC - PubMed

MeSH terms