

Deciphering oxidative stress responses in human gut microbes and fecal microbiota: a cultivation-based approach
- PMID: 40392681
- PMCID: PMC12105573
- DOI: 10.1093/femsec/fiaf054
Deciphering oxidative stress responses in human gut microbes and fecal microbiota: a cultivation-based approach
Abstract
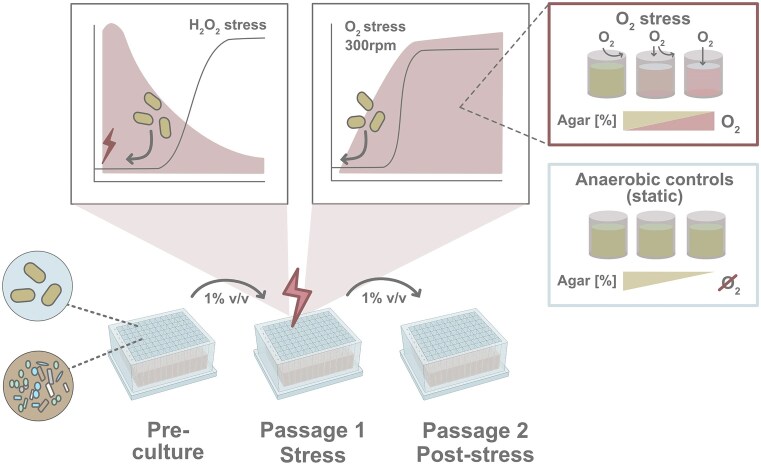
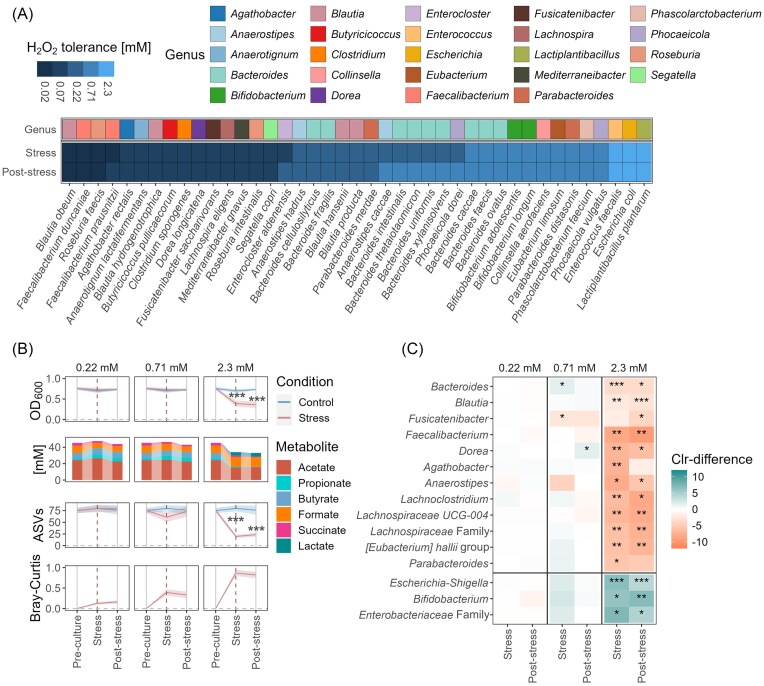
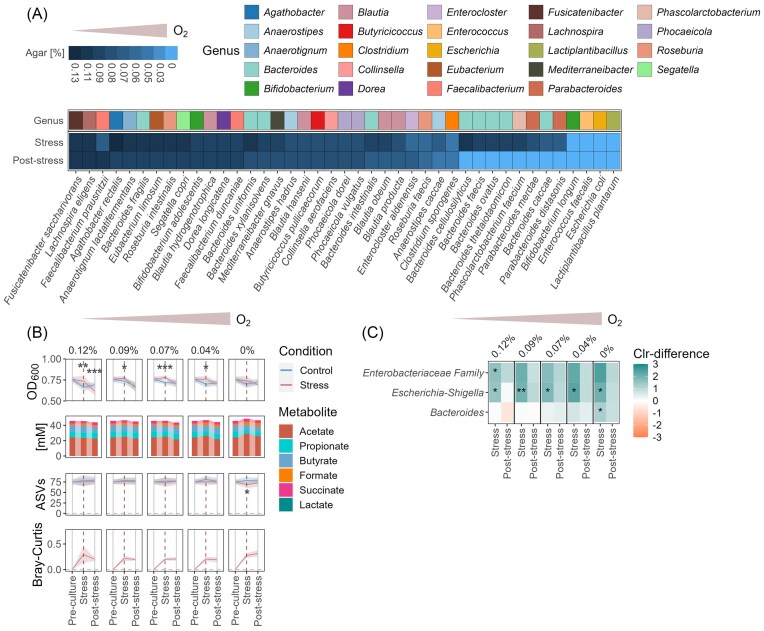
Chronic inflammation creates an oxidative environment, altering the gut microbiota. However, the mechanisms underlying oxidative stress-induced community changes remain poorly understood, owing to the complexity of the host environment, high inter-individual variability, and a lack of comparative data on stress tolerance across intestinal taxa. To address this, we developed an in vitro cultivation approach to assess the effects of oxidative stress, induced by 12 concentrations each of hydrogen peroxide (H₂O₂) and oxygen (O₂), on 41 intestinal strains and seven adults' fecal microbiota. Fusicatenibacter saccharivorans and Lachnospira eligens emerged as particularly sensitive taxa in both pure cultures and complex communities. Oxidative stress also reduced butyrate-producing taxa, like Agathobacter and Anaerostipes, along with total butyrate levels. In contrast, facultative anaerobes, like Escherichia-Shigella and Enterococcus, were largely unaffected, and Bacteroides showed high resilience. Notably, the impact of oxidative stress varied among individuals, with numerous genera showing taxon-specific changes depending on the host microbiota composition. These findings underscore the importance of considering individual microbiota backgrounds when assessing oxidative stress effects on microbial communities. Our study provides a tolerance profile of gut microbes to oxidative stress, reveals overlooked taxa involved in community restructuring, and introduces a screening tool to characterize individual microbial and metabolic responses.
Keywords: anaerobic cultivation; gut microbiota; hydrogen peroxide; intestinal microbes; oxygen; stress tolerance.
© The Author(s) 2025. Published by Oxford University Press on behalf of FEMS.
Conflict of interest statement
The authors declare that the research was conducted in the absence of any commercial or financial relationships that could be construed as a potential conflict of interest.
Figures
Similar articles
-
Introducing insoluble wheat bran as a gut microbiota niche in an in vitro dynamic gut model stimulates propionate and butyrate production and induces colon region specific shifts in the luminal and mucosal microbial community.Environ Microbiol. 2018 Sep;20(9):3406-3426. doi: 10.1111/1462-2920.14381. Epub 2018 Sep 9. Environ Microbiol. 2018. PMID: 30126070
-
Spatial heterogeneity of bacterial colonization across different gut segments following inter-species microbiota transplantation.Microbiome. 2020 Nov 18;8(1):161. doi: 10.1186/s40168-020-00917-7. Microbiome. 2020. PMID: 33208178 Free PMC article.
-
Interleukin-15 promotes intestinal dysbiosis with butyrate deficiency associated with increased susceptibility to colitis.ISME J. 2017 Jan;11(1):15-30. doi: 10.1038/ismej.2016.114. Epub 2016 Sep 20. ISME J. 2017. PMID: 27648810 Free PMC article.
-
The prebiotic potential of dietary onion extracts: shaping gut microbial structures and promoting beneficial metabolites.mSystems. 2025 Jan 21;10(1):e0118924. doi: 10.1128/msystems.01189-24. Epub 2024 Dec 23. mSystems. 2025. PMID: 39714164 Free PMC article.
-
Gut microbiota-motility interregulation: insights from in vivo, ex vivo and in silico studies.Gut Microbes. 2022 Jan-Dec;14(1):1997296. doi: 10.1080/19490976.2021.1997296. Gut Microbes. 2022. PMID: 34978524 Free PMC article. Review.
References
-
- Alam A, Leoni G, Quiros M et al. The microenvironment of injured murine gut elicits a local pro-restitutive microbiota. Nat Microbiol. 2016;1:15021. https://www.nature.com/articles/nmicrobiol201521 - PMC - PubMed
-
- Anthamatten L, Von Bieberstein PR, Thabuis C et al. Mapping gut bacteria into functional niches reveals the ecological structure of Human gut microbiomes. Biorxiv. 2023. 10.1101/2023.07.04.547750 - DOI
MeSH terms
Substances
Grants and funding
LinkOut - more resources
Full Text Sources
Medical
