. 2025 Jun;133(6):67019.
doi: 10.1289/EHP15305. Epub 2025 Jun 19.

Statistical Methods for Chemical Mixtures: A Roadmap for Practitioners Using Simulation Studies and a Sample Data Analysis in the PROTECT Cohort

Affiliations

Statistical Methods for Chemical Mixtures: A Roadmap for Practitioners Using Simulation Studies and a Sample Data Analysis in the PROTECT Cohort

Wei Hao et al. Environ Health Perspect. 2025 Jun.

Abstract

Background: Quantitative characterization of the health impacts associated with exposure to chemical mixtures has received considerable attention in current environmental and epidemiological studies. With many existing statistical methods and emerging approaches, it is important for practitioners to understand which method is best suited for their inferential goals.

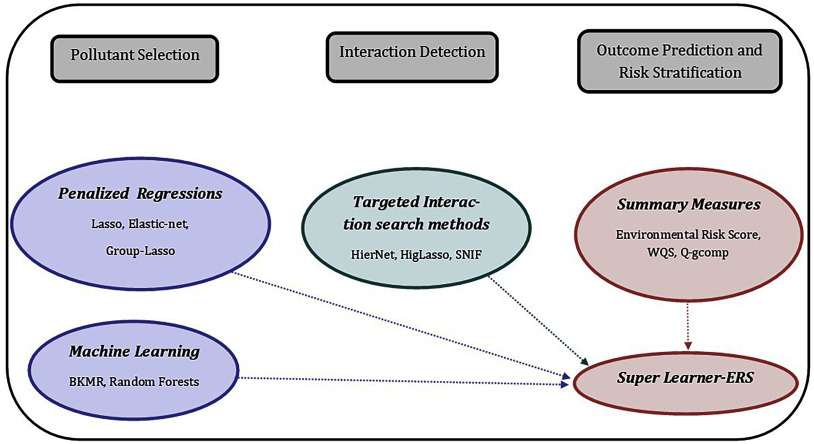
Objective: The goal of this paper is to provide empirical simulation-based evidence regarding performance of mixture methods to help guide researchers on selecting the best available methods to address three scientific questions in mixtures analysis: identifying important components of a mixture, identifying interactions among mixture components, and creating a summary score for risk stratification and prediction.

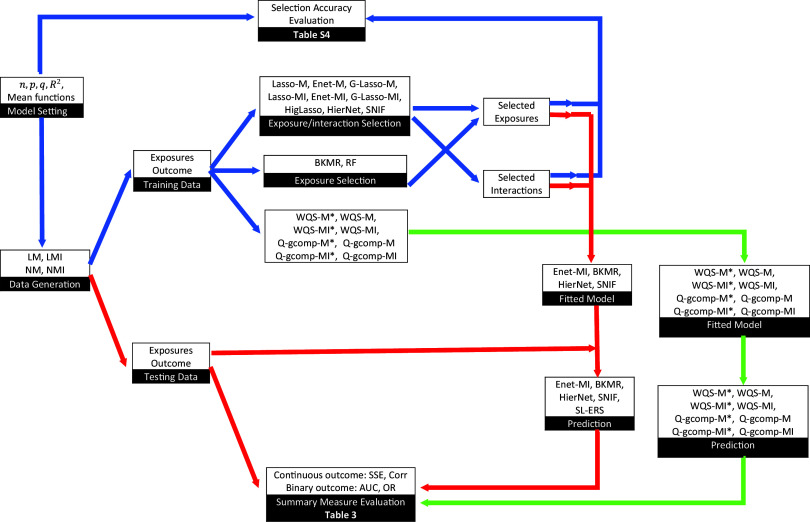
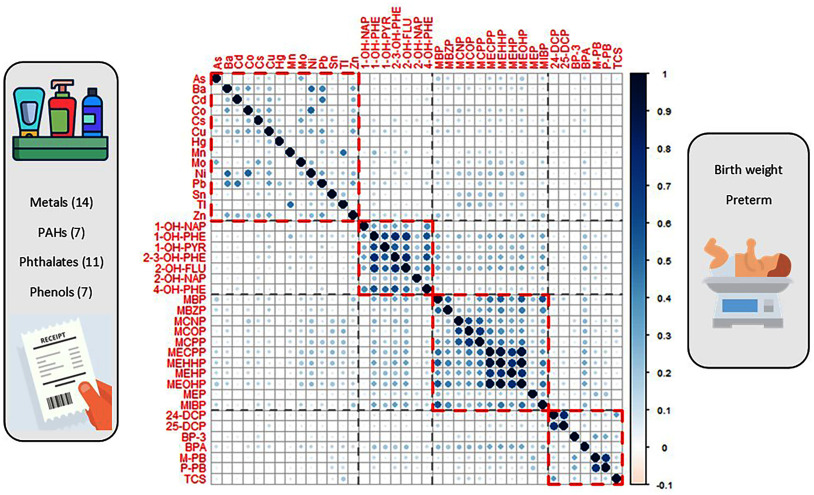
Methods: We conducted a review and comparison of 11 analytical methods available for use in mixtures research through extensive simulation studies for continuous and binary outcomes. In addition, we carried out an illustrative data analysis using the PROTECT birth cohort from Puerto Rico to examine the associations between exposure to chemical mixtures-metals, polycyclic aromatic hydrocarbons (PAHs), phthalates, and phenols-and birth outcomes.

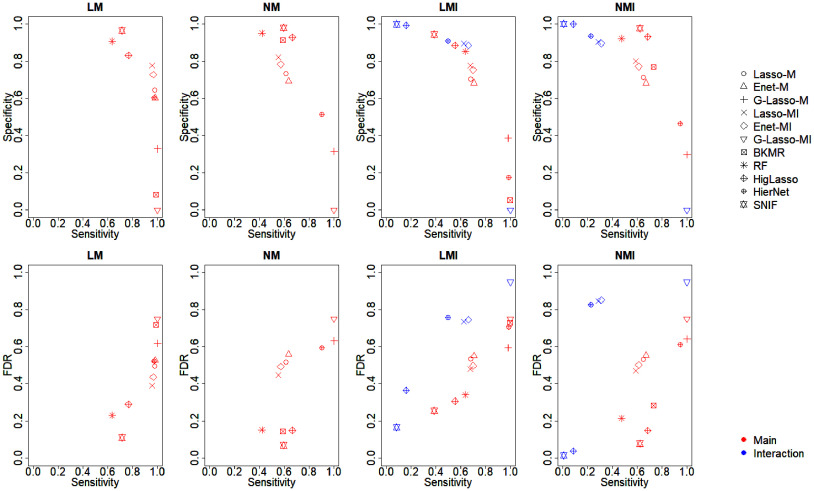
Results: Our simulation results suggest that the choice of methods depends on the goal of analysis and that there is no clear winner across the board. For selection of important toxicants in the mixtures and for identifying interactions, Elastic net (Enet) by Zou et al., Lasso for Hierarchical Interactions (HierNet) by Bien et al., and selection of nonlinear interactions by a forward stepwise algorithm (SNIF) by Narisetty et al. have the most stable performance across simulation settings. For overall summary or a cumulative measure, we find that using the Super Learner to combine multiple environmental risk scores can lead to improved risk stratification and prediction properties.

Conclusions: We develop an integrated R package "CompMix" that provides a platform for mixtures analysis where the practitioners can implement a pipeline that includes several approaches for mixtures analysis. Our study offers guidelines for selecting appropriate statistical methods for addressing specific scientific questions related to mixtures research. We identify critical gaps where new and better methods are needed. https://doi.org/10.1289/EHP15305.


Figures

Figure 1 is a flowchart that has three steps. Step 1: Pollutant selection: penalized regressions, including Lasso, elastic-net, group-Lasso and Machine learning, including B K M R, random forests led to super learner-E R S. Step 2: Interaction detection: targeted interaction search methods, including HierNet, HigLAsso, S N I F led to super learner-E R S. Step 3: Outcome Prediction and Risk stratification: Summary measure, including environmental risk score, W Q S, Q-group led to super learner-E R S.
Figure 1.
Methods for mixtures analysis categorized in three groups, depending on inferential goals.
Figure 2 is a workflow diagram for simulation and evaluation of exposure-outcome models with four steps. The flowchart is organized into a multi-step pipeline with boxes connected by arrows of different colors, showing the direction and type of analysis. It consists of the following key stages: Step 1. Model Setting and Data Generation (Left Side): Top Left (Model Setting): A box labeled with symbols like n, p, q, R², and “Mean functions” under “Model Setting.” Arrow: Connects to “Data Generation” box. Data Generation: Uses models (L M, L M I, N M, N M I) to create both training and testing datasets for exposures and outcomes. Step 2. Exposure or Interaction Selection (Center Top): Training Data Box: Connects to several model methods for selection and fitting: Exposure or Interaction Selection: Uses Lasso, Enet, G-Lasso, HigLasso, HierNet, S N I F. Exposure Selection: Uses B K M R and R F. Selected Exposures and Interactions are routed separately for downstream analysis. Selection Accuracy Evaluation is shown at the top with a reference to “Table S 4.” Step 3. Fitting and Prediction Models (Middle or Right): Fitted Model Boxes: Left side: Enet-M I, B KM R, HierNet, S N I F. Right side: W Q S-M*, Q-gcomp-M asterisk, with various combinations including M I (multiple imputation) and M*. Prediction Boxes: Enet-M I, B K M R, HierNet, S N I F. W Q S-M asterisk, Q-gcomp-M asterisk and their variants. Arrows link from Selected Exposures or Interactions to Fitted Model, and then to Prediction. Step 4. Evaluation Bottom Center: Summary Measure Evaluation: Metrics: S S E, Corr (for continuous outcomes); area under the curve, Odds ratio (for binary outcomes). Linked to “Table 3” for summary. Arrows connect model predictions to the evaluation box. The arrows represents model selection and flow of input parameters, data movement from generation to evaluation, and model fitting or prediction leading to evaluation.
Figure 2.
Schematic diagram of the simulation study. Note: BKMR, Bayesian kernel machine regression; Enet-M, elastic net for main effects; Enet-MI, elastic net for main effects and interactions; ERS, environmental risk score; G-Lasso-M, group lasso for main effects; G-Lasso-MI, group lasso for main effects and interactions; HierNet, lasso for hierarchical interactions; HigLasso, hierarchical integrative group lasso; Lasso-M, lasso for main effects; Lasso-MI, lasso for main effects and interactions; LM, linear main effects; LMI, linear main effects and interactions; NM, nonlinear main effects; NMI, nonlinear main effects and interactions; Q-gcomp, quantile g-computation; Q-gcomp-M*, Q-gcomp for selected main effects by Enet-M; Q-gcomp-MI*, Q-gcomp for selected main effects and interactions by Enet-MI; Q-gcomp-M, Q-gcomp for main effects; Q-gcomp-MI, Q-gcomp for main effects and interactions; RF, random forest; SL-ERS, environmental risk score; SuperLearner used to adaptively combine component ERS through weighting; SNIF, selection of nonlinear interactions by a forward stepwise algorithm; WQS, weighted quantile sum regression; WQS-M*, WQS for selected main effects by Enet-M; WQS-M, WQS for main effects and interactions.
Figure 3 is a correlation heatmap, plotting T C S, P-P B, M-P B, B P A, B P-3, 25-D C P, 24-D C P, M I B P, M E P, M E O H P, M E H P, M E H H P, M E C P P, M C P P, M C O P, M C N P, M B Z P, M B P, 4-O H-P H E, 2-O H-N A P, 2-O H-F L U, 2-3-O H –P H E, 1-O H-P Y R, 1-O H-P H E, 1-O H-N AP, zinc, thallium, tin, lead, nickel, molybdenum, manganese, mercury, copper, cesium, cobalt, cadmium, barium, and arsenic (y-axis) across arsenic, barium, cadmium, cobalt, cesium, copper, mercury, manganese, molybdenum, nickel, lead, tin, thallium, zinc, 1-O H-N AP, 1-O H-P Y R, 1-O H-P H E, 2-2-3-O H –P H E, 2-O H-F L U, 2-O H-N A P, 4-O H-P H E, M B P, M B Z P, M C N P, M C O P, M C P P, M E C P P, M E H H P, M E H P, M E O H P, M E P, M I B P, 24-D C P, 25-D C P, B P-3, B P A, M-P B, P-P B, T C S (x-axis). A scale depict the birth weight preterm ranges from negative 0.1 to 1 in increments of 0.1. There are 14 metals, 7 PAHs, 11 phthalates, 7 phenols.
Figure 3.
Standard structure of a mixtures analysis: correlation heatmap of log-transformed geometric mean of specific gravity-adjusted concentrations across three visits for 39 pollutants from urine samples in the PROTECT study. The chemicals are ordered by four families: metals, PAHs, phthalates, and phenols, forming four blocks in the heatmap. On the left side of the figure, daily products that may contain the pollutants are shown. On the right side of the figure, we show the birth outcomes of interest. Please refer to Excel Table S1 for correlation matrix values. The illustration images in this figure were designed by Freepik. Note: PAHs, polycyclic aromatic hydrocarbons.
Figure 4 is a set of eight dot plots. The top-four graphs are titled L M, N M, L M I, and N M I, plotting specificity, ranging from 0.0 to 1.0 in increments of 0.2 (y-axis) across sensitivity, ranging from 0.0 to 1.0 in increments of 0.2 (x-axis) for Lasso-M, Enet-M, G-Lasso-M, Lasso-M I, Enet-M I, G-Lasso-M I, B K M R, R F, HigLasso, HierNet, S N I F, main, interaction. The bottom-four graphs are titled L M, N M, L M I, and N M I, plotting false discovery rate, ranging from 0.0 to 1.0 in increments of 0.2 (y-axis) across sensitivity, ranging from 0.0 to 1.0 in increments of 0.2 (x-axis) for Lasso-M, Enet-M, G-Lasso-M, Lasso-M I, Enet-M I, G-Lasso-M I, B K M R, R F, HigLasso, HierNet, S N I F, main, interaction.
Figure 4.
Selection accuracy for main and interaction identification among 11 methods, where continuous outcome is generated from LM, NM, LMI, and NMI. Means of Sensitivity, Specificity, and FDR are obtained from 500 data replications with ntrain=500, p=20, q=5, and R2=0.2. Please refer to Table S4 in supplementary material for details. Note: FDR, false discovery rate; LM, linear main effects; LMI, linear main effects and interactions; NM, nonlinear main effects; NMI, nonlinear main effects and interactions.
Figure 5 is a set of eight dot plots. The top-four graphs are titled Logit, Nlogit, LogitI, and NlogitI, plotting specificity, ranging from 0.0 to 1.0 in increments of 0.2 (y-axis) across sensitivity, ranging from 0.0 to 1.0 in increments of 0.2 (x-axis) for Lasso-M, Enet-M, G-Lasso-M, Lasso-M I, Enet-M I, G-Lasso-M I, R F, HierNet, main, interaction. The bottom-four graphs are titled Logit, Nlogit, LogitI, and NlogitI, plotting false discovery rate, ranging from 0.0 to 1.0 in increments of 0.2 (y-axis) across sensitivity, ranging from 0.0 to 1.0 in increments of 0.2 (x-axis) for Lasso-M, Enet-M, G-Lasso-M, Lasso-M I, Enet-M I, G-Lasso-M I, R F, HierNet, main, interaction.
Figure 5.
Selection accuracy for main and interaction identification among seven methods, where binary outcome is generated from Logit, Nlogit, LogitI, and NlogitI. Means of Sensitivity, Specificity, and FDR are obtained from 500 data replications with ntrain=500, p=20, q=5, and R2=0.2. Please refer to Table S5 in supplementary material for details. Note: FDR, false discovery rate; Logit, logit link linear main effects; LogitI, logit link linear main effects and interactions; Nlogit, logit link nonlinear main effects; NlogitI, logit link nonlinear main effects and interactions.

Update of

Similar articles

Cited by

References

    1. Carlin DJ, Rider CV, Woychik R, Birnbaum LS. 2013. Unraveling the health effects of environmental mixtures: an NIEHS priority. Environ Health Perspect 121(1):A6–A8, PMID: 23409283, 10.1289/ehp.1206182. - DOI - PMC - PubMed
    1. Taylor KW, Joubert BR, Braun JM, Dilworth C, Gennings C, Hauser R, et al. 2016. Statistical approaches for assessing health effects of environmental chemical mixtures in epidemiology: lessons from an innovative workshop. Environ Health Perspect 124(12):A227–A229, PMID: 27905274, 10.1289/EHP547. - DOI - PMC - PubMed
    1. Joubert BR, Kioumourtzoglou M-A, Chamberlain T, Chen HY, Gennings C, Turyk ME, et al. 2022. Powering Research through Innovative Methods for mixtures in Epidemiology (PRIME) program: novel and expanded statistical methods. Int J Environ Res Public Health 19(3):1378, PMID: 35162394, 10.3390/ijerph19031378. - DOI - PMC - PubMed
    1. Osterman MJK, Hamilton BE, Martin JA, Driscoll AK, Valenzuela CP. 2022. Births: Final Data for 2020. National Center for Health Statistics (US). National Vital Statistics Reports. https://stacks.cdc.gov/view/cdc/112078 [accessed 11 June 2025].
    1. Kajantie E, Osmond C, Barker DJ, Eriksson JG. 2010. Preterm birth–a risk factor for type 2 diabetes? The Helsinki Birth Cohort study. Diabetes Care 33(12):2623–2625, PMID: 20823347, 10.2337/dc10-0912. - DOI - PMC - PubMed

Substances

LinkOut - more resources