. 2025 Jul:84:103675.
doi: 10.1016/j.redox.2025.103675. Epub 2025 May 17.

Hypobaric hypoxia-driven energy metabolism disturbance facilitates vascular endothelial dysfunction

Affiliations

Hypobaric hypoxia-driven energy metabolism disturbance facilitates vascular endothelial dysfunction

Yuyu Zhang et al. Redox Biol. 2025 Jul.

Abstract

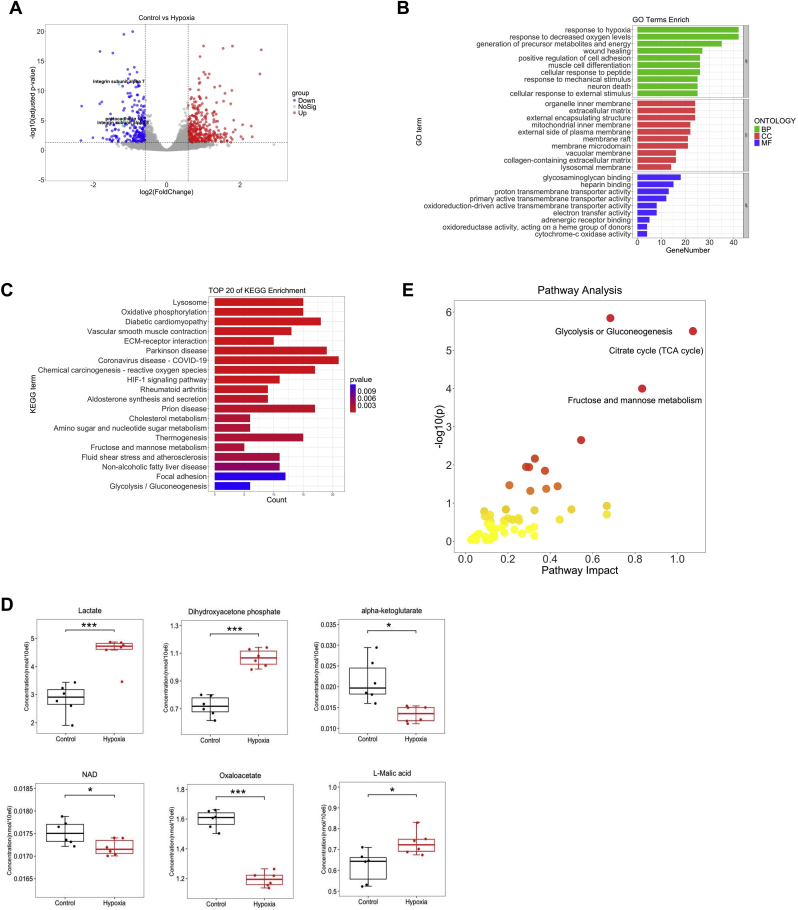
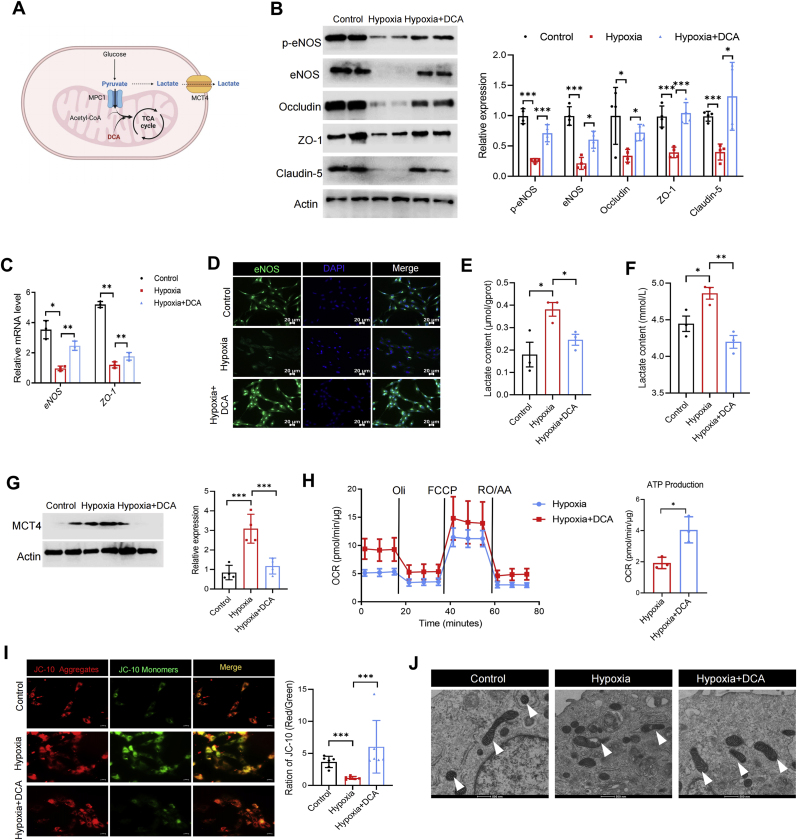
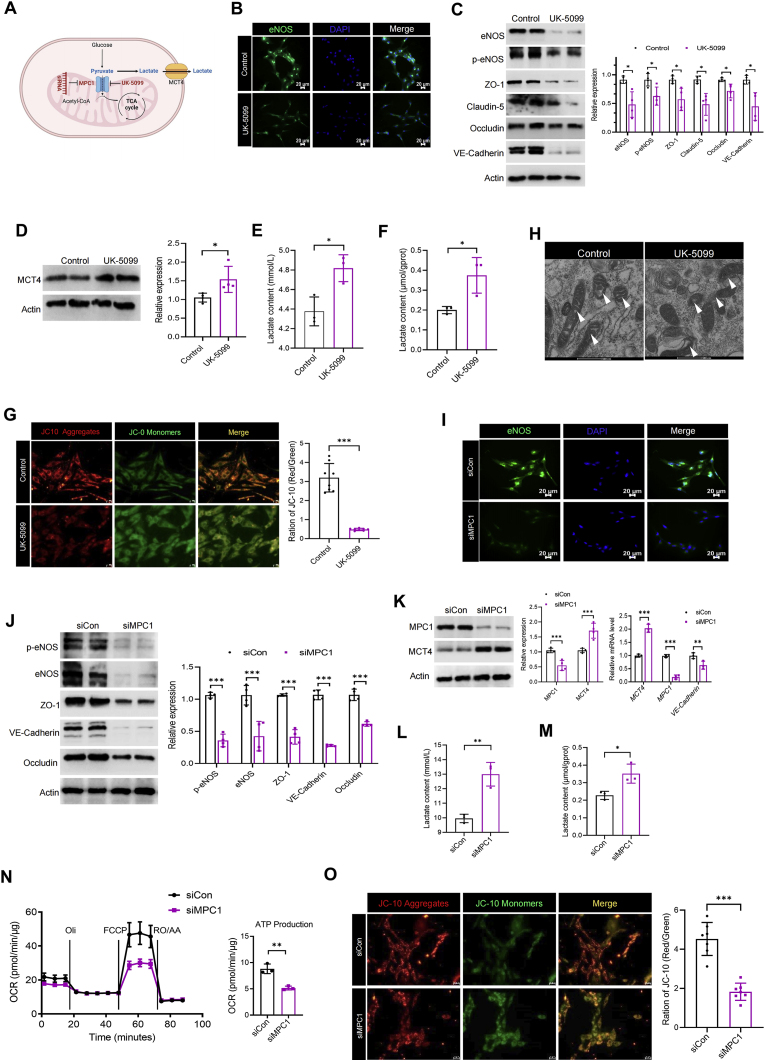
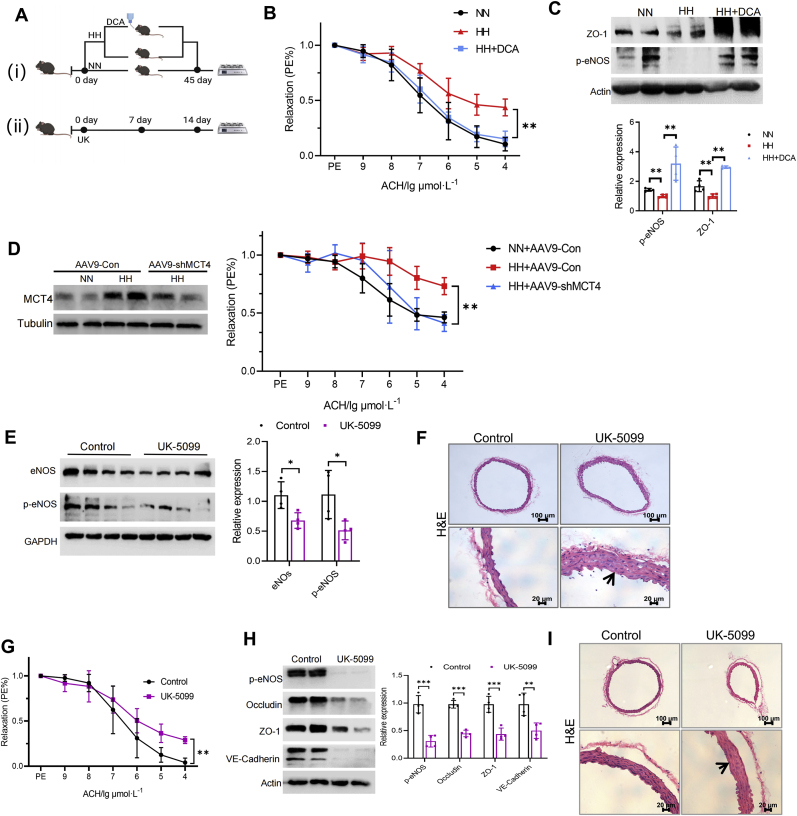
Hypobaric hypoxia in plateau environments inevitably disrupts metabolic homeostasis and contributes to high-altitude diseases. Vascular endothelial cells play a crucial role in maintaining vascular homeostasis. However, it remains unclear whether hypoxia-mediated changes in energy metabolism compromise vascular system stability and function. Through integrated transcriptomic and targeted metabolomic analyses, we identified that hypoxia induces vascular endothelial dysfunction via energy metabolism dysregulation. Specifically, hypoxia drives a metabolic shift toward glycolysis over oxidative phosphorylation in vascular endothelial cells, resulting in excessive lactate production. This lactate overload triggers PKM2 lactylation, which stabilizes PKM2 by inhibiting ubiquitination, forming a feedforward loop that exacerbates mitochondrial collapse and vascular endothelial dysfunction. Importantly, blocking the pyruvate-lactate axis helps maintain the balance between glycolysis and oxidative phosphorylation, thereby protecting vascular endothelial function under hypoxic conditions. Our findings not only elucidate a novel mechanism underlying hypoxia-induced vascular damage but also highlight the pyruvate-lactate axis as a potential therapeutic target for preventing vascular diseases in both altitude-related and pathological hypoxia.

Keywords: Energy metabolism; High-altitude; Hypobaric hypoxia; Lactate; PKM2; Vascular endothelial dysfunction.


Conflict of interest statement

Declaration of competing interest The authors declare that they have no known competing financial interests or personal relationships that could have appeared to influence the work reported in this paper.

Figures

Image 1
Graphical abstract
Fig. 1
Fig. 1
Combined transcriptomics and targeted metabolomics analysis reveals characterization of vascular endothelial cells upon hypoxia exposure. Rat aortic endothelial cells (RAECs) were cultured at 5 % O2 for 72 h and then subjected to RNA-seq analysis. Differentially expressed genes (DEGs) of RAECs (A); Gene ontology (GO) analysis of RAECs under hypoxic condition (B); KEGG functional enrichment analysis of RAECs (C). RAECs were cultured at 5 % O2 for 72 h and then subjected to targeted energy metabolomics analysis, differential metabolites detected in RAECs by targeted metabolomics. ∗p < 0.05, ∗∗∗p < 0.001 (D); MetPA analysis of RAECs under hypoxic condition (E).
Fig. 2
Fig. 2
Hypoxia leads to vascular endothelial dysfunction and energy metabolism disorders. (AB) Mice were placed for 45 days in a plateau simulated chamber with an oxygen concentration of about 9.0 % at an altitude of 6000 m. Endothelium-dependent relaxations to acetylcholine was measured using isolated aortic rings. ∗∗p < 0.01 (n = 6) (A); The protein expression of p-eNOS, eNOS, Claudin-5, ZO-1, Occludin and VE-Cadherin in thoracic aorta of mice were detected. ∗p < 0.05, ∗∗p < 0.01, ∗∗∗p < 0.001 (n = 4) (B). (CJ) RAECs were cultured at 5 % O2 for 72 h. The protein expression of ZO-1, eNOS and p-eNOS was analyzed. ∗∗p < 0.01 (n = 4) (C); Representative images of immunofluorescence analysis of eNOS expression (D); Lactate content in the supernatant of RAECs culture. ∗p < 0.05 (n = 3) (E); Protein expression and mRNA level of MCT4. ∗p < 0.05, ∗∗p < 0.01 (n = 3) (F); ATP content in RAECs cytoplasm. ∗∗∗p < 0.001 (n = 3) (G); Mitochondrial respiration of RAECs was measured by Seahorse XFp. ∗∗p < 0.01 (n = 3) (H); Representative transmission electron microscopy (TEM) images of RAECs mitochondria, the arrows indicate mitochondria (I); Representative images of the mitochondrial membrane potential detected by JC-10, which was quantified by the red-green fluorescence ratio. ∗∗∗p < 0.001 (n = 7) (J).
Fig. 3
Fig. 3
Blocking PDK improves vascular endothelial dysfunction through promoting oxidative phosphorylation in hypoxia exposure VECs. RAECs was treated with dichloroacetate (DCA, 3 mM) for 24 h and then cultured under hypoxic conditions for 72 h, DCA can force pyruvate to enter oxidative phosphorylation (A); The protein expression of p-eNOS, eNOS, Occludin, ZO-1 and Claudin-5 was analyzed. ∗p < 0.05, ∗∗∗p < 0.001 (n = 4) (B); The transcription level of eNOS and ZO-1. ∗p < 0.05, ∗∗p < 0.01 (n = 3) (C); Representative images of immunofluorescence analysis of eNOS expression (D); Lactate content in the cytosol of RAECs, normalized using intracellular protein content. ∗p < 0.05 (n = 3) (E); Lactate content in the supernatant of RAECs culture. ∗p < 0.05, ∗∗p < 0.01 (n = 3) (F); The protein expression of MCT4. ∗∗∗p < 0.001, (n = 4) (G); Relative mitochondrial respiration of RAECs under different treatments was measured. ∗p < 0.05 (n = 3) (H); Representative images of the mitochondrial membrane potential of RAECs detected by JC-10 after different treatments, mitochondrial membrane potential was quantified by red-green fluorescence ratio. ∗∗∗p < 0.001 (n = 6) (I). TEM images of RAECs mitochondria after different treatments, the arrows indicate mitochondria (J).
Fig. 4
Fig. 4
Knocking down MCT4 improves hypoxia-mediated vascular endothelial dysfunction. RAECs were transfected with MCT4 or control siRNA, then followed by culturing in 5 % O2 for 72 h. Diagram of cell energy metabolism after knocking down MCT4 using siRNA (A); The protein expression of MCT4, eNOS, p-eNOS, ZO-1 and VE-Cadherin in RAECs was detected. ∗p < 0.05, ∗∗p < 0.01, ∗∗∗p < 0.001 (n = 4) (B); Representative images of immunofluorescence analysis of eNOS (C); Relative transcription levels of eNOS, MCT4, Occludin, VE-Cadherin and ZO-1 in RAECs under different treatments. ∗p < 0.05, ∗∗p < 0.01, ∗∗∗p < 0.001 (n = 3) (D); Lactate content in the supernatant of RAECs culture. ∗p < 0.05, ∗∗∗p < 0.001 (n = 3) (E); Lactate content in the cytosol of RAECs, normalized using intracellular protein content. ∗∗p < 0.01, ∗∗∗p < 0.001 (n = 3) (F); ATP content in RAECs cytoplasm, normalized using intracellular protein content. ∗∗∗p < 0.001 (n = 3) (G); Representative images of the mitochondrial membrane potential of RAECs detected by JC-10 after different treatments, mitochondrial membrane potential was quantified by red-green fluorescence ratio. ∗∗∗p < 0.001 (n = 8) (H).
Fig. 5
Fig. 5
Blocking MPC1 impairs vascular endothelial function though disrupting energy homeostasis. Diagram of cell energy metabolism after blocking MPC1 using siRNA or UK-5099 (10 μM) (A); (B–H) RAECs was treated with UK-5099 for 24 h to block MPC1. Representative images of immunofluorescence analysis of eNOS (B); The protein expression of eNOS, p-eNOS, ZO-1, Claudin-5, Occludin and VE-Cadherin was detected. ∗p < 0.05 (n = 4) (C); The protein expression of MCT4 in RAECs. ∗p < 0.05 (n = 4) (D); Lactate content in the supernatant of RAECs culture. ∗p < 0.05 (n = 3) (E); Lactate content in the cytosol of RAECs, normalized using intracellular protein content. ∗p < 0.05 (n = 3) (F); Representative images of the mitochondrial membrane potential of RAECs detected by JC-10, mitochondrial membrane potential was quantified by red-green fluorescence ratio. ∗∗∗p < 0.001 (n = 8) (G); Representative TEM images of RAECs mitochondria, the arrows indicate mitochondria (H); (I–O) RAECs were transfected with MPC1 siRNA to knock down MPC1. Representative images of immunofluorescence analysis of eNOS in RAECs after knocking down MPC1 (I); The protein expression of eNOS, p-eNOS, ZO-1, Occludin and VE-Cadherin was detected. ∗∗∗p < 0.001 (n = 4) (J); The protein and mRNA levels of MCT4 and MPC1 were detected. ∗∗p < 0.01, ∗∗∗p < 0.001 (n = 4) (K); Lactate content in the supernatant of RAECs culture. ∗∗p < 0.01 (n = 3) (L); Lactate content in the cytosol of RAECs, normalized using intracellular protein content. ∗p < 0.05 (n = 3) (M); The oxygen consumption rate (OCR) of RAECs after MPC1 knockdown was analyzed by Seahorse XF analyzer, and the ATP production was normalized using intracellular protein content. ∗∗p < 0.01 (n = 3) (N). Representative images of the mitochondrial membrane potential of RAECs detected by JC-10 after knocking down MPC1, and mitochondrial membrane potential was quantified by red-green fluorescence ratio. ∗∗∗p < 0.001 (n = 7) (O).
Fig. 6
Fig. 6
Administration of a PDK inhibitor improves vascular endothelial function in hypobaric hypoxia environment, while an MPC inhibitor drives vascular endothelial dysfunction. (A) Diagram of experiment. (i) Mice were randomly divided into three groups: Normoxia (NN), Hypobaric hypoxia (HH) and Hypobaric hypoxia + DCA (HH + DCA). After the mice adapted to the environment, the hypobaric hypoxia group and DCA group were put into a simulated chamber of hypobaric hypoxia. The normoxia group was fed at normal altitude. The mice in the DCA group were fed ddH2O containing DCA, while the other groups were fed normal diet. 45 days later, the thoracic aorta was collected for follow-up experiments. (ii) Mice were randomly divided into two groups: control and UK-5099. The administration group was injected intraperitoneally with UK-5099 every day for 7 and 14 days. "Endothelium-dependent relaxation in response to acetylcholine was measured in mice from NN, HH and HH + DCA. ∗∗p < 0.01 (n = 6) (B); The protein expression of p-eNOS and ZO-1 in thoracic aorta in mice from NN, HH and HH + DCA. ∗∗p < 0.01 (n = 4) (C); Mice were injected with AAV9-ENT-MCT4 shRNA or negative control intravenically, cultured under normal environment for 2 weeks, and then transferred to a hypobaric hypoxia simulated chamber for 45 days, and then the endothellar-dependent relaxation function of mice was measured. ∗∗p < 0.01 (n = 7) (D); The protein expression of p-eNOS and eNOS in thoracic aorta of control and UK-5099 treated mice for 7 days. ∗p < 0.05 (n = 4) (E); Representative images of pathological changes of thoracic aorta damages with H&E staining in mice treated with UK-5099 for 7 days (F); Endothelium-dependent relaxations to acetylcholine was measured in mice treated with UK-5099 for 14 days. ∗∗p < 0.01 (n = 6) (G); Relative expression of p-eNOS, Occludin, ZO-1 and VE-Cadherin in thoracic aorta of mice treated with UK-5099 for 14 days. ∗∗p < 0.01, ∗∗∗p < 0.001 (n = 4) (H); Representative images of pathological changes of thoracic aorta damages with H&E staining in mice treated with UK-5099 for 14 days (I).
Fig. 7
Fig. 7
Blocking PKM2 alleviates vascular endothelial dysfunction caused by hypoxia by inhibiting energy metabolism disorders. Relative expression of PKM2 in RAECs cultured under hypoxic conditions for 48 h and 72 h (A); (B–F) RAECs was treated with PKM2-IN-1 at a final concentration of 2 and 4 μM for 24 h, respectively, and then cultured under 5 % O2 for 72 h. Lactate content in the supernatant of RAECs culture. ∗p < 0.05, ∗∗p < 0.01 (n = 3) (B); Lactate content in the cytosol of RAECs, normalized using intracellular protein content. ∗p < 0.05, ∗∗p < 0.01 (n = 3) (C); The protein expression of eNOS, PKM2 and p-eNOS in RAECs sunder different treatments. ∗p < 0.05, ∗∗∗p < 0.001 (n = 4) (D); Representative images of immunofluorescence analysis of eNOS in RAECs (E); Representative images of the mitochondrial membrane potential detected by JC-10, and mitochondrial membrane potential was quantified by red-green fluorescence ratio. ∗∗∗p < 0.001 (n = 8) (F). (G-K) RAECs were transfected with siRNA for 24 h and then cultured in 5 % O2 for 72 h. The protein expression of PKM2, eNOS and p-eNOS in RAECs under different treatments. ∗p < 0.05, ∗∗p < 0.01, ∗∗∗p < 0.001 (n = 4) (G); Representative images of immunofluorescence analysis of eNOS in RAECs (H); Lactate content in the supernatant of RAECs culture. ∗∗∗p < 0.001 (n = 3) (I); OCR of RAECs after PKM2 knockdown was analyzed by Seahorse XF analyzer, and the production of ATP was quantified. ∗∗p < 0.01 (n = 3) (J); Representative TEM images of RAECs mitochondria under different conditions, the arrows indicate mitochondria (K).
Fig. 8
Fig. 8
PKM2 lactylation worsens energy metabolic imbalance leading to vascular endothelial dysfunction. Relative protein expression of eNOS, ZO-1 and VE-Cadherin in RAECs treated with lactate (20 μM) (A); Representative images of immunofluorescence analysis of eNOS in RAECs treated with lactate (B); The OCR of RAECs treated with lactate was analyzed by Seahorse XF analyzer, and the production of ATP was quantified. ∗p < 0.05 (n = 3) (C); Representative images of the mitochondrial membrane potential of RAECs treated with lactate detected by JC-10, and mitochondrial membrane potential was quantified by red-green fluorescence ratio. ∗∗∗p < 0.001 (n = 8) (D); Changes in PKM2 lactylation after hypoxia exposure in RAECs (E); Changes in PKM2 lactylation after lactate stimulation in RAECs (F); Changes in PKM2 ubiquitination after hypoxia exposure in RAECs (G); Lysates were immunoprecipitated using anti-PKM2 and subsequently immunoblotted with antibodies against L-Lactyl Lysine (Kla) or K48 in RAECs treated with SO or Glomeratose An under hypoxia (H).

References

    1. Pena E., El Alam S., Siques P., Brito J. Oxidative stress and diseases associated with high-altitude exposure. Antioxidants. 2022;11:267. - PMC - PubMed
    1. Gerstein H.C., Colhoun H.M., Dagenais G.R., Diaz R., Lakshmanan M., Pais P., et al. Dulaglutide and cardiovascular outcomes in type 2 diabetes (REWIND): a double-blind, randomised placebo-controlled trial. Lancet. 2019;394:121–130. - PubMed
    1. Rajendran P., Rengarajan T., Thangavel J., Nishigaki Y., Sakthisekaran D., Sethi G., et al. The vascular endothelium and human diseases. Int. J. Biol. Sci. 2013;9:1057–1069. - PMC - PubMed
    1. Simon M.P., Tournaire R., Pouyssegur J. The angiopoietin-2 gene of endothelial cells is up-regulated in hypoxia by a HIF binding site located in its first intron and by the central factors GATA-2 and Ets-1. J. Cell. Physiol. 2008;217:809–818. - PubMed
    1. Bosch-Marce M., Okuyama H., Wesley J.B., Sarkar K., Kimura H., Liu Y.V., et al. Effects of aging and hypoxia-inducible factor-1 activity on angiogenic cell mobilization and recovery of perfusion after limb ischemia. Circ. Res. 2007;101:1310–1318. - PubMed

LinkOut - more resources