. 2025 May 19;5(5):101050.
doi: 10.1016/j.crmeth.2025.101050.

A circadian behavioral analysis suite for real-time classification of daily rhythms in complex behaviors

Affiliations

A circadian behavioral analysis suite for real-time classification of daily rhythms in complex behaviors

Logan J Perry et al. Cell Rep Methods. .

Abstract

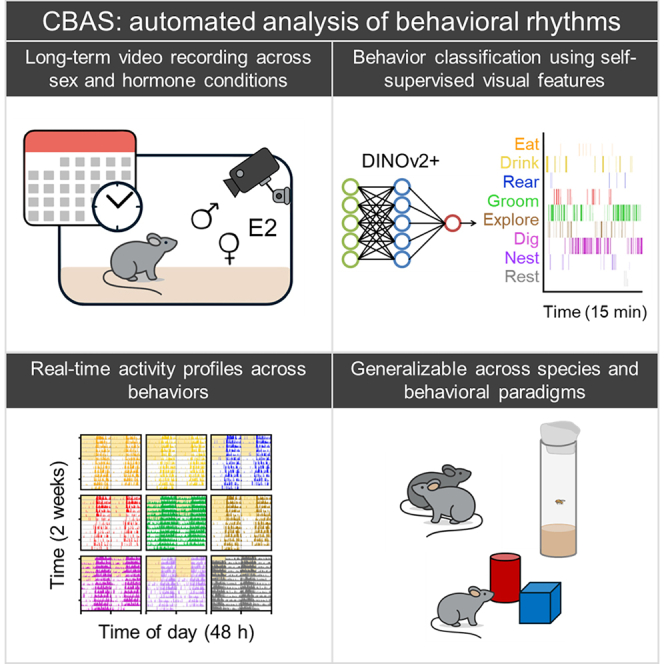
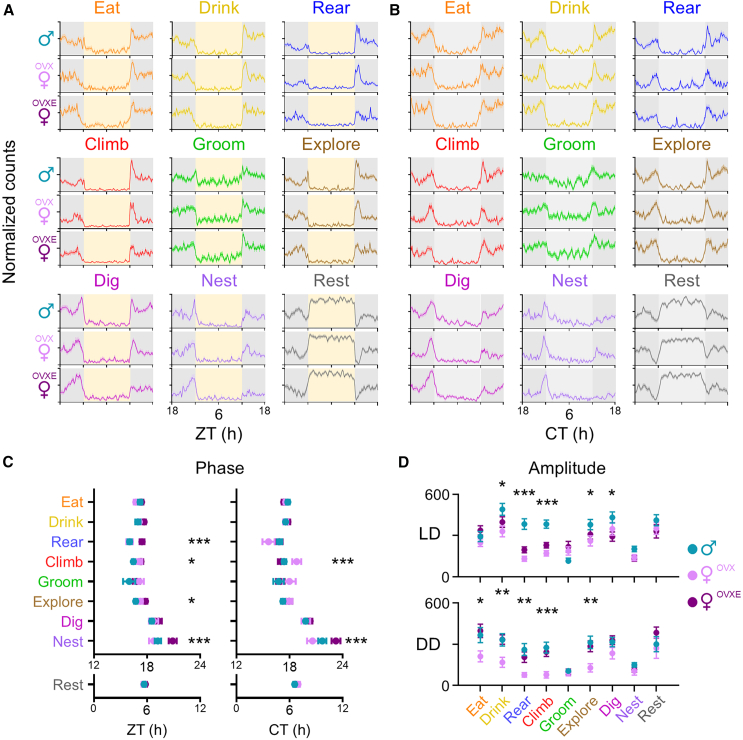
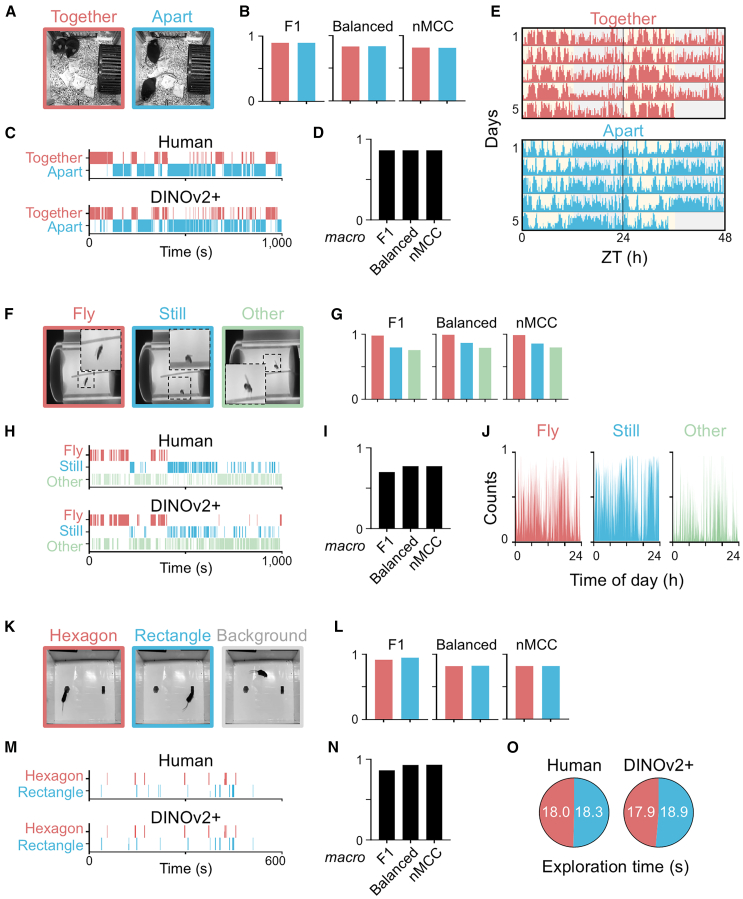
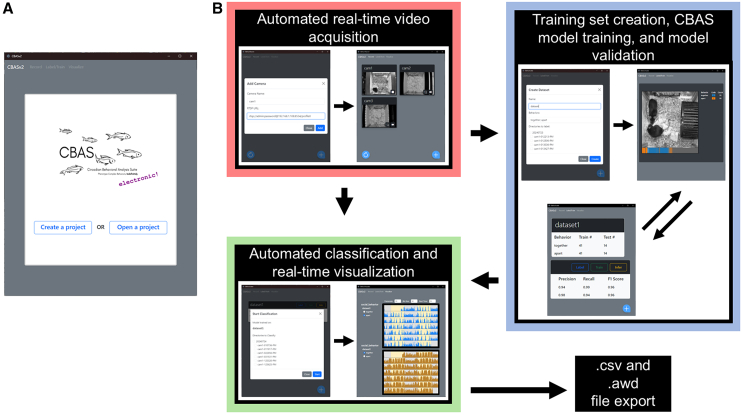
Long-term analysis of animal behavior has been limited by reliance on real-time sensors or manual scoring. Existing machine learning tools can automate analysis but often fail under variable conditions or ignore temporal dynamics. We developed a scalable pipeline for continuous, real-time acquisition and classification of behavior across multiple animals and conditions. At its core is a self-supervised vision model paired with a lightweight classifier that enables robust performance with minimal manual labeling. Our system achieves expert-level performance and can operate indefinitely across diverse recording environments. As a proof-of-concept, we recorded 97 mice over 2 weeks to test whether sex hormones influence circadian behaviors. We discovered sex- and estrogen-dependent rhythms in behaviors such as digging and nesting. We introduce the Circadian Behavioral Analysis Suite (CBAS), a modular toolkit that supports high-throughput, long-timescale behavioral phenotyping, allowing for the temporal analysis of behaviors that were previously difficult or impossible to observe.

Keywords: CP: Imaging; CP: Neuroscience; behavior; circadian; home cage; machine learning; phenotyping; rhythms.


Conflict of interest statement

Declaration of interests The authors declare no competing interests.

Figures

None
Graphical abstract
Figure 1
Figure 1
Standardization of home cage behavior classification (A) Schematic of the home cage video recording setup. (B) Example video frames for each of nine ethologically relevant behaviors: eating (orange), drinking (yellow), rearing (blue), climbing (red), grooming (green), exploring (brown), digging (magenta), nesting (purple), and resting (gray). First frame shows full cage; subsequent frames are zoomed in. (C) Bout durations for each behavior across a maximum observation window of 360 s n ≥ 38 bouts per behavior from 29 to 30 mice. Box and whisker plots show median and interquartile range. (D) Distribution of labeled behavior instances in the 8.1-h human-annotated dataset, separated into training and test sets.
Figure 2
Figure 2
DINOv2+ achieves expert-level classification performance (A) Schematic of the DINOv2+ architecture. Visual features are extracted from a frozen DINOv2 backbone and passed to a trainable LSTM and linear layer classification head. (B) Precision-recall curves for each behavior from DINOv2+ (solid lines) and DeepEthogram (DEG) (dashed lines). Shaded regions show area under the precision-recall curve (AUPRC). Bootstrap test for AUPRC comparisons; ∗∗p < 0.01, ∗∗∗p < 0.001. (C) F1 score, balanced accuracy, and normalized Matthews correlation coefficient (nMCC) for each model and a trained human classifier. n = 10 resampled sets of 1,000 test frames per behavior. Dashed line at 0.80 indicates predefined performance threshold. two-way ANOVA with Tukey’s post-hoc test; ∗p < 0.05. (D) Ethograms comparing human and DINOv2+ classification on naive videos recorded during light (day 1), dark (day 1), and dark (day 12) phases. (E) Macro F1, balanced accuracy, and nMCC scores comparing DINOv2+ output to human ground truth labels across all three conditions.
Figure 3
Figure 3
DINOv2+ supports real-time behavior classification across multiple animals (A) Diagram of the real-time video acquisition and inference pipeline with 24 power-over-ethernet IP cameras, gigabit switches, machine learning workstations, and network-attached storage. (B) Inference speeds (frames per second) for 5–30 min video segments using DLC (green), DEG (blue), or DINOv2+ (red); n = 3 replicates/model. two-way ANOVA with post-hoc Tukey’s test; ∗p < 0.05, ∗∗∗p < 0.001. (C) Inference times for each model across combinations of segment length (5, 10, and 30 min) and simultaneous camera streams (10 or 20). Black X indicates failure to achieve real-time inference (i.e., inference time > video segment length). (D) Representative 48 h behavior time series from a mouse recorded in LD (12 h:12 h light/dark). Behaviors inferred in 30 min segments and plotted in an actogram-style format, updated every 6 h. ZT, zeitgeber time.
Figure 4
Figure 4
Sex and estrogen influence circadian rhythms in home cage behaviors (A–C) Representative double-plotted actograms of behavior rhythms from male (n = 8), ovariectomized (OVX) female (n = 8), and ovariectomized, estradiol-supplemented (OVXE) female (n = 8) mice recorded for 5 days in a 12 h:12 h light/dark cycle (LD)gray/yellow shading) and 5–9 days in constant darkness (DD) (gray/light gray shading). Behaviors are color-coded by type, with one row per behavior per mouse.
Figure 5
Figure 5
Sex and estrogen shape the phase and amplitude of home cage behavior rhythms (A and B) Average behavior profiles across all 12 h:12 h light/dark (LD) (A) and constant darkness (DD) (B) recording days for male (n = 23, blue), ovariectomized (OVX) female (n = 24, pink), and ovariectomized, estradiol-supplemented (OVXE) female (n = 22, purple) mice. DD data normalized to 24 h circadian time to account for period variability. (C) Center of mass times for each behavior in zeitgeber time (ZT) (for LD) or circadian time (CT) (for DD); lines show mean ± SEM. Watson-Williams or Mardia-Watson-Wheeler tests; ∗p < 0.05, ∗∗p < 0.01, ∗∗∗p < 0.001. (D) Lomb-Scargle periodogram amplitudes for each behavior rhythm. two-way ANOVA with post-hoc Tukey’s test; ∗p < 0.05, ∗∗p < 0.01, ∗∗∗p < 0.001. Lines show mean ± SEM.
Figure 6
Figure 6
DINOv2+ generalizes to new tasks, species, and environments (A) Representative video frames depicting “together” (red) and “apart” (blue) huddling behaviors. (B) Performance metrics (F1 score, balanced accuracy, and normalized Matthews correlation coefficient (nMCC) for each class. n = 4 unique cages (8 mice total); 170 test instances per behavior. (C) Ethograms comparing DINOv2+ predictions to trained human labels on naive video segments. (D) Macro-averaged performance scores comparing model output to human ground truth. (E) Double-plotted actograms of huddling behavior from a representative mouse pair recorded over 5 days in a 12 h:12 h light/dark (LD) cycle. (F) Representative frames depicting “fly” (red), “still” (blue), and “other” (green) behaviors, including grooming, walking, twitching, and miscellaneous activity. (G) Performance metrics for each class. n = 2 tubes; 75 test instances each for “fly” and “still,” 114 for “other.” (H) Ethograms comparing DINOv2+ and human labels on naive videos. (I) Macro F1, balanced accuracy, and nMCC scores versus human-labeled ground truth. (J) 24-h normalized activity profile for a representative Drosophila. (K) Representative frames showing object exploration: hexagon (red), rectangle (blue), or background (no interaction). (L) Performance metrics for each behavior. n = 4 mice recorded across both hexagon–hexagon and hexagon–rectangle object pairings; 29 test instances per behavior. (M) Ethograms comparing model predictions to human annotations on naive video trials. (N) Macro performance scores (F1, balanced accuracy, nMCC) for model versus human-labeled data. (O) Total exploration time per object (seconds), as measured by DINOv2+ and trained human classifier.
Figure 7
Figure 7
CBAS: A circadian behavioral analysis suite (A) CBAS is a user-friendly GUI-enabled Python package that allows for the automated acquisition, classification, and visualization of behaviors over time. (B) Schematic of CBAS pipeline: acquisition (red), training (blue), and classification/visualization (green) modules.

Update of

Similar articles

References

    1. Jud C., Schmutz I., Hampp G., Oster H., Albrecht U. A guideline for analyzing circadian wheel-running behavior in rodents under different lighting conditions. Biol. Proced. Online. 2005;7:101–116. - PMC - PubMed
    1. Metzger J., Wicht H., Korf H.-W., Pfeffer M. Seasonal Variations of Locomotor Activity Rhythms in Melatonin-Proficient and -Deficient Mice under Seminatural Outdoor Conditions. J. Biol. Rhythm. 2020;35:58–71. - PubMed
    1. Yamanaka Y., Honma S., Honma K.-I. Daily exposure to a running wheel entrains circadian rhythms in mice in parallel with development of an increase in spontaneous movement prior to running-wheel access. Am. J. Physiol. Regul. Integr. Comp. Physiol. 2013;305:R1367–R1375. - PubMed
    1. Schwartz W.J., Zimmerman P. Circadian timekeeping in BALB/c and C57BL/6 inbred mouse strains. J. Neurosci. 1990;10:3685–3694. - PMC - PubMed
    1. Pendergast J.S., Branecky K.L., Yang W., Ellacott K.L.J., Niswender K.D., Yamazaki S. High-fat diet acutely affects circadian organisation and eating behavior. Eur. J. Neurosci. 2013;37:1350–1356. - PMC - PubMed

LinkOut - more resources