. 2025 Jul 9;5(7):100881.
doi: 10.1016/j.xgen.2025.100881. Epub 2025 May 19.

Phenotypic heterogeneity and plasticity in colorectal cancer metastasis

Affiliations

Phenotypic heterogeneity and plasticity in colorectal cancer metastasis

Samuel Ogden et al. Cell Genom. .

Abstract

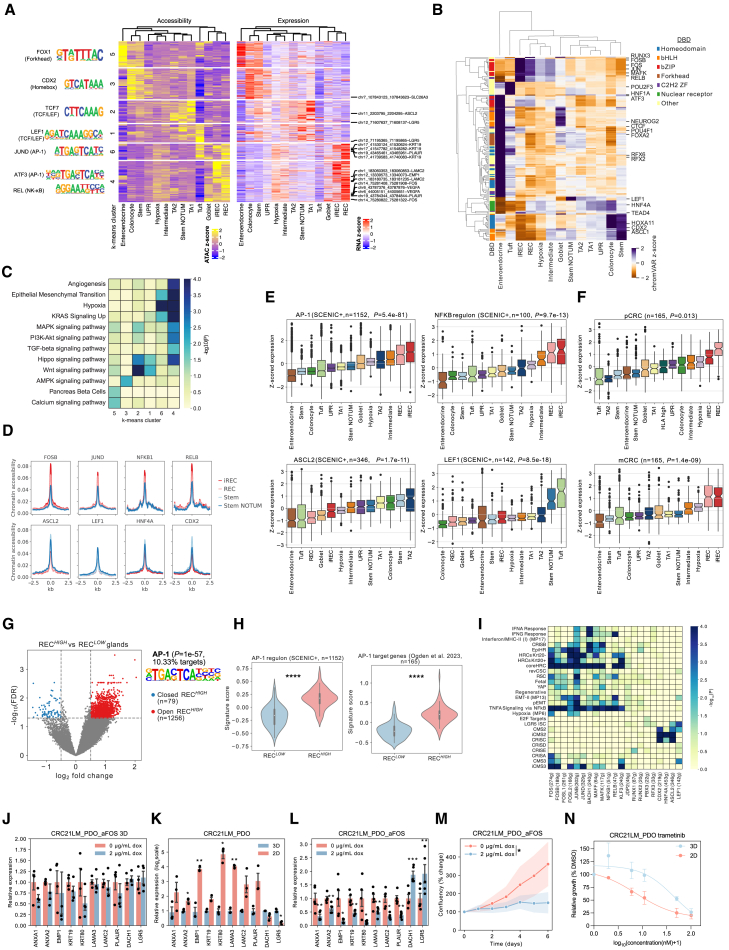
Phenotypic heterogeneity and plasticity in colorectal cancer (CRC) has a crucial role in tumor progression, metastasis, and therapy resistance. However, the regulatory factors and the extrinsic signals driving phenotypic heterogeneity remain unknown. Using a combination of single-cell multiomics and spatial transcriptomics data from primary and metastatic CRC patients, we reveal cancer cell states with regenerative and inflammatory phenotypes that closely resemble metastasis-initiating cells in mouse models. We identify an intermediate population with a hybrid regenerative and stem phenotype. We reveal the transcription factors AP-1 and nuclear factor κB (NF-κB) as their key regulators and show localization of these states in an immunosuppressive niche both at the invasive edge in primary CRC and in liver metastasis. We uncover ligand-receptor interactions predicted to activate the regenerative and inflammatory phenotype in cancer cells. Together, our findings reveal regulatory and signaling factors that mediate distinct cancer cell states and can serve as potential targets to impair metastasis.

Keywords: AP-1; NOTUM; colorectal cancer; metastasis; phenotypic heterogeneity; plasticity; single-cell multiomics; spatial transcriptomics.


Conflict of interest statement

Declaration of interests The authors declare no competing interests.

Figures

None
Graphical abstract
Figure 1
Figure 1
Heterogeneous cancer cell states in pCRC (A) Experimental design. (B) UMAP representation showing cell types in pCRC datasets.,,, (C) UMAP representation showing malignant pCRC states. (D) Proportions of cancer states in pCRC. (E) GEA of differentially expressed genes (DEGs) in cancer states for the indicated signatures: IFN/major histocompatibility complex (MHC) class II, hypoxia, and EMT-II; CRIS; EpiHR and coreHRC; revCSC; RSC; fetal; YAP; regenerative; pEMT; CMS2 and CMS3; iCMS2 and iCMS3; and MSigDB Hallmarks (Table S2). (F) Scaled mRNA expression of marker genes in pCRC. (G) The percentage of cancer states in the epithelial compartment for each CMS. Unpaired t test: ∗p < 0.05,∗∗p < 0.01, ∗∗∗p < 0.001, ∗∗∗∗p < 0.0001.
Figure 2
Figure 2
Cancer cell states are re-established in liver mCRC (A) UMAP representation showing cell types in mCRC Multiome data. (B) UMAP representation showing cancer cells in mCRC. (C) Proportion of cancer states across mCRC samples. (D) GEA of DEGs in mCRC states for the indicated signatures. (E) Scaled mRNA expression of indicated marker genes, ISGs, and KRT20 in mCRC cell states. (F) pCRC signature scores in mCRC cells. (G) Heatmap showing GEA of mCRC DEGs in the indicated hotspot and fetal signatures. (H) Multiome mCRC state scores in primary and metastatic samples from Moorman et al.
Figure 3
Figure 3
Regulation of cancer cell states (A) Left: chromatin accessibility of putative enhancers. Right: mRNA expression of genes linked to enhancers. (B) GEA of genes in k-means clusters using Kyoto Encyclopedia of Genes and Genomes (KEGG) pathways and MSigDB Hallmarks. (C) ChromVAR motif deviation Z scores for TFs in mCRC states (Wilcoxon, false discovery rate < 0.05), annotated based on the DNA binding domain. (D) Accessibility of chromatin regions in the indicated SCENIC+ regulons. (E) Z-scored expression of genes in SCENIC+ regulons across mCRC states. AP-1 and NF-κB regulons were formed by combining the regulons of FOS and JUN family members and the NF-κB subunits. One-way ANOVA. (F) Z-scored mRNA expression of AP-1 target genes across pCRC and mCRC states. One-way ANOVA. (G) Differentially accessible chromatin regions in RECHIGH relative to RECLOW glands. (H) Expression of AP-1 regulon genes or AP-1 target genes in RECHIGH and RECLOW glands. Unpaired t test. (I) GEA of the indicated signatures in TF regulons. Numbers in brackets indicate the number of genes in the regulon. (J) RT-qPCR analysis of the indicated genes following GFP-aFOS induction by 2 μg/mL doxycycline treatment in 3D. Paired t test; no genes were significant; n = 4. (K) RT-qPCR analysis of parental CRC21LM_PDO in 3D or on collagen I-coated plates (2D). Paired t test, n = 3. (L) RT-qPCR analysis of the indicated genes following GFP-aFOS induction under 2D culture conditions. Paired t test, n = 5. (M) Time-lapse live-cell imaging showing the change in confluency of organoids in 2D following GFP-aFOS induction. 2-way ANOVA, n = 3. (N) Cell proliferation assay of CRC21LM_PDO treated with trametinib in 3D and 2D culture systems; n = 3. Data are represented as mean ± SEM. ∗p < 0.05, ∗∗p < 0.01, ∗∗∗p < 0.001, ∗∗∗∗p < 0.0001.
Figure 4
Figure 4
Spatial neighborhoods in pCRC (A) Left: H&E staining and pathologist annotations of sample A1. Right: clustering annotations. (B) Left: H&E staining and pathologist annotations of sample C1. Right: clustering annotations. (C) GEA of upregulated genes in the invasive edge and the tumor core. (D) Abundance (color represents intensity) of cancer, stromal, and immune subpopulations in samples A1 and C1. (E) Left: spatial neighborhoods in samples A1 and C1. Right: dot plot representing average cell abundance (dot size and color) for each cell state, per neighborhood, and normalized between 0 and 1 per cell state. (F) Abundance of relevant cell types across cellular neighborhoods of the invasive edge and tumor core. (G) Expression of EpiHR and TME-HR signatures in spots in the spatial neighborhoods. (H) Abundance of relevant cell states in 6 samples stratified by histopathological annotation. (F, G, H) Kruskal-Wallis test followed by post hoc Dunn test. ∗p < 0.05,∗∗p < 0.01, ∗∗∗p < 0.001, ∗∗∗∗p < 0.0001; Benjamini-Hochberg adjustment.
Figure 5
Figure 5
Spatial cellular niches in liver mCRC (A) H&E staining of representative sample LM4 (neoadjuvant chemotherapy), manual annotations, and clustering annotations. The dashed line denotes the desmoplastic rim. (B) H&E staining of sample P13 (untreated), manual annotations, and clustering annotations. The dashed line denotes the tumor-liver border. (C) Abundance (color represents intensity) of cancer, stromal, and immune subpopulations in samples LM4 and P13. (D) Spatial cellular neighborhoods in LM4 and P13. (E) Dot plot representing average cell abundance (dot size and color) for each cell state, per neighborhood, and normalized between 0 and 1 per cell state. (F) GEA of upregulated genes in the cellular neighborhoods.
Figure 6
Figure 6
Cellular interactome of iRECs (A) Heatmaps showing Z score expression of selected ligands in TME cells (top) and corresponding receptors in cancer states (bottom). Shown are ligands in bold and receptors in gray for senders (top) and opposite for receivers (bottom). (B) GEA of ligands predicted to activate the AP-1 regulon in iRECs. (C) Circos plot depicting links (regulatory potential scores) between predicted ligands and AP-1 target genes. (D) Correlation of the expression of the pCRC state signatures and ligands predicted to activate AP-1 and NF-κB regulons in TCGA CRC RNA-seq data. Common are ligands whose expression is shared in more than one subpopulation. (E) Graphical summary created in BioRender.

References

    1. Gupta P.B., Pastushenko I., Skibinski A., Blanpain C., Kuperwasser C. Phenotypic Plasticity: Driver of Cancer Initiation, Progression, and Therapy Resistance. Cell Stem Cell. 2019;24:65–78. - PMC - PubMed
    1. Househam J., Heide T., Cresswell G.D., Spiteri I., Kimberley C., Zapata L., Lynn C., James C., Mossner M., Fernandez-Mateos J., et al. Phenotypic plasticity and genetic control in colorectal cancer evolution. Nature. 2022;611:744–753. - PMC - PubMed
    1. Dalerba P., Kalisky T., Sahoo D., Rajendran P.S., Rothenberg M.E., Leyrat A.A., Sim S., Okamoto J., Johnston D.M., Qian D., et al. Single-cell dissection of transcriptional heterogeneity in human colon tumors. Nat. Biotechnol. 2011;29:1120–1127. - PMC - PubMed
    1. Zhou J., Boutros M. Intestinal stem cells and their niches in homeostasis and disease. Cells Dev. 2023;175 - PubMed
    1. Shimokawa M., Ohta Y., Nishikori S., Matano M., Takano A., Fujii M., Date S., Sugimoto S., Kanai T., Sato T. Visualization and targeting of LGR5 human colon cancer stem cells. Nature. 2017;545:187–192. - PubMed

MeSH terms