. 2025 Jul 1;35(7):1621-1632.
doi: 10.1101/gr.279380.124.

Spatial domain detection using contrastive self-supervised learning for spatial multi-omics technologies

Affiliations

Spatial domain detection using contrastive self-supervised learning for spatial multi-omics technologies

Jianing Yao et al. Genome Res. .

Abstract

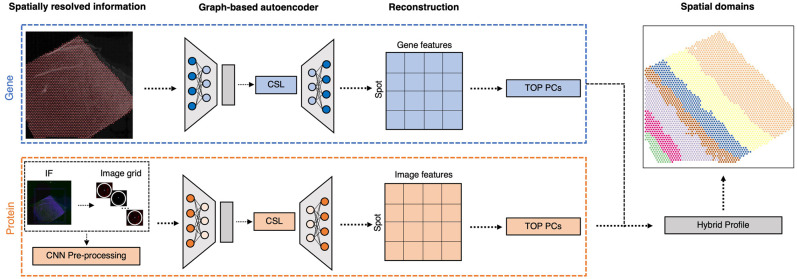
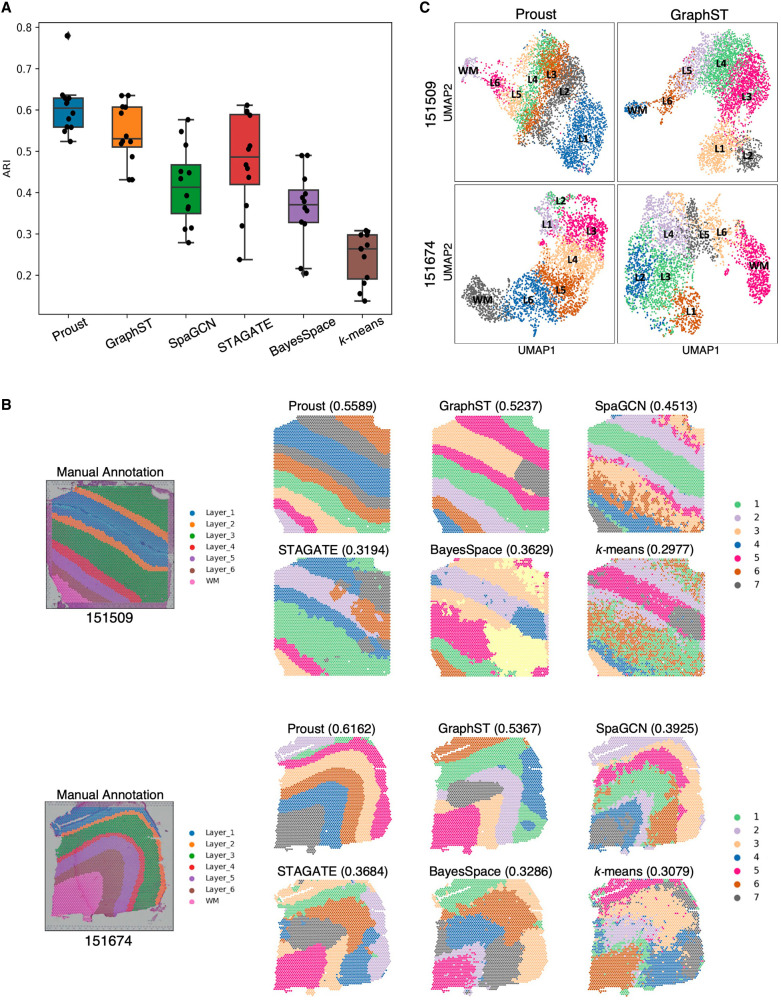
Recent advances in spatially resolved single-omic and multi-omics technologies have led to the emergence of computational tools to detect and predict spatial domains. Additionally, histological images and immunofluorescence (IF) staining of proteins and cell types provide multiple perspectives and a more complete understanding of tissue architecture. Here, we introduce Proust, a scalable tool to predict discrete domains using spatial multi-omics data by combining the low-dimensional representation of biological profiles based on graph-based contrastive self-supervised learning. Our scalable method integrates multiple data modalities, such as RNA, protein, and H&E images, and predicts spatial domains within tissue samples. Through the integration of multiple modalities, Proust consistently demonstrates enhanced accuracy in detecting spatial domains, as evidenced across various benchmark data sets and technological platforms.


Figures

Figure 1.
Figure 1.
Overview of Proust for detecting discrete domains using spatial multi-omics data. For the purposes of clarity, we introduce Proust with two specific omic data modalities—RNA and protein—but these ideas can be generalized to other multi-omics, such as RNA and brightfield images. First, Proust constructs a graph structure based on the Euclidean distance between spatial coordinates. Next, graph-based convolutional autoencoders are trained separately for gene expression and protein information extracted from an immunofluorescence (IF) image. The latent embeddings are refined using contrastive self-supervised learning (CSL). The top principal components (PCs) from the reconstructed gene and image features are concatenated to create a hybrid profile for downstream clustering analysis.
Figure 2.
Figure 2.
Proust improves the detection of hippocampal spatial domains in CK-p25 mouse coronal brain tissue by integrating gene expression with proteins of interest. (A) From left to right: annotation of mouse hippocampus subfields from the Allen Reference Brain Atlas; merged DAPI and γH2AX immunofluorescence images; and IF staining of γH2AX. (B) UMAP representation of spots colored by spatial domains detected by mclust using Proust's latent embeddings. (C) Predicted spatial domains by Proust, GraphST (Long et al. 2023), SpaGCN (Hu et al. 2021a), and STAGATE (Dong and Zhang 2022) with k = 20 domains. (D) Spatial expression level of four RM marker genes across the entire tissue slice and box plots of corresponding marker genes stratified by k = 20 domains identified by Proust. Hippocampal subregions are depicted in orange; other regions are depicted in gray.
Figure 3.
Figure 3.
Proust improves the accuracy of predicting spatial domains compared to existing methods. Data from sample Br6432 from Visium SPG human DLPFC data set (Huuki-Myers et al. 2024), unless noted otherwise. (A) Immunofluorescence images of five protein channels: nuclei (DAPI), neurons (RBFOX3 [also known as NeuN]), oligodendrocytes (OLIG2), astrocytes (GFAP), and microglia (TMEM119). (B) Box plot of Adjusted Rand Index (ARI) across four samples. (C) Manual annotation of tissue slice from donor Br6432 and predicted spatial domains by the six methods. Labels do not indicate corresponding biological layers assigned by the algorithms. (D) UMAP visualization of spots from donor Br6432 colored by Proust predictions. (E) Stacked violin plot of marker gene distribution for white matter and sublayers of gray matter based on literature in each spatial domain assigned by Proust. Red rectangles are highlighted marker genes in F. (F) Violin plots of marker gene expression for Proust and manually annotated domains. (G) Heat maps of the top five differentially expressed genes (centered and scaled) across layers from Proust and manual annotations. A dendrogram on the right shows hierarchical clustering. (H) Selected cluster-based marker genes expression and visualization of individual clusters identified by Proust. Layers were annotated according to the laminar organization indicated by the manual annotation.
Figure 4.
Figure 4.
Proust achieves distinct spatial domain detection with different protein channels and weights assigned to transcriptomics and proteomics on Visium SPG human inferior temporal cortex tissue slices from donor Br3880 and Br3854. (A) Immunofluorescence staining images of Aβ and pTau. (B) Proust clustering result using five protein channels (DAPI, Aβ, pTau, MAP2, and GFAP), top 30 PCs from reconstructed gene expression, top five PCs from reconstructed extracted image features, and k = 7 clusters. (C) Stacked violin plot of the distribution of marker genes (MOBP for oligodendrocytes/WM, SNAP25 for neurons/gray matter) in each spatial domain assigned by Proust. (D) Proust clustering result using two protein channels (Aβ and pTau). The first two columns show clustering results using transcriptomics only when k = 2 and k = 4 clusters, respectively. The last two columns show clustering results using a hybrid profile of transcriptomics and proteomics, with the top 10 PCs from reconstructed gene expression and the top 10 PCs from reconstructed extracted image features when k = 4 and k = 7 clusters, respectively.
Figure 5.
Figure 5.
Evaluating and comparing the performance of Proust in layer segmentation with other popular existing methods on the Visium human DLPFC data set that contains H&E images. (A) Box plot of clustering accuracy in 12 DLPFC samples across Proust and five other existing methods based on Adjusted Rand Index (ARI). (B) Manual annotation of tissue slices 151,509 and 151,674 and spatial domains assigned by the six methods. (C) UMAP visualization of reduced dimensions from Proust and GraphST for 151,509 and 151,674.

Update of

Similar articles

Cited by

References

    1. Alexandrov T. 2023. Spatial metabolomics: from a niche field towards a driver of innovation. Nat Metab 5: 1443–1445. 10.1038/s42255-023-00881-0 - DOI - PubMed
    1. Asp M, Giacomello S, Larsson L, Wu C, Fürth D, Qian X, Wärdell E, Custodio J, Reimegård J, Salmén F, et al. 2019. A spatiotemporal organ-wide gene expression and cell atlas of the developing human heart. Cell 179: 1647–1660.e19. 10.1016/j.cell.2019.11.025 - DOI - PubMed
    1. Bradski G. 2000. The OpenCV Library. Dr Dobb's Journal of Software Tools 25: 120–123.
    1. Chen WT, Lu A, Craessaerts K, Pavie B, Sala Frigerio C, Corthout N, Qian X, Laláková J, Kühnemund M, Voytyuk I, et al. 2020. Spatial transcriptomics and in situ sequencing to study Alzheimer's disease. Cell 182: 976–991.e19. 10.1016/j.cell.2020.06.038 - DOI - PubMed
    1. Denisenko E, De Kock L, Tan A, Beasley AB, Beilin M, Jones ME, Hou R, Muirí DÓ, Bilic S, Mohan GRKA, et al. 2024. Spatial transcriptomics reveals discrete tumour microenvironments and autocrine loops within ovarian cancer subclones. Nat Commun 15: 2860. 10.1038/s41467-024-47271-y - DOI - PMC - PubMed

LinkOut - more resources