. 2025 May 20;16(1):4422.
doi: 10.1038/s41467-025-59661-x.

Whole genome sequencing improves tissue-of-origin diagnosis and treatment options for cancer of unknown primary

Affiliations

Whole genome sequencing improves tissue-of-origin diagnosis and treatment options for cancer of unknown primary

Richard J Rebello et al. Nat Commun. .

Abstract

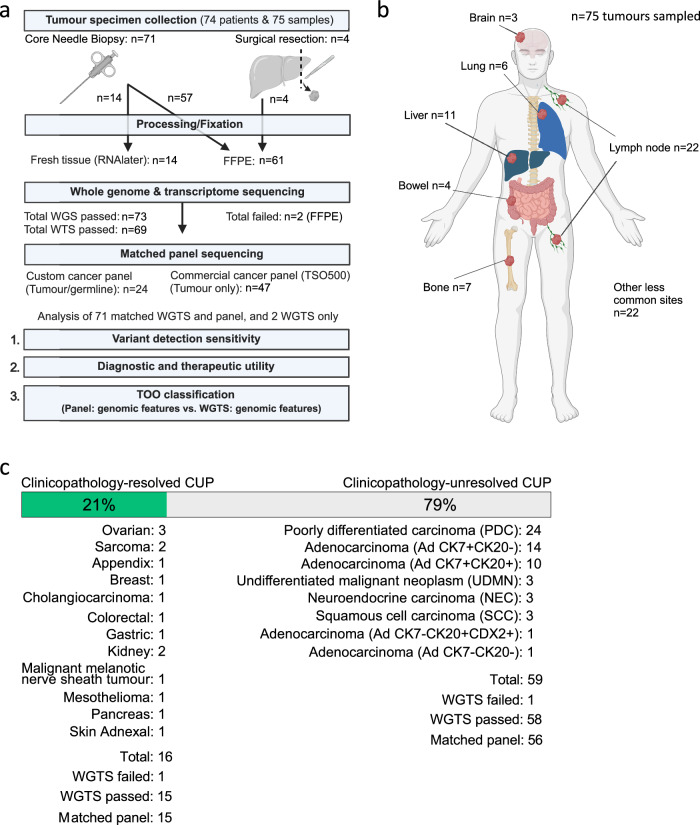
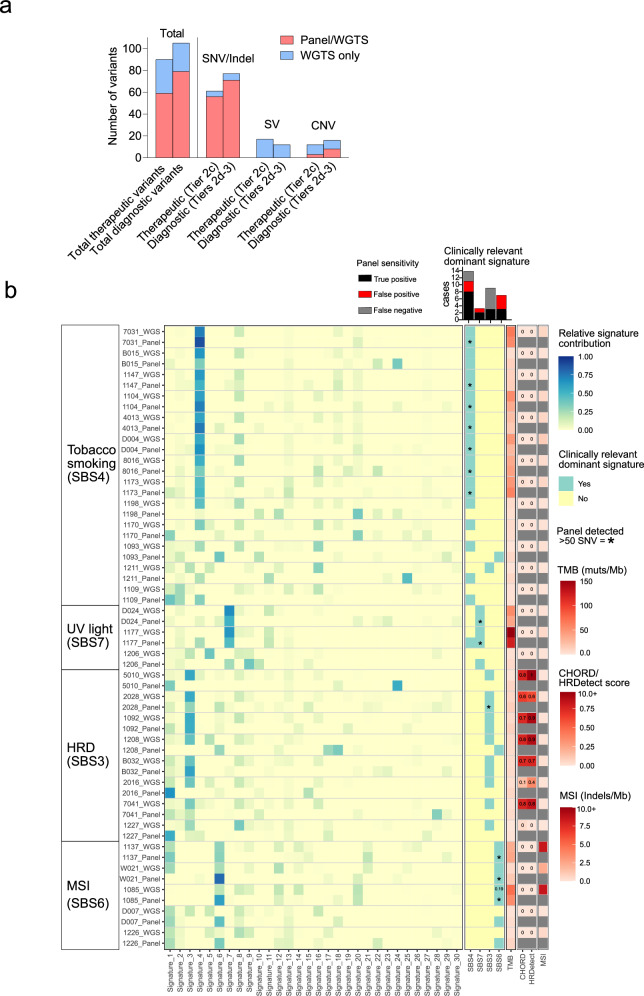
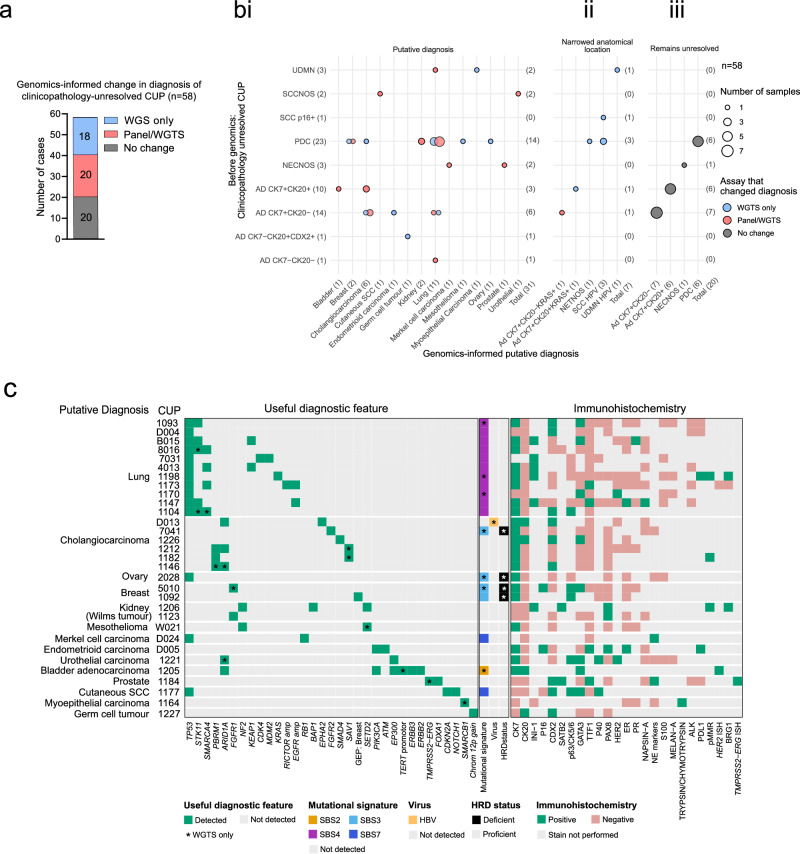
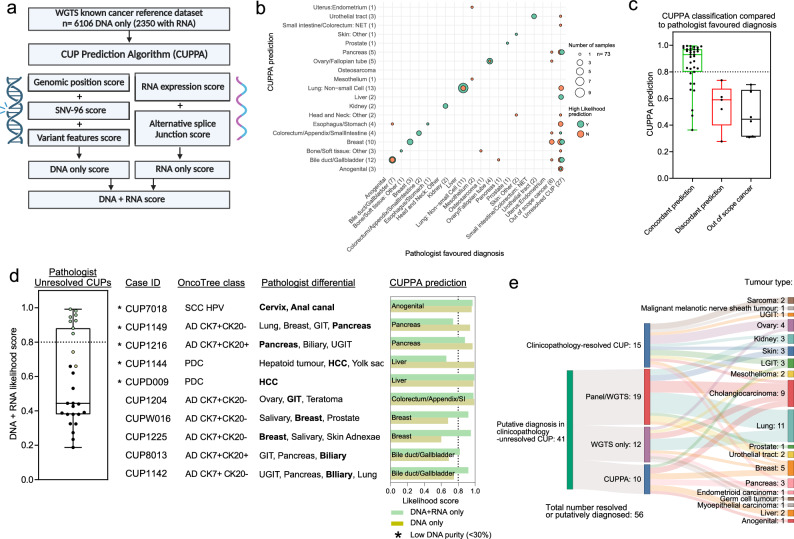
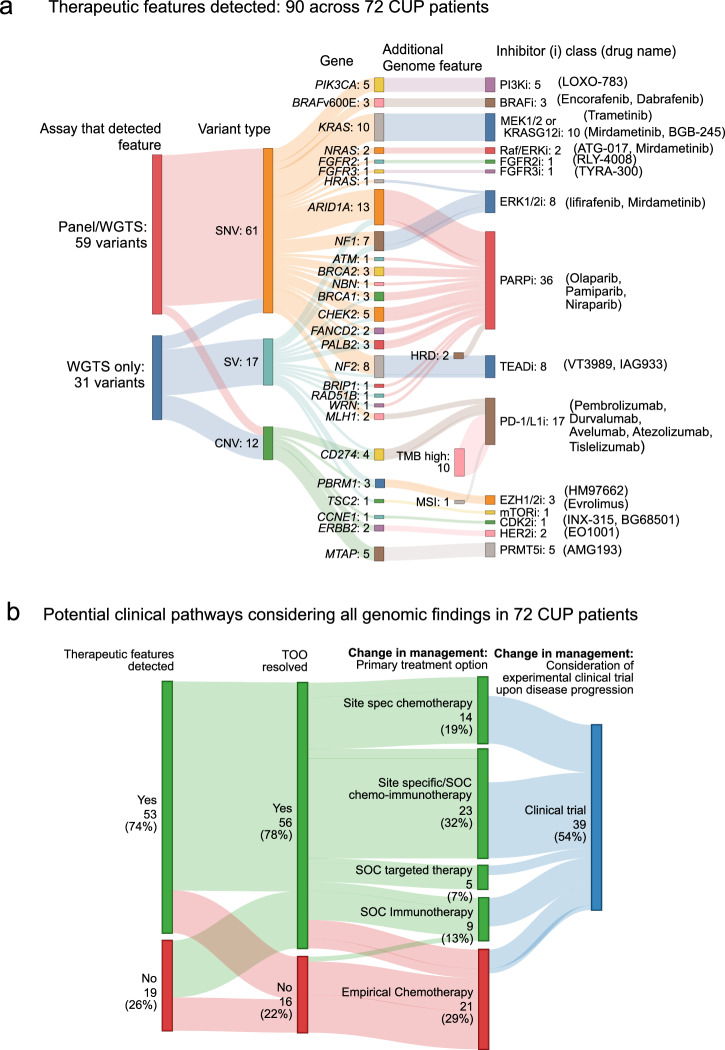
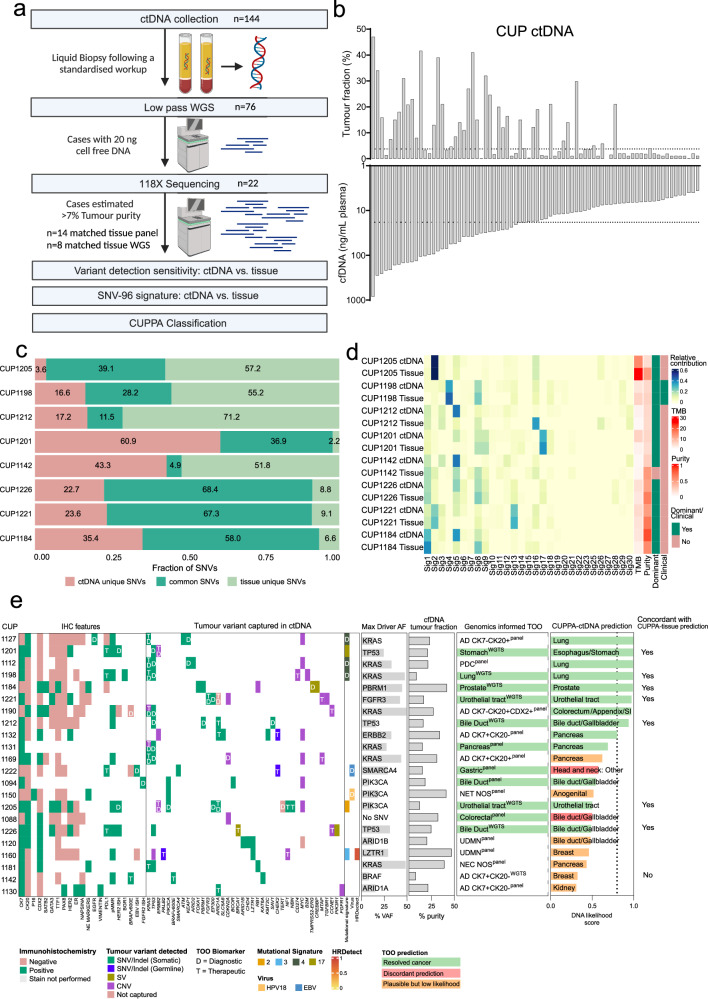
Genomics can inform both tissue-of-origin (TOO) and precision treatments for patients with cancer of unknown primary (CUP). Here, we use whole genome and transcriptome sequencing (WGTS) for 72 patients and show diagnostic superiority of WGTS over panel testing (386-523 genes) in 71 paired cases. WGTS detects all reportable DNA features found by panel as well as additional mutations of diagnostic or therapeutic relevance in 76% of cases. Curated WGTS features and a CUP prediction algorithm (CUPPA) trained on WGTS data of known cancer types informs TOO in 71% of cases otherwise undiagnosed by clinicopathology review. WGTS informs treatments for 79% of patients, compared to 59% by panel testing. Finally, WGS of cell-free DNA (cfDNA) from patients with a high cfDNA tumour fraction (>7%), enables high-likelihood CUPPA predictions in 41% of cases. WGTS is therefore superior to panel testing, broadens treatment options, and is feasible using routine pathology samples and cfDNA.


Conflict of interest statement

Competing interests: All authors declare no competing interests.

Figures

Fig. 1
Fig. 1. Selection of cancer of unknown primary cases for WGTS.
a Flow chart of CUP cases profiled in this study. Fresh or FFPE tumour samples were either diagnostic core needle biopsies or surgical resections accessed from pathology archives. Seventy-five samples from 74 CUP patients had WGTS performed, where 73 WGS and 69 WTS were successful. Seventy-one of these had matched panel sequencing: 24 using a custom cancer panel and 47 a commercial cancer panel. Created in BioRender. (License: Tothill, R. (2025) https://BioRender.com/h69j379). b Seventy-five tumours were sampled from a range of anatomical sites for molecular profiling in 74 CUP patients. Non-recurrent sites were combined as ‘other less common sites’. Created in BioRender. (License: Tothill, R. (2025) https://BioRender.com/r31l964). c Fraction of CUP tumours clinicopathology-resolved or clinicopathology-unresolved pre-genomic testing, after a centralised pathology review. Clinicopathology-unresolved CUPs were categorised based on a modified MSKCC OncoTree classification. Source data are provided as a Source Data file.
Fig. 2
Fig. 2. Detection of therapeutic and diagnostic mutational features in CUP using WGTS and panel.
a Total number of therapeutic and diagnostic variants in CUP cases detected in both matched panel and WGTS or by WGTS only (n = 73 tumours). Variants are also categorised by type (SNV/Indel, SV and CNV). b Schematic showing comparison of SNV-96 SBS mutational signatures where a dominant SBS signature was found by WGS and there was matched panel data (COSMICv2, n = 29/73). Number of cases with dominant SBS signatures(SBS4, SBS7, SBS3 and SBS6) that are true positive, false positive or false negative as determined by panel using matched WGS data as a known truthare shown in the histogram. Asterisks (*) represent cases with greater than 50 somatic SNVs that were detected by panel. TMB (muts/Mb), HRD (HRDetect and CHORD tools) and MSI (Indels/Mb) scores from WGS data are presented alongside for each case. Source data are provided as a Source Data file.
Fig. 3
Fig. 3. WGTS features aid clinicopathology work up of CUP patients.
a Number of clinicopathology-unresolved CUP tumours that had a genomics-informed change in diagnosis due to panel or additional WGTS features. (n = 58). b Bubble chart showing clinicopathology-unresolved CUPs categorised by MSKCC OncoTree cancer classification before and after panel and WGTS. (n = 58). Post-sequencing, tumours are grouped as: (i) putative diagnosis (n = 31), (ii) narrowed anatomical differential (n = 7), or (iii) remains unresolved (n = 20) and are colour coded by the assay that changed their diagnosis. c Schematic of all putatively diagnosed clinicopathology-unresolved CUPs grouped by favoured cancer type showing useful diagnostic molecular features, including mutational signatures and viral DNA, in addition to immunohistochemical features. (n = 31). Source data are provided as a Source Data file.
Fig. 4
Fig. 4. Application of CUPPA to aid TOO diagnosis.
a Schematic representation of CUPPA that classifies CUP samples toward one of 36 defined cancer types by using a large reference dataset of known cancers. CUPPA (version 1.4) calculates five orthogonal variant feature scores for each class: three that are combined into an overall DNA score and two that combine into an overall RNA score. A combined DNA + RNA score is used for tissue samples when tumour fraction determined by WGS is ≥30%, otherwise, DNA-only classification is used. Created in BioRender. (License: Tothill, R. (2025) https://BioRender.com/w69c793). b Confusion matrix of CUPPA prediction scores against a pathologist’s favoured diagnosis, limited to CUPPA classes, colour coded by high (≥0.8) or low (<0.8) likelihood, where out of scope and yet unresolved tumours are separate categories. (n = 73). c Box plot showing CUPPA prediction scores using classification toward a single site TOO prediction, categorised by concordance with a genomics-informed, but CUPPA-blinded, pathology review (concordant n = 35, discordant n = 5). Cases with a favoured origin not represented in CUPPA training data were separated into a third group: out of scope cancer (n = 6). Whiskers indicate the minima and maxima, the centre lines represent the median, the box upper and lower bounds represent the 75th and 25th percentile, respectively. d Box plot of unresolved CUPs (n = 27) and schematic of ten of these CUP samples that were resolved with CUPPA and their high-likelihood (DNA + RNA or DNA only) predicted CUPPA classes. Whiskers indicate the minima and maxima, the centre lines represent the median, the box upper and lower bounds represent the 75th and 25th percentile, respectively. Bold tumour types in the pathologist differential are concordant with the CUPPA prediction. e Sankey plot of all CUP tumours (n = 56/73) with a resolved or putative diagnosis flowing toward the method by which they were resolved and cancer type. Source data are provided as a Source Data file.
Fig. 5
Fig. 5. Using therapeutic features and TOO predictions to change clinical management for CUP patients.
a Sankey plot showing all therapeutic features captured in matched panel and WGTS or WGTS only assays (n = 73 CUP tumours from 72 patients), separated by variant type and gene or genome wide feature, flowing to eligible inhibitor (drug class and name). b Sankey plot of 72 CUP patients showing the number and proportion (% of total) that had one or more therapeutic features detected, whether a putative TOO was assigned and whether a SOC treatment and/or clinical trial could be considered to gain access to treatment. Source data are provided as a Source Data file.
Fig. 6
Fig. 6. Utility of cfDNA for WGS and TOO prediction.
a Flow chart diagram showing the workflow for WGS of cfDNA from CUP patients. Created in BioRender. (Licence: Tothill, R. (2025) https://BioRender.com/v92f950.) b CfDNA yield per mL of blood plasma and ctDNA tumour fraction estimates calculated by the ichorCNA method across 76 patients. Dotted lines demarcate median tumour fraction at 7% and cfDNA content of 18.3 ng, respectively. c Bar graph showing distribution of unique or common SNVs in eight cases with matched ctDNA and tissue WGS. d SNV-96 mutational signatures (COSMICv2) across 8 cases with matched ctDNA and tissue WGS. Tumour fraction (ichorCNA estimated), TMB, and the presence or absence of a dominant signature (greater than 20% abundance) or diagnostic/therapeutically relevant signature are shown alongside for each sample. e Schematic of the 22 CUP-cfDNA cases showing immunohistochemistry profiles of matched biopsied tissues alongside known genomic features from the tumour that were detected in cfDNA-WGS data. Percentage known driver variant allele frequencies (VAF) and ichorCNA estimated ctDNA fraction for each sample are shown alongside. CUPPA predictions from cfDNA-WGS data are shown alongside for each case, as well as whether tissue and cfDNA CUPPA DNA-only predictions were concordant. Source data are provided as a Source Data file.

Similar articles

Cited by

References

    1. Kramer, A. et al. Cancer of unknown primary: ESMO Clinical Practice Guideline for diagnosis, treatment and follow-up. Ann. Oncol.34, 228–246 (2023). - PubMed
    1. Rassy, E. & Pavlidis, N. The currently declining incidence of cancer of unknown primary. Cancer Epidemiol.61, 139–141 (2019). - PubMed
    1. Sivakumaran, T., Tothill, R. W. & Mileshkin, L. R. The evolution of molecular management of carcinoma of unknown primary. Curr. Opin. Oncol.36, 456–464 (2024). - PubMed
    1. Kramer, A., et al. Molecularly guided therapy versus chemotherapy after disease control in unfavourable cancer of unknown primary (CUPISCO): an open-label, randomised, phase 2 study. Lancet404, 527–539 (2024). - PubMed
    1. Hyman, D. M. et al. Vemurafenib in multiple nonmelanoma cancers with BRAF V600 mutations. N. Engl. J. Med.373, 726–736 (2015). - PMC - PubMed

Substances

LinkOut - more resources