. 2025 May 20;16(1):4697.
doi: 10.1038/s41467-025-58322-3.

ACSS2 mediates an epigenetic pathway to regulate β-cell adaptation during gestation in mice

Affiliations

ACSS2 mediates an epigenetic pathway to regulate β-cell adaptation during gestation in mice

Yu Zhang et al. Nat Commun. .

Abstract

Maternal pancreatic β-cells undergo adaptive changes to meet the metabolic demands of pregnancy, and disruptions in this adaptation can lead to gestational diabetes mellitus. However, the mechanisms governing this adaptation remain largely unexplored. Using single-cell transcriptome combined with genetic analyses, we identified a precise process of β-cell adaptation in mice, characterized by progressive metabolic stress-related β-cell dysfunction, increased acetyl-CoA biosynthesis, and gene element-specific histone acetylation. STAT3 recruits p300 to promote histone acetylation of pregnancy-associated genes, a process enhanced by Acetyl-CoA Synthetase 2 (ACSS2). High-fat feeding induces hyperacetylation of chromatin regions specifically opened during pregnancy, leading to the overexpression of genes that impair β-cell function. However, these impairments can be rescued by β-cell-specific deletion of Acss2. Notably, ACSS2 is functionally implicated in the early establishment of β-cell adaptation in HFD-fed mice but does not appear to play a role in standard diet-fed mice until after the initiation of adaptation. Our study uncovers a finely regulated β-cell adaptation process at the single-cell level during pregnancy and identifies a specific epigenetic pathway that governs this process. These findings provide insights into β-cell plasticity and potential therapeutic strategies for gestational diabetes mellitus.


Conflict of interest statement

Competing interests: The authors declare no competing interests.

Figures
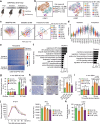
Fig. 1
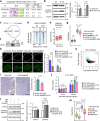
Fig. 1. β-cell adaptation process during pregnancy at the single-cell level.
a Schematic workflow for Smart-seq3 scRNA-seq on β-cells from virgin, pregnant, and postpartum mice. Illustration created with BioRender (BioRender.com/r42u304). b t-SNE plots showing the cell cluster (left) and cell source (right) of β-cells. Each dot represents a single cell. Cell group and source are color coded. Cell counts are denoted within brackets. c PCA plot of Glut2high β-cells identified in panel (b) (left). Each dot represents the gravity center for the distribution of cell for each source (circled) (middle and right). d, Box scatter plots showing the cells in each Glut2high β-cell population at different times during pregnancy, arranged by pseudotime value. Box plots display the median (middle line), 25th-75th percentiles (box), whiskers extending 1.5 times the interquartile range from the edges, minimum and maximum values at whisker ends. Biological replicates of different times refer to Supplementary Fig. 2d. e Heatmap showing the variably expressed genes identified in Glut2high β-cells. Each column represents a single cell, ordered by pseudotime value. Each row represents a gene. The color scheme is the same as in panel (b). f Representative enriched GO and KEGG terms in gene clusters identified in panel (e). One-sided Kolmogorov-Smirnov test. FDR: false discovery rate. g In vitro GSIS levels of Ins1-RFP+ β-cells in mouse pancreatic islets. p.d.u. represents procedure-defined unit. h, Immunohistochemistry for insulin (brown) shows β-cell area in pancreatic sections (left). Scale bar = 1 mm. Statistics of the β-cell mass in each mouse pancreas (right). Eight sections at 100 μm intervals were measured for each pancreas sample. i, In vivo GSIS levels of mice before and 30 min after glucose injection. j, IP-GTT levels in fasted mice after glucose injection (left). Quantification of the areas under the curve (AUC) (right). k, Fasting (0 min.) blood glucose levels of mice in panel (j). Data in (g–k) are presented as mean ± SEM, and an unpaired two-tailed t-test was used to compare two groups. The numbers in the plot indicate the p-value. n represents the number of mice. Source data (g–k) are provided as a Source Data file.
Fig. 2
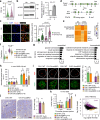
Fig. 2. Dynamics of histone acetylation in β-cells during pregnancy.
a Quantification of relative acetyl-CoA levels in islets from G0 and G14.5 mice measured by LC‒MS/MS. n indicates the number of biological replicates. b, Western blot images of islets from G0 and G14.5 mice obtained using the conventional Western blotting approach (left). Quantification of Western blot signals calculated by ImageJ software (right). c, d Comparison of genome-wide H3K27ac (c) or ATAC-seq (d) levels between G0 and G14.5 β-cells. The number of dots represents significantly increased signals of H3K27ac CUT&RUN (c) or ATAC-seq (d) peaks in G14.5 (red) and G0 (blue) β-cells. p-value ≤ 0.05 (c). p value ≤ 0.2 (d). Two-sided moderated t-test. e Signal intensity of H3K27ac, H3K4me1, and ATAC-seq at the enhancer elements (left) or the promoter elements (right) of cluster-a genes (upper) or cluster-b genes (bottom) (see Fig. 1e) in G0, G14.5, and P7-NL β-cells. Paired two-sided Wilcoxon rank-sum test. Box plots display the median (middle line), 25th−75th percentiles (box), whiskers extending 1.5 times the interquartile range from the edges, minimum and maximum values at whisker ends. 2 biological replicates were performed (refer to Supplementary Fig. 4c). Data in (a, b) are presented as mean ± SEM, and an unpaired two-tailed t-test was used to compare two groups. n indicates the number of biological replicates. The numbers in the plot indicate p-value. Source data (a, b) are provided as a Source Data file.
Fig. 3
Fig. 3. The histone acetyltransferase p300 promotes β-cell adaptation.
a Composite plots (upper) and signal intensity (bottom) of p300 CUT&RUN in the promoter and enhancer regions in G0, G14.5, and P7-NL β-cells. b Overlap of p300 and H3K27ac binding sites in β-cells from distinct time points. c Islet morphology before and after culture under different conditions. Scale bar = 100 μm. A485 concentration: 5 μM. MS represents human maternal serum from women in the third trimester ( > 28 weeks), and NS represents normal serum from age-matched women. 3 biological replicates were performed. d PCA plot showing the cultured single β-cells projected onto the plot in Fig. 1c. Each dot represents a single cell. The circles and triangles represent independent biological replicates. rep: biological replicates. e Box scatter plots showing β-cells cultured under different conditions arranged by pregnancy-associated pseudotime values. Each dot represents a single cell. Unpaired two-sided Wilcoxon rank-sum test. f Immunostaining of Ki67 and insulin expression in islet cells after 4 days of culture (left). Scale bar = 100 μm. Quantification of the percentage of Ki67+insulin+ cells among all insulin+ β-cells (right). n represents the biological replicates. More than 1,000 insulin+ cells were counted for each replicate. g Schematic of the workflow for the generation of pregnant p300βKO mice. TAM tamoxifen. h, Box scatter plots showing β-cells from different mouse samples arranged by pseudotime values. Unpaired two-sided Wilcoxon rank-sum test. i Immunofluorescence images of Ki67 and PDX1 in pancreatic tissue sections (left). Scale bar = 50 μm. Quantification of Ki67+PDX1+ cells among all PDX1+ β-cells in each tissue (right). n represents the number of mice. Box plots in (e, h) display the median (middle line), 25th−75th percentiles (box), whiskers extending 1.5 times the interquartile range from the edges, minimum and maximum values at whisker ends. Data in (f, i) are presented as mean ± SEM, and an unpaired two-tailed t-test was used to compare two groups. Source data (f, i) are provided as a Source Data file.
Fig. 4
Fig. 4. STAT3 interacts with p300 to regulate β-cell adaptation during pregnancy.
a Top three motifs enriched at the putative enhancers with increased H3K27ac marks in G14.5 β-cells compared to G0 β-cells. b Immunoblot assays of Ins1-RFP+ β-cells (left). Quantification of Western blot signals (right). c, Overlap of STAT3 and p300 binding sites in G14.5 β-cells. d Composite plots (upper) and signal intensity (bottom) of p300 at 2,888 STAT3 cobinding sites in (c) with increased p300 levels at G14.5 (fold change ≥ 1.2). e Signal intensities of H3K27ac at the loci in (d). Paired two-sided Wilcoxon rank-sum test. f, Western blots of p300 immunoprecipitation eluates from G14.5 islets. 3 biological replicates were performed. g Box scatter plots showing β-cells arranged by pseudotime values. h Immunofluorescence images of Ki67 and PDX1 in pancreas (left). Scale bar = 50 μm. Quantification of Ki67+PDX1+ cells in all PDX1+ β-cells (right). i Immunohistochemistry for insulin (brown) shows β-cell area in pancreatic section (left). Scale bar = 1 mm. Statistics of the β-cell mass in each pancreas (right). j, In vivo GSIS levels of mice before and after glucose injection. k Comparison of H3K27ac levels between G18.5 WT and G18.5 Stat3βKO β-cells. Cyan and pink dots represent the peaks with decreased and increased H3K27ac levels in G18.5 Stat3βKO β-cells compared to G18.5 WT β-cells, respectively (p-value ≤ 0.2). Two-sided moderated t-test. l, Immunoblot assays of Ins1-RFP+ β-cells from islets cultured under different conditions (left). Quantification of Western blot signals (right). Prolactin concentration: 500 ng/mL. m, Box scatter plots showing β-cells cultured under different conditions arranged by pregnancy-associated pseudotime values. Nif: nifuroxazide. Box plots in (e, g, m) display the median (middle line), 25th−75th percentiles (box), whiskers extending 1.5 times the interquartile range from the edges, minimum and maximum values at whisker ends, unpaired two-sided Wilcoxon rank-sum test was used. n represents the number of mice (h-i) or the biological replicates (b, 1). Data in (b, h–j, l) are presented as mean ± SEM, unpaired two-tailed t-test was used. n represents biological replicates. Source data (b, h, i, j, l) are provided as a Source Data file.
Fig. 5
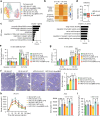
Fig. 5. ACSS2 promotes β-cell adaptation by regulating histone acetylation.
a Violin plots showing the expression level of Acss2 in β-cells. The black line within each violin plot indicates the median expression level. Unpaired two-sided Wilcoxon rank-sum test. b Immunoblot assays of Ins1-RFP+ β-cells (left). Quantification of Western blot signals (right). c Immunofluorescence images of ACSS2, insulin, and glucagon expression in islet cells (left). Scale bar = 50 μm. Statistical analysis of the relative fluorescence intensity (RFI) of ACSS2 in both the cytoplasm (C) and nucleus (N) of insulin+ β-cells (right). d Schematic representation of the generation strategy of an Acss2-flox mouse strain. e Heatmap showing the expression patterns of the differentially expressed genes between G18.5 WT and G18.5 Acss2βKO β-cells (Supplementary Fig. 9e) in four cell populations. Unpaired two-sided Wilcoxon rank-sum test. f Box scatter plots showing β-cells arranged by pseudotime values. Box plots display the median (middle line), 25th−75th percentiles (box), whiskers extending 1.5 times the interquartile range from the edges, minimum and maximum values at whisker ends. Unpaired two-sided Wilcoxon rank-sum test. g Representative GO terms of upregulated and downregulated genes identified in f. Two-sided hypergeometric test. h, In vitro GSIS levels of Ins1-RFP+ β-cells in mouse pancreatic islets. i Immunofluorescence images of Ki67 and PDX1 expression in (left). Scale bar = 50 μm. Quantification of Ki67+PDX1+ cells in all PDX1+ β-cells (right). j Immunohistochemistry for insulin (brown) shows β-cell area in pancreatic sections (left). Scale bar = 1 mm. Statistics of the β-cell mass in each mouse pancreas (right). k In vivo GSIS levels of mice before and after glucose injection. l Comparison of genome-wide H3K27ac levels between G18.5 WT and G18.5 Acss2βKO β-cells. The purple (2,462 peaks) and brown (1,057 peaks) dots represent the peaks with decreased and increased H3K27ac levels in G18.5 Acss2βKO β-cells compared to G18.5 WT β-cells, respectively (p value ≤ 0.2). Two-sided moderated t-test. Data in (b, c, hk) are presented as mean ± SEM, unpaired two-tailed t test. n represents the number of mice. Source data (b, c, h–k) are provided as a Source Data file.
Fig. 6
Fig. 6. HFD increases metabolic stress in β-cells during pregnancy.
a IP-GTT levels in fasted mice after glucose injections (left). Quantification of the areas under the curve (AUCs) (right). b UMAP plot showing β-cells from different mouse samples. Each point represents a single cell. c Selected GO terms enriched among the 412 upregulated genes in HFD G14.5 β-cells (refer to Supplementary Fig. 10f). Two-sided hypergeometric test. d, Immunofluorescence images of Ki67 and PDX1 expression in pancreatic tissue sections. Scale bar = 50 μm. e Quantification of the percentage of Ki67+PDX1+ cells among all PDX1+ β-cells in each section. More than seven islets and 1,000 PDX1+ cells were counted for each pancreas sample. f, Heatmap showing the hierarchical clustering of ATAC-seq signal intensity related to 412 genes highly expressed in HFD G14.5 β-cells (refer to Supplementary Fig. 10f). g Box plots of the ATAC-seq signal intensity of the 3 clusters identified in panel f. Box plots display the median (middle line), 25th−75th percentiles (box), whiskers extending 1.5 times the interquartile range from the edges, minimum and maximum values at whisker ends. Paired two-sided Wilcoxon rank-sum test. h Comparison of genome-wide H3K27ac levels between G14.5 SD and G14.5 HFD β-cells. Each dot represents an H3K27ac CUT&RUN peak. The blue and pink dots represent the peaks with increased and decreased H3K27ac levels in HFD G14.5 β-cells compared to SD G14.5 β-cells, respectively (p value ≤ 0.1). Two-sided moderated t-test. i, Violin plots showing the expression levels of Acss2 in β-cells from different mouse samples. The black line within each violin plot indicates the median expression level. Each point represents a single cell. Unpaired two-sided Wilcoxon rank-sum test. Data in (a, e) are presented as mean ± SEM, and unpaired two-tailed t test was used to compare two groups. n represents the number of mice. Source data (a, e) are provided as a Source Data file.
Fig. 7
Fig. 7. ACSS2 deficiency rescues HFD-induced β-cell dysfunction during pregnancy.
a UMAP plot showing β-cells from different mouse samples. Each point in represents a single cell. b Heatmap showing clusters of a combination of pairwise DEGs among G14.5 SD WT, G14.5 HFD WT, and G14.5 HFD Acss2βKO β-cells (p-adjust ≤ 0.01, fold change ≥ 1.5). Unpaired two-sided Wilcoxon rank-sum test. c Representative GO terms enriched among the 3 cluster genes in panel (b). Two-sided hypergeometric test. d, Box plots showing the signal intensity of H3K27ac CUT&RUN at the loci of increased H3K27ac levels in WT G14.5 HFD compared to WT G14.5 SD β-cells in Fig. 6h. Box plots display the median (middle line), 25th−75th percentiles (box), whiskers extending 1.5 times the interquartile range from the edges, minimum and maximum values at whisker ends. Paired two-sided Wilcoxon rank-sum test. 2 Biological replicates were performed (Supplementary Fig. 10h). e In vitro GSIS levels of Ins1-RFP+ β-cells in mouse pancreatic islets. f Immunohistochemistry for insulin (brown) showing β-cell area in pancreatic section (left). Scale bar = 1 mm. Statistics of the β-cell mass in mouse pancreas (right). Eight sections at 100 μm intervals were measured for each pancreas sample. g In vivo GSIS levels of mice before and after glucose injection. h IP-GTT levels in fasted mice after glucose injections (left). Quantification of the areas under the curve (AUCs) (right). i, Fasting (0 min.) blood glucose levels of mice in panel (h). Data in (e-i) are presented as mean ± SEM, and unpaired two-tailed t test was used to compare two groups. n represents the number of mice. Source data (e, f, g–i) are provided as a Source Data file.
Fig. 8
Fig. 8. Work models of ACSS2 mediating an epigenetic pathway to regulate β-cell adaptation during pregnancy.
a Transcriptional profiling, epigenetics, and genetic mouse models are utilized to dissect the processes and molecular features of β-cell adaptation during pregnancy. b ACSS2 promotes the increase of acetyl-CoA levels, leading to enhanced histone acetylation and activation of pregnancy-associated genes. This supports β-cell adaptation and function during pregnancy. c Under HFD conditions, ACSS2 activity results in hyperacetylation of chromatin and overexpression of metabolic stress-related genes, causing β-cell dysfunction. Illustration created with BioRender (BioRender.com/b01i949).

References

    1. Sferruzzi-Perri, A. N., Lopez-Tello, J., Napso, T. & Yong, H. E. J. Exploring the causes and consequences of maternal metabolic maladaptations during pregnancy: lessons from animal models. Placenta98, 43–51 (2020). - PMC - PubMed
    1. Banerjee, R. R. Piecing together the puzzle of pancreatic islet adaptation in pregnancy. Ann. N. Y Acad. Sci.1411, 120–139 (2018). - PubMed
    1. Brănişteanu, D. D. & Mathieu, C. Progesterone in gestational diabetes mellitus: guilty or not guilty? Trends Endocrinol. Metab.14, 54–56 (2003). - PubMed
    1. Chiefari, E., Arcidiacono, B., Foti, D. & Brunetti, A. Gestational diabetes mellitus: an updated overview. J. Endocrinol. Investig.40, 899–909 (2017). - PubMed
    1. Park, S. & Kim, S. H. Gestational diabetes is associated with high energy and saturated fat intakes and with low plasma visfatin and adiponectin levels independent of prepregnancy BMI. Diabetes62, A361–A361 (2013). - PubMed

MeSH terms

LinkOut - more resources