. 2025 May 20;16(1):4703.
doi: 10.1038/s41467-025-59682-6.

Chromogranin A deficiency attenuates tauopathy by altering epinephrine-alpha-adrenergic receptor signaling in PS19 mice

Affiliations

Chromogranin A deficiency attenuates tauopathy by altering epinephrine-alpha-adrenergic receptor signaling in PS19 mice

Suborno Jati et al. Nat Commun. .

Abstract

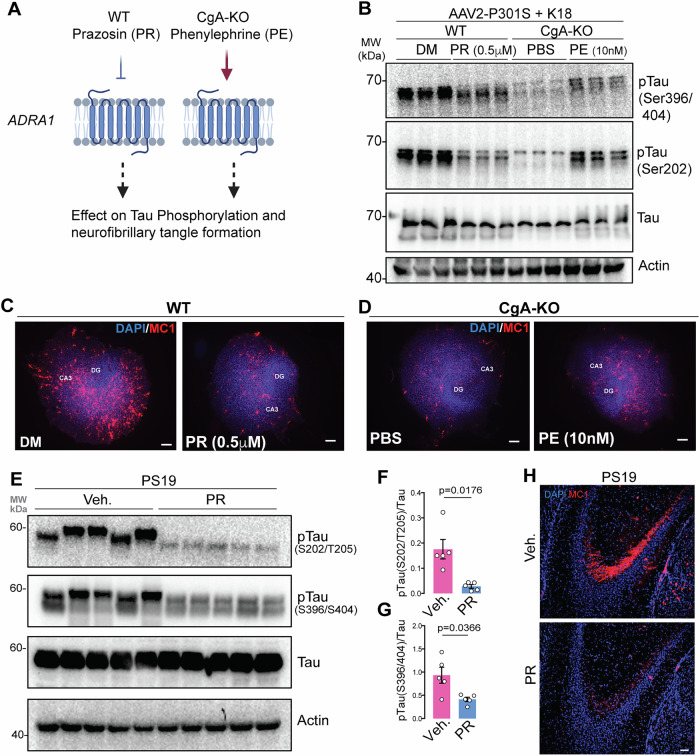
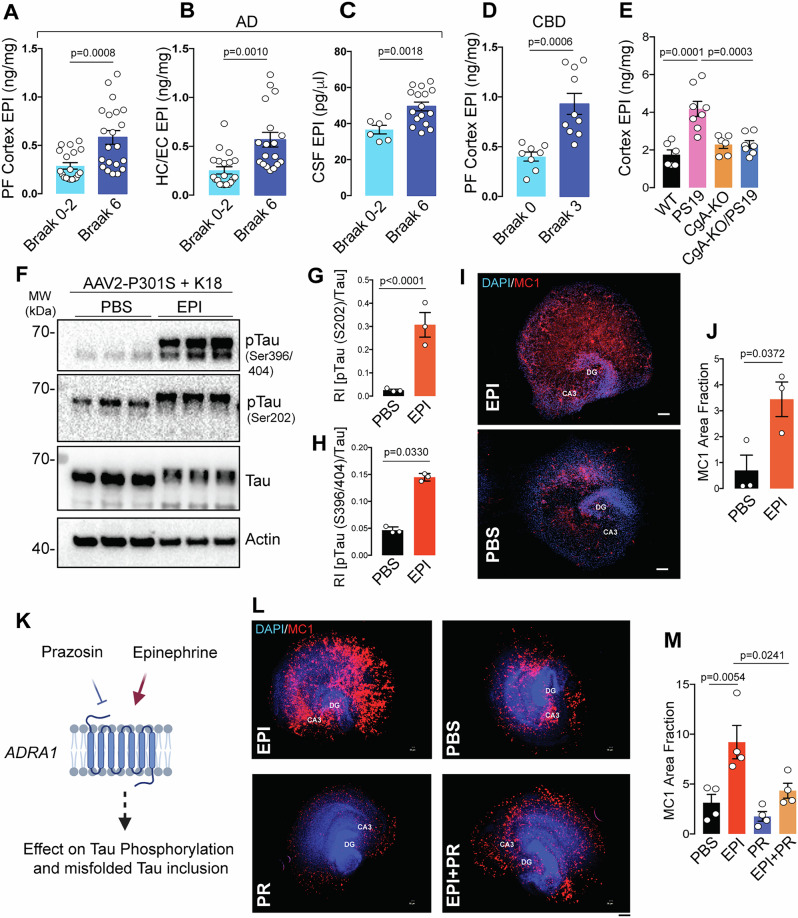
Metabolic disorders such as insulin resistance and hypertension are potential risk factors for aging and neurodegenerative diseases. These conditions are reversed in Chromogranin A (CgA) knockout (CgA-KO) mice. CgA is known to be associated with protein aggregates in the brains of neurodegenerative diseases including Alzheimer's disease (AD). Here, we investigated the role of CgA in Tau pathogenesis in AD and corticobasal degeneration (CBD). CgA ablation in Tauopathy mice (PS19) (CgA-KO/PS19) reduced pathological Tau aggregation and spreading, extended lifespan, and improved cognitive function. Transcriptomic and metabolite analysis of mouse cortices revealed elevated alpha-1-adrenergic receptors (Adra1) expression and high Epinephrine (EPI) levels in PS19 mice compared to WT mice, mirroring observations in AD and CBD patients. CgA depletion in PS19 mice lowered cortical EPI levels and the expression of Adra1 back to normal. Treatment of WT hippocampal organotypic slice cultures with EPI or Adra1 agonist promoted, while an Adra1 antagonist inhibited Tau hyperphosphorylation and formation of neurofibrillary tangles, which is unaltered upon CgA depletion. These findings demonstrate the involvement of CgA in Tau pathogenesis and highlight the interplay between the EPI-Adra1 signaling pathway and CgA in Tauopathy.


Conflict of interest statement

Competing interests: S.K.M. is the founder of CgA Therapeuticals, Inc. GG and SKM are the founders of Siraj Therapeutics. I.L. is a member of the Scientific Advisory Board for the Rossy PSP Program at the University of Toronto, Aprinoia, Amydis, and the Food and Drug Administration (FDA) Peripheral and Central Nervous System Drugs Advisory Committee. She receives her salary from the University of California, San Diego, and as Chief Editor of Frontiers in Neurology. The remaining authors declare no competing interests.

Figures

Fig. 1
Fig. 1. Augmented CgA protein levels in AD and CBD patient samples and PS19 transgenic mice.
A Representative Western blot (WB) of postmortem frontal cortex extracts showing levels of CgA, p-Tau, total Tau and Actin in six Braak stage 6 (Brk 6) and Braak stage 0-2 (Brk 0-2) postmortem patient frontal cortex lysates. B Representative WB of hippocampus extracts showing levels of CgA, p-Tau, total Tau and Actin in Brk6 and Brk (0-1) hippocampus lysates. C Quantification of WB in (A) (Brk 0-2, n = 12; Brk6, n = 14) (t = 3.19, df = 22.32). D Quantification of WB in (B) (Brk 0-2, n = 6; Brk6, n = 6) (t = 2.665, df = 9.49). E Representative immunofluorescence (IF) images showing CgA signal in the hippocampus of Brk 6 and Brk 1-2 samples. Scale bar = 20 μm. F ImageJ quantification of the immunoreactive CgA in the hippocampus shown as area fraction (%) of total hippocampus (n = 8 per group) (t = 3.853, df = 12.15). G WB of frontal cortex lysates of CBD and normal control patients showing levels of CgA, pTau, Tau and actin. H Quantification of CgA levels in WB shown in (G), normalized to actin levels (n = 7 per group) (t = 2.687, df = 9.028). I WB of frontal cortex lysates of WT (n = 6) and PS19 (n = 6) mice for CgA, Tau and actin. J Quantification of WB shown in I for CgA levels, normalized to actin levels (n = 6 per group) (t = 2.728, df = 9.455). K Schematic (Created in BioRender) showing the experimental plan of CgA treatment in neuron and representative image of MAP2 and MC1 staining after CgA treatment. Scale bar = 200 µm. L Quantification of MAP2 and MC1 staining after CgA treatment. (t = 6.623, df = 7.284). M Schematic of organotypic slice culture (OTSC) generation, treatment and imaging (Created in BioRender). Representative IF images using MC1 antibody showing misfolded Tau species in organotypic hippocampal slices from WT (top) and CgA-KO (bottom) mice transduced with AAV tau P301S and treated with K18 fibrils. Scale bar = 200 μm. N ImageJ quantification of MC1 area fraction from images as represented in (M) (n = 6), t = 2.49, df = 8.635. P-values were calculated using unpaired two-tailed T-test with Welch’s correction. Data are presented as mean values +/− SEM. Source data are provided as a Source Data file.
Fig. 2
Fig. 2. CgA deficiency reduces tauopathy.
A Representative Nissl staining of mouse brain section of WT, PS19, CgA-KO and CgA-KO/PS19 littermate mice of 9-10 months of age. Scale bar = 200 μm. B Estimated volume of the hippocampus of 9-10-months-old WT (n = 8), PS19 (n = 6), CgA-KO (n = 6) and CgA-KO/PS19 mice (n = 7). (One-way Anova, Sidak’s Multiple comparison test, F3, 23 = 1.969, P < 0.0001). C WB of cortex RIPA lysates of WT (n = 4), PS19 (n = 5) and CgA-KO/PS19 (n = 5) mice showing levels of pathogenic phosphorylated Tau (pTau), total Tau, PSD95, actin and CgA. D Representative IF images showing the levels of MC1 labeled misfolded Tau species in the Dentate Gyrate (DG) and CA3 region of hippocampus. Scale bar = 100 μm. E ImageJ quantification of MC1+ misfolded Tau species revealed by IF in DG (n = 12) (Unpaired two-tailed t-test with Welch’s correction, t = 3.696, df = 11.71). F ImageJ quantification of MC1+ misfolded Tau species revealed by IF in CA3 (n = 14) (Unpaired two-tailed T-test with Welch’s correction, t = 4.836, df = 17.31). G Fluorescence images of HEK293 cells expressing TauRD-GFP transfected with the brain extracts of PS19 (top) or CgA-KO/PS19 mice. Scale bar = 50 μm. H ImageJ quantification of Misfolded Tau species (FRET+) as shown in G, normalized to DAPI counts (n = 4 per group) (Unpaired two-tailed T-test with Welch’s correction, t = 6.112, df = 4.753). I Schematics describing the Tau fibrils (K18/PL)-induced spreading assay (Created in BioRender). J Representative IF images using MC1 antibody showing spreading of misfolded Tau species from the site of injection (ipsilateral) to the opposite site (contralateral) of the hippocampus. A zoomed-in view of the aggregate-rich region is shown in each case. Scale bar = 200 μm. K ImageJ quantification of misfolded Tau species as a ratio of MC1+ area in ipsilateral hippocampus relative to the contralateral hippocampus as in (J) (n = 6 mice per group) (Unpaired two-tailed T-test with Welch’s correction, t = 8.814, df = 7.042). Data are presented as mean values +/− SEM. Source data are provided as a Source Data file.
Fig. 3
Fig. 3. Ablation of CgA improved spatial learning and memory, and extended the life span of PS19 mice.
A Distance traveled each day to reach the platform during seven days training trials of the Morris Water-Maze Test. CgA-KO/PS19 (n = 20), CgA-KO (n = 16), PS19 (n = 19) and WT (n = 18). p-value was calculated using Two-way ANOVA (F18, 420 = 3.013, P < 0.0001) Tukey’s Multiple comparison test. B Area Under the Curve (AUC) for the distance traveled during the training period. P-value was calculated using One-way ANOVA (F3, 70 = 43.76, P < 0.0001) Dunnett’s Multiple comparison test. C Probe trial performed 24 hr after the 7th day of training for all the mice. The swimming paths in the probe trial of representative mice of all four groups are shown (the square marks the location of the platform during the goal acquisition trials). D Time taken (latency) to reach the target platform. CgA-KO/PS19 (n = 20), CgA-KO (n = 16), PS19 (n = 19) and WT (n = 18). P-value was calculated using One-way ANOVA (F3, 69 = 16.14, P < 0.0001) Sidak’s Multiple comparison test. E Number of entries in the zone where the platform was present (correct zone). CgA-KO/PS19 (n = 20), CgA-KO (n = 16), PS19 (n = 19) and WT (n = 18). P-value was calculated using One-way ANOVA (F3, 69 = 11.5, P < 0.0001) Sidak’s Multiple comparison test. F Swimming speed of all the mice during the probe trial day. CgA-KO/PS19 (n = 20), CgA-KO (n = 16), PS19 (n = 20) and WT (n = 18). P-value was calculated using One-way ANOVA (F3, 70 = 4.99, P = 0.0034) Sidak’s Multiple comparison test. G Novel Object Recognition scores of CgA-KO/PS19 and PS19 mice. [WT (n = 15), CgA-KO (n = 16), PS19 (n = 19) and CgA-KO/PS19 (n = 20)]. P-value was calculated using Kruskal-Wallis test for NOR. H Time before falling in the Rotarod test for all four mice groups [WT (n = 18), CgA-KO (n = 16), PS19 (n = 20) and CgA-KO/PS19 (n = 20)]. P-value was calculated using Two-way ANOVA (F18, 420 = 1.328, P = 0.1656) Turkey’s Multiple comparison test. I Longevity of PS19 and CgA-KO/PS19 mice shown as a Kaplan-Meier plots (n = 20 per group). P-value was calculated using Gehan-Breslow-Wilcoxon test (Chi square = 23.86, df = 1). Data are presented as mean values +/− SEM. Source data are provided as a Source Data file.
Fig. 4
Fig. 4. CgA-KO/PS19 mice exhibit decreased microgliosis compared to PS19 mice.
A Representative immunofluorescence (IF) images showing the levels of CD68 in the hippocampi (CA1 region) of PS19, CgA-KO/PS19 and WT mice. Scale bar = 50 μm. B Quantification of the immunoreactive CD68 in CA1 as percentage of total CA1 area from IF images as shown in (A). PS19 (n = 8), CgA-KO/PS19 (n = 8) and WT (n = 4). P-value was calculated using One-way Anova (F2, 17 = 0.6355, P = 0.5418) Dunnett’s multiple comparison test. C Representative IF images showing the levels of CD68 in the hippocampi (CA3 region) of PS19, CgA-KO/PS19 and WT mice. Scale bar = 50 μm. D Quantification of the immunoreactive CD68 in CA1 as percentage of total CA1 area from IF images as shown in (C) PS19 (n = 5), CgA-KO/PS19 (n = 5) and WT (n = 4). P-value was calculated using One-way Anova (F2, 11 = 4.13, P = 0.0459) Dunnett’s multiple comparison test. E Representative IF images showing the levels of Iba1 in the hippocampi of PS19, CgA-KO/PS19 and WT mice. Scale bar = 50 μm. F Quantification of the immunoreactive Iba as percentage of total area from IF images as shown in E. PS19 (n = 5), CgA-KO/PS19 (n = 5) and WT (n = 5). P-value was calculated using One- way Anova (F2, 12 = 2,395, P = 0.1333) Dunnett’s multiple comparison test. G Levels of cortical IL-1β (G), IL-6 (H), TNFα (I) and CXCL2 (J) in PS19 (n = 12), CgA-KO/PS19 (n = 12), WT (n = 7) and CgA-KO (n = 7). P-values were calculated using One-way ANOVA (G F3, 34 = 14.35, P < 0.0001, H F3, 34 = 28.6, P < 0.0001, I F3, 34 = 22.93, P < 0.0001, J F3, 34 = 21.34, P < 0.0001) Tukey’s Multiple Comparison test. Data are presented as mean values +/− SEM. Source data are provided as a Source Data file.
Fig. 5
Fig. 5. CgA deletion induces reprogramming of adrenergic receptor expression in Tauopathy mice brain.
A Heatmap representation of normalized read Z-scores of shared upregulated or downregulated genes in WT (n = 5) and CgA-KO/PS19 (n = 6) relative to PS19 (n = 6) (log2 fold-change > 0.5, p value < 0.01) from 9-month-old mice cortices. Adra gene family showing significant expression changes are highlighted. B Z-score of hierarchical clusters I of WT, PS19 and CgA-KO/PS19. P-value was calculated using One-way Anova (F2, 1248 = 163.9, P < 0.0001) Sidak’s multiple comparison test. C Z-score of hierarchical clusters II of WT, PS19 and CgA-KO/PS19. P-value was calculated using One-way Anova (F2, 876 = 45.91, P < 0.0001) Sidak’s multiple comparison test. D Venn diagram showing number of upregulated genes as compared in two groups (WT/PS19 and CgA-KO/PS19). Expression of 417 genes overlaps in PS19 vs. WT and PS19 vs. CgA-KO/PS19. E Gene ontology analysis for pathways enriched in shared genes in (D). Number of genes involved in each pathway are shown in the bar. F Venn diagram showing number of downregulated genes as compared in two groups (WT/PS19 and CgA-KO/PS19). Expression of 293 genes overlaps in PS19 vs. WT and PS19 vs. CgA-KO/PS19. G Gene ontology analysis for pathways enriched in shared genes in (E) Number of genes involved in each pathway are shown in the bar. H Representative WB showing Adra1b, Adra2b and Adrb2 protein levels in three mouse groups, WT (n = 4), PS19 (n = 4) and CgA-KO/PS19 (n = 4). Also shown are the levels of p-Tau (S202/T205), total PS19, CgA and tubulin (loading control). I Quantitation showing relative levels of Adra1b in (H). WT (n = 4), PS19 (n = 4) and CgA-KO/PS19 (n = 4). P-value was calculated using One-way Anova (F2, 9 = 0.07055, P = 0.0004) Sidak’s multiple comparison test. J Quantitation showing relative levels of Adra2b in (H). WT (n = 4), PS19 (n = 4) and CgA-KO/PS19 (n = 4). P-value was calculated using One-way Anova (F2, 9 = 0.8729, P = 0.0004) Sidak’s multiple comparison test. K Representative IF images of Adra1b, NeuN and DAPI in the hippocampus slices of PS19, CgA-KO/PS19 and WT mice. Scale bar = 200 μm. L Image (J) Quantitation of IF images as in (H) showing relative levels of Adra1b in PS19 (n = 5) and CgA-KO/PS19 (n = 5). P-value was calculated using (Unpaired two-tailed T-test with Welch’s correction, t = 2.649, df = 4.293). M Pearson correlation between Adra1b area fraction and the hippocampus volumes of PS19 (red dots) and CgA-KO/PS19 (blue dots) mice. Data are presented as mean values +/− SEM. Source data are provided as a Source Data file.
Fig. 6
Fig. 6. Alpha-1 adrenergic signaling regulates Tauopathy.
A Schematics showing the rationale of Phenylephrine (Adra1 agonist) and Prazosin (Adra1 antagonist) treatment in WT and CgA-KO hippocampal OTSC to access the Tau aggregation ex-vivo (Created in BioRender). B Representative WB showing p-Tau, total tau and actin (loading control) from OTSC lysates upon different treatment. WT hippocampus OTSC treated with DMSO (n = 3) and PR (Prazosin) (n = 3). CgA-KO hippocampus OTSC treated with PBS (n = 3) and PE (Phenylephrine) (n = 3). C Representative IF images showing MC1+  misfolded Tau species in WT hippocampus OTSC treated with PR (n = 6) and DMSO (n = 6) control. Scale bar = 200 μm. D Representative IF images showing MC1+  misfolded Tau species in CgA-KO hippocampus OTSC treated with PBS (n = 6) and PE (n = 6). Scale bar = 200 μm. E Western Blot of cortex RIPA lysate of Prazosin (PR) treated (n = 5) and Vehicle (Veh.) treated (n = 5) PS19 mice showing levels of pTau, Tau and actin. F, G Densitometric quantification of p-Tau in PR (n = 5) and veh. (n = 5) treated mice. P-value in F and G was calculated using Unpaired two-tailed T-test with Welch’s correction ((F) t = 3.757, df = 4.267, (G) t = 2.924, df = 4.577). H Representative IHC image of MC1 staining in PR and veh. treated mice. Scale bar = 50 µm. Data are presented as mean values +/− SEM. Source data are provided as a Source Data file.
Fig. 7
Fig. 7. Elevated Epinephrine (EPI) levels in AD, CBD and PS19 transgenic mice samples increases Tauopathy in OTSC through alpha-1 adrenergic signaling.
A Quantification of epinephrine (EPI) levels in the Pre-frontal (PF) cortex of AD patients from Braak stage 0-2 (n = 19) and Braak stage 6 (n = 21). P-value was calculated using Unpaired two-tailed T-test with Welch’s correction, t = 3.748, df = 28.57. B Quantification of EPI levels in the hippocampus/Entorhinal (HC/EC) cortex of AD patients from Braak stage 0-2 (n = 20) and Braak stage 6 (n = 18). P-value was calculated using Unpaired two-tailed t-test with Welch’s correction, t = 3.726, df = 24.85. C Quantification of EPI levels in the CSF of AD patients from Braak stage 0-2 (n = 6) and Braak stage 6 (n = 16). P-value was calculated using Unpaired two-tailed t-test with Welch’s correction, t = 3.764, df = 15.17. D Quantification of EPI levels in the PF cortex of CBD patients from Braak stage 0 (n = 8) and Braak stage 3 (n = 10) stages. P-value was calculated using Unpaired two-tailed t-test with Welch’s correction, t = 4.622, df = 12.17. E Quantification of EPI levels in the cortex of 9-months old mice WT (n = 6), PS19 (n = 8), CgA-KO (n = 6), and CgA-KO/PS19 (n = 7). P-value was calculated using One-way Anova (F3, 23 = 1.545, P = 0.2298) Dunnett’s multiple comparison test. F WB showing p-Tau, total tau and actin (loading control) in hippocampus OTSC lysates upon EPI treatment. G Quantification of WB of Tau phosphorylation at S202 relative to total Tau (n = 3). P-value was calculated using Unpaired two-tailed t-test with Welch’s correction, t = 18.32, df = 3.944. H Quantification of WB of Tau phosphorylation at S396/S404 relative to total Tau (n = 3). P-value was calculated using Unpaired two-tailed T-test with Welch’s correction, t = 5.292, df = 2.025. I Representative IF images showing MC1+  misfolded Tau species in hippocampus OTSC treated with EPI (top) or PBS control (bottom). Scale bar = 200 μm. J Image J quantification of MC1+ fraction in EPI (n = 3) and PBS (n = 3) treated hippocampus OTSC. P-value was calculated using Unpaired two-tailed t-test with Welch’s correction, t = 3.095, df = 3.938. K Schematic of the use of EPI and prazosin (PR) in OTSC to access Tau phosphorylation and neurofibrillary tangle formation (Created in BioRender). L Representative images showing MC1 positive pathological Tau conformations in WT hippocampus OTSC treated with EPI, PBS, EPI+PR. Scale bar = 200 μm. M ImageJ quantification of MC1+ Tau conformations in OTSC (n = 4, per group). P-value was calculated using One-way Anova (F3, 12 = 9.786, P = 0.0015) Sidak’s Multiple Comparisons Test. Data are presented as mean values +/− SEM. Source data are provided as a Source Data file.
Fig. 8
Fig. 8. Schematic depicting the role of CgA in Tauopathy.
In Tauopathy brains, elevated levels of chromogranin A (CgA) contribute to increased epinephrine (Epi), accompanied by an upregulation of α1-adrenergic receptors and a downregulation of α2-adrenergic receptors. This imbalance in adrenergic signaling promotes the accumulation of pathological Tau, exacerbates neuroinflammation and neurodegeneration, and accelerates cognitive decline. Genetic depletion of CgA in PS19 Tauopathy mice restores the balance in the adrenergic axis, thereby mitigating Tau-related neuropathology and rescuing cognitive function. (Created in BioRender).

Update of

Similar articles

Cited by

References

    1. Blaschko, H., Comline, R. S., Schneider, F. H., Silver, M. & Smith, A. D. Secretion of a chromaffin granule protein, chromogranin, from the adrenal gland after splanchnic stimulation. Nature215, 58–59 (1967). - PubMed
    1. Mosley, C. A. et al. Biogenesis of the secretory granule: chromogranin A coiled-coil structure results in unusual physical properties and suggests a mechanism for granule core condensation. Biochemistry46, 10999–11012 (2007). - PubMed
    1. Winkler, H. & Fischer-Colbrie, R. The chromogranins A and B: the first 25 years and future perspectives. Neuroscience49, 497–528 (1992). - PMC - PubMed
    1. Bartolomucci, A. et al. The extended granin family: structure, function, and biomedical implications. Endocr. Rev.32, 755–797 (2011). - PMC - PubMed
    1. Schober, M., Howe, P. R., Sperk, G., Fischer-Colbrie, R. & Winkler, H. An increased pool of secretory hormones and peptides in adrenal medulla of stroke-prone spontaneously hypertensive rats. Hypertension13, 469–474 (1989). - PubMed

MeSH terms