. 2025 May 20;16(1):4640.
doi: 10.1038/s41467-025-59907-8.

Caspase-11 drives macrophage hyperinflammation in models of Polg-related mitochondrial disease

Affiliations

Caspase-11 drives macrophage hyperinflammation in models of Polg-related mitochondrial disease

Jordyn J VanPortfliet et al. Nat Commun. .

Abstract

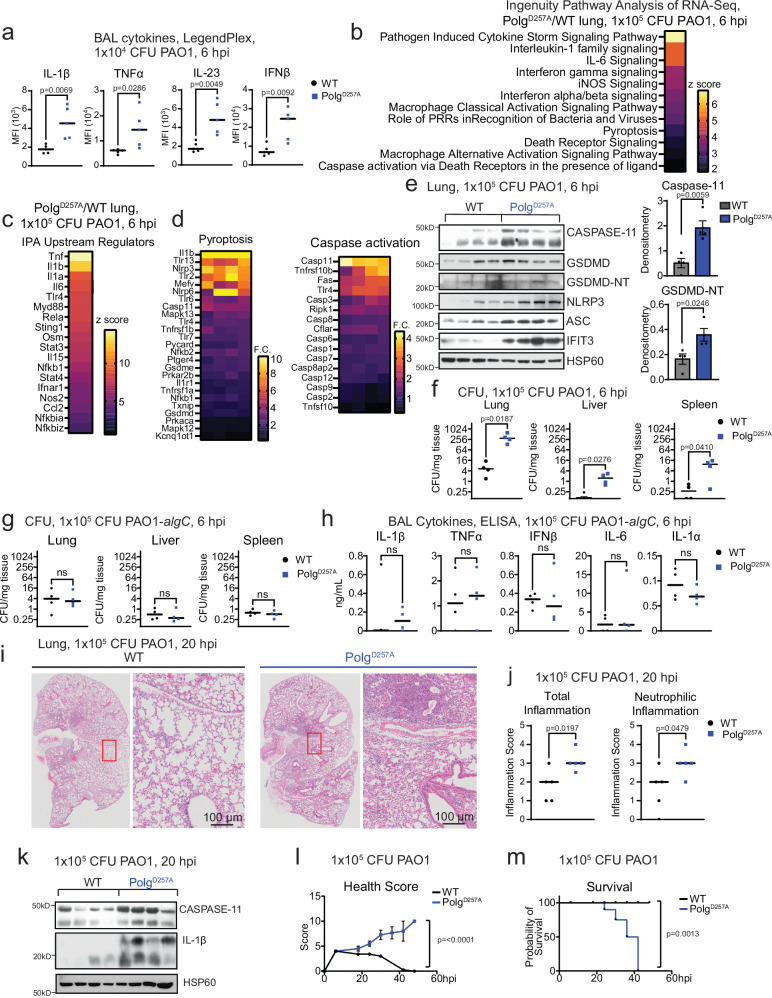
Mitochondrial diseases (MtD) represent a significant public health challenge due to their heterogenous clinical presentation, often severe and progressive symptoms, and lack of effective therapies. Environmental exposures, such bacterial and viral infection, can further compromise mitochondrial function and exacerbate the progression of MtD. However, the underlying immune alterations that enhance immunopathology in MtD remain unclear. Here we employ in vitro and in vivo approaches to clarify the molecular and cellular basis for innate immune hyperactivity in models of polymerase gamma (Polg)-related MtD. We reveal that type I interferon (IFN-I)-mediated upregulation of caspase-11 and guanylate-binding proteins (GBP) increase macrophage sensing of the opportunistic microbe Pseudomonas aeruginosa (PA) in Polg mutant mice. Furthermore, we show that excessive cytokine secretion and activation of pyroptotic cell death pathways contribute to lung inflammation and morbidity after infection with PA. Our work provides a mechanistic framework for understanding innate immune dysregulation in MtD and reveals potential targets for limiting infection- and inflammation-related complications in Polg-related MtD.


Conflict of interest statement

Competing interests: The authors declare no competing interests.

Figures

Fig. 1
Fig. 1. PolgD257A mutator macrophages exhibit increased IFN-I and pro-inflammatory responses after challenge with LPS or Pseudomonas aeruginosa.
a Workflow for preparing RNA from Polg mutant BMDMs after Pseudomonas aeruginosa (PA) strain O1 (PAO1) challenge. Created in BioRender. Vanportfliet, J. (2025) https://BioRender.com/g7t8646. b Ingenuity Pathway Analysis (IPA) of RNA-seq from bone marrow-derived macrophages (BMDMs) showing Z-scores of pathways in PolgD257A homozygous mutant BMDMs compared to wild-type (WT) after LPS or PAO1 challenge. hpc = hours post challenge. N = 3 biological replicates/genotype/condition. c Log2 fold changes of representative genes in IPA pathways from (b) in PolgD257A BMDMs compared to WT after LPS or PAO1. d Protein abundance of interferon-stimulated genes (ISGs) in BMDMs exposed to PAO1 at a multiplicity of infection (MOI) of 5 at the indicated hours post challenge (hpc). e qRT-PCR analysis of ISGs in WT and PolgD257A BMDMs after PAO1. N = 3 biological replicates, 2 technical replicates/genotype/condition. f Western blot analysis of interferon stimulated genes (ISGs) over time course infection. Representative blots from N = 3 experiments. g Ingenuity pathway analysis showing z-scores of upregulated pathways by proteomics from PolgD257A (PAO1/Un)/WT (PAO1/Un) BMDM. N = 4 biological replicates. h IPA Upstream Regulator analysis showing Z-scores in PolgD257A (PAO1/Un)/WT (PAO1/Un). i Legendplex pro-inflammatory cytokines analysis of PerMac supernatants 24 h post challenge (hpc). N = 3 biological replicates. j Proinflammatory cytokines in supernatant of peritoneal macrophages (PerMacs) measured by ELISA. MOI = multiplicity of infection, N = 8 biological replicates over 4 time points. k IL-1β in supernatant of peritoneal macrophages (PerMacs) measured by ELISA. MOI = multiplicity of infection, N = 8 biological replicates over 4 time points. l Ingenuity pathway analysis of proteomics from PolgD257A (PAO1, 8hpc/Un)/WT (PAO1, 8 hpc/Un) BMDM proteins in the Pyroptotic Signaling Pathway. N = 4 biological replicates. Statistics: (e, i, j) Two-Way ANOVA. Error bars represent SEM. Source data are provided as a Source Data file.
Fig. 2
Fig. 2. Caspase-11 and caspase-1 drive pyroptosis and inflammation in PolgD257A macrophages challenged with PAO1.
a ELISA analysis of inflammatory cytokines in BMDM supernatant after PAO1 or PAO1 plus caspase inhibitors. N = 4 biological replicates over 2 timepoints. b Cytation5 image analysis of PI positive BMDMs after PAO1 or PAO1 plus caspase-1 inhibitor. N = 6 biological replicates/genotype/condition. c Percent PerMacs dying after PAO1 and PAO1 plus caspase-1 inhibitor from IF (d). N = 4 IF images/genotype/condition. d Representative IF of PerMacs after PAO1 or PAO1 plus caspase inhibitor. Cells were stained with DAPI to mark the nucleus, CellMask to mark the total cell volume, and anti-GFP to mark GFP tagged PAO1. White arrows highlight dying cells characterized by condensed nuclei and loss of CellMask staining. Representative images from N = 3 experiments. e Western blot analysis of lysates from BMDMs challenged with PAO1. Representative blots from N = 3 experiments. f LegendPlex IL-1 cytokine analysis of BMDM supernatant 24 hpc. All undefined comparisons between WT and WT+AcYVAD are not significant. N = 3 biological replicates/genotype/condition. g LegendPlex pro-inflammatory cytokine analysis of BMDM supernatant 24 hpc. All undefined comparisons between WT and WT+AcYVAD are not significant. N = 3 biological replicates/genotype/condition. h Cytation5 image quantification of PI positive BMDMs after LPS priming plus LPS transfection, and LPS priming plus LPS transfection plus caspase-1 inhibitor. N = 3–5 biological replicates/genotype/condition. i ELISA analysis of IL-1β in BMDM supernatant after LPS priming plus LPS transfection in the presence or absence of caspase-1 inhibitor. N = 4 biological replicates. j qRT-PCR analysis of Caspase-11 RNA expression in BMDMs after PAO1. N = 3 biological replicates, 3 technical replicates/genotype/condition. k Cytation5 image quantification of PI positive cells in BMDMs after LPS priming plus LPS transfection, and incubated with αIFNAR blocking antibody or αIgG control. N = 4–6 biological replicates/genotype/condition. Statistics: (c, f, g, i) One-Way ANOVA (a, b, h, j, k) Two-Way ANOVA. Error bars represent SEM. Source data are provided as a Source Data file.
Fig. 3
Fig. 3. Interferon signaling drives elevated GBP expression and hyperinflammation in PolgD257A macrophages.
a Percent BMDMs dying after PAO1 and PAO1 plus anti-IFNAR blockade from (b) representative IF. N = 5–6 IF images/genotype/condition. c ELISA analysis of pyroptotic cytokine in BMDM supernatant after PAO1 or PAO1 plus anti-IFNAR blockade. N = 4 biological replicates over 2 timepoints. d ELISA analysis of inflammatory cytokine, IL-6, in BMDM supernatant after PAO1 or PAO1 plus anti-IFNAR blockade. N = 4 biological replicates over 2 timepoints. e qRT-PCR analysis of ISGs in WT and PolgD257A BMDMs after PAO1 and PAO1 plus anti-IFNAR blockade. N = 3 technical replicates/genotype/condition. f Representative IF of BMDMs 2 hpc with PAO1 at a multiplicity of infection (MOI) of 5. Cells were fixed, permeabilized, and stained with DAPI to mark the nucleus, anti-LPS antibody to stain PAO1 LPS, and anti-GBP5 antibody. Representative images from N = 3 experiments. g Sum intensity of GBP5 per cell area and (h) PAO1-LPS localized with GBP5 in BMDMs after PAO1 in (f) IF. N = 7–8 images/genotype. Statistics: (g, h) Two-Sided Student’s t-test (a, e) One-Way ANOVA (c, d) Two-Way ANOVA. Error bars represent SEM. Source data are provided as a Source Data file.
Fig. 4
Fig. 4. Caspase-11 activation, accentuated by GBPs, induces cell death and subsequent inflammation in PolgD257A macrophages.
a Percent BMDMs dying after being given an siRNA control or siRNA to knock down caspase-11 or GBPs and then challenged with PAO1 from (b) representative IF. N = 8–9 IF images/genotype/condition. c Western blot analysis of lysates from BMDMs challenged with PAO1 after siRNA knock down of caspase-11. d ELISA analysis of IL-1 cytokines in BMDM supernatant after being given an siRNA control or siRNA to knock down caspase-11 or GBPs and then challenged with PAO1. N = 3–4 biological replicates/genotype/condition. e Quantification of caspase-11 associated with LPS in BMDMs after knock down of caspase-11 or GBPs by siRNA and then challenge with PAO1. N = 5 IF images/genotype/condition. f ELISA analysis of inflammatory cytokines in BMDM supernatant after being given an siRNA control or siRNA to knock down caspase-11or GBPs and then challenged with PAO1. N = 4 biological replicates/genotype/condition. Statistics: (a, d, e, f) One-Way ANOVA. Error bars represent SEM. Source data are provided as a Source Data file.
Fig. 5
Fig. 5. Elevated caspase-11 binding to LPS contributes to pyroptosis and inflammatory IL-1R signaling in PolgD257A macrophages.
a Quantitation of PAO1 and lysosomes in BMDMs from (b) TEM images. Black arrows highlight outer membrane derived vesicles. N = 9 images/condition. c Quantification of capase-11 and GBP5 intensity in the area containing caspase-11, GBP5, and PAO1 from representative IF images (d). N = 10–12 IF images/genotype/condition. e ELISA analysis of IL-1 cytokines in BMDM supernatant after PAO1 or PAO1 plus anti-IL-1R blockade 2 hpi. N = 4 biological replicates/genotype/condition. f Percent BMDMs dying after PAO1 and PAO1 plus anti-IL-1R blockade from (Supplementary Fig. 9b) representative IF. N = 11–13 IF images/genotype/condition. g ELISA analysis of IL-1 cytokines in BMDM supernatant after PAO1 or PAO1 plus anti-IL-1R blockade 24 hpi. N = 4 biological replicates/genotype/condition. h ELISA analysis of inflammatory cytokines in BMDM supernatant after PAO1 or PAO1 plus anti-IL-1R blockade 24 hpi. N = 4 biological replicates/genotype/condition. Statistics: (a, c) Two-Sided Student’s t-test (eh) Two-Way ANOVA. Error bars represent SEM. Source data are provided as a Source Data file.
Fig. 6
Fig. 6. Macrophages incorporating a deleterious patient mutation (PolgR292C) exhibit mtDNA depletion, elevated IFN-I responses, increased pyroptosis, and hyperinflammation after challenge with PAO1.
a qRT-PCR analysis of ISGs in BMDMs after PAO1, N = 3 technical replicates/genotype. b ELISA analysis of inflammatory cytokines in BMDM supernatant after PAO1. N = 12 biological replicates over 3 time points. c Percent BMDMs dying after PAO1 and PAO1 plus caspase-1/11 inhibitor. N = 7 IF images/genotype/condition. d ELISA analysis of IL-1 cytokines in BMDM supernatant after PAO1 or PAO1 plus caspase-1/11 inhibitor. N = 3 biological replicates/genotype/condition. e ELISA analysis of proinflammatory cytokines in BMDM supernatant after PAO1 or PAO1 plus caspase-1/11 inhibitor. N = 3 biological replicates/genotype/condition. f Percent BMDMs dying after PAO1 and PAO1 plus anti-IFNAR blockade from. N = 7 IF images/genotype/condition. g ELISA analysis of IL-1 cytokines in BMDM supernatant after PAO1 or PAO1 plus anti-IFNAR blockade. N = 4 biological replicates/genotype/condition. h ELISA analysis of pro-inflammatory cytokines in BMDM supernatant after PAO1 or PAO1 plus anti-IFNAR blockade. N = 4 biological replicates/genotype/condition. i Quantification of caspase-11 in BMDMs after knock down by siRNA and PAO1 challenge. N = 5 IF images/genotype/condition. k Percent BMDMs dying after PAO1 and PAO1 plus caspase-11 knock down by siRNA from (j) representative IF. N = 8 IF images/genotype/condition. l ELISA analysis of IL-1 cytokines in BMDM supernatant after PAO1 or PAO1 caspase-11 knock down by siRNA. N = 3 biological replicates/genotype/condition. m ELISA analysis of pro-inflammatory cytokines in BMDM supernatant after PAO1 or PAO1 caspase-11 knock down by siRNA. N = 3 biological replicates/genotype/condition. Statistics: (a) Two-Sided Students t-test. (b) Two-Way ANOVA. (ci, km) One-Way ANOVA. Error bars represent SEM. Source data are provided as a Source Data file.
Fig. 7
Fig. 7. Intratracheal instillation of PAO1 into lungs elicits greater inflammation, caspase-11 expression, and morbidity of PolgD257A mutant mice.
a LegendPlex pro-inflammatory cytokine analysis of bronchial alveolar lavage (BAL) 6 h post infection (hpi) with 1 × 104 colony forming units (CFU) of PAO1. N = 5 mice/genotype. b Ingenuity Pathway Analysis (IPA) of RNA-seq from lung showing Z-scores of pathways in PolgD257A homozygous mutant BMDMs compared to wild-type (WT) after PAO challenge. N = 3 biological replicates/genotype/condition. c IPA Upstream Regulator analysis showing Z-scores in PolgD257A homozygous mutant lungs compared to WT after 6 h PAO1 challenge. d Log2 fold changes of representative genes in IPA pathways from (a) in PolgD257A lungs compared to WT after PAO1. e Protein expression or WT and PolgD257A lung homogenates 6 hpi with 1 × 105 CFU of PAO1 and densitometry. N = 4 mice/genotype. f Colony counts from homogenized tissue infected with 1 × 105 PAO1 for 6 h. N = 4 mice/genotype. g Colony counts from homogenized tissue infected with 1 × 105 PAO1-algC for 6 h. N = 4 mice/genotype. h ELISA analysis of pro-inflammatory cytokines in BAL of mice infected with 1 × 105 PAO1- algC for 6 h. N = 4 mice/genotype. i Representative hematoxylin and eosin (H&E) staining of lung sections 20 hpi with 1 × 105 CFU of PAO1. j Graphs of pathology scoring from H&E stained lungs in (i) histology. N = 5 mice/genotype. k Protein expression or WT and PolgD257A lung homogenates 20 hpi with 1 × 105 CFU of PAO1. l Illness scoring of WT and PolgD257A mice over PAO1 infection time course. N = 4–5 mice/genotype. (m) Kaplan-Meier survival curve after infection with 1 × 105 CFU of PAO1. N = 4–5 mice/genotype. Statistics: (a, eh, j) Two-Sided Students t-test (l) Two-Way ANOVA (m) Kaplan-Meijer Survival Curve. Error bars represent SEM. Source data are provided as a Source Data file.

Update of

Similar articles

Cited by

References

    1. Gorman, G. S. et al. Mitochondrial diseases. Nat. Rev. Dis. Prim.2, 16080 (2016). - PubMed
    1. Suomalainen, A. & Battersby, B. J. Mitochondrial diseases: the contribution of organelle stress responses to pathology. Nat. Rev. Mol. Cell Biol.19, 77–92 (2018). - PubMed
    1. Russell, O. M., Gorman, G. S., Lightowlers, R. N. & Turnbull, D. M. Mitochondrial diseases: hope for the future. Cell181, 168–188 (2020). - PubMed
    1. Kruk, S. K. et al. Vulnerability of pediatric patients with mitochondrial disease to vaccine-preventable diseases. J. Allergy Clin. Immunol. Pr.7, 2415–2418.e3 (2019). - PMC - PubMed
    1. Walker, M. A. et al. Predisposition to infection and SIRS in mitochondrial disorders: 8 years’ experience in an academic center. J. Allergy Clin. Immunol. Pr.2, 465–468, 468.e1 (2014). - PubMed

MeSH terms