. 2025 May 20;14(1):17.
doi: 10.1038/s41389-025-00560-7.

TGF-β signaling redirects Sox11 gene regulatory activity to promote partial EMT and collective invasion of oncogenically transformed intestinal organoids

Affiliations

TGF-β signaling redirects Sox11 gene regulatory activity to promote partial EMT and collective invasion of oncogenically transformed intestinal organoids

Yu-Hsiang Teng et al. Oncogenesis. .

Abstract

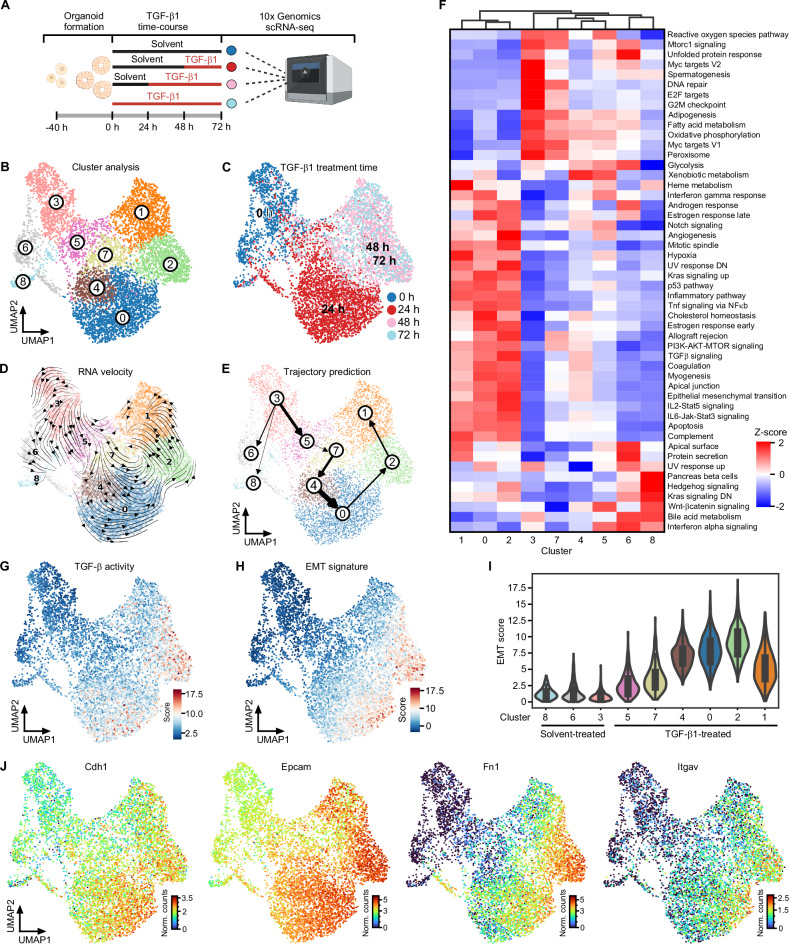
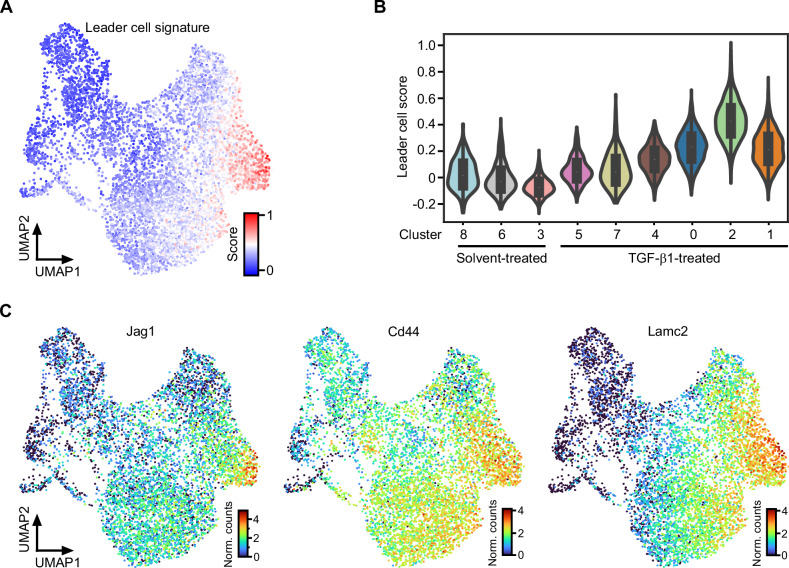
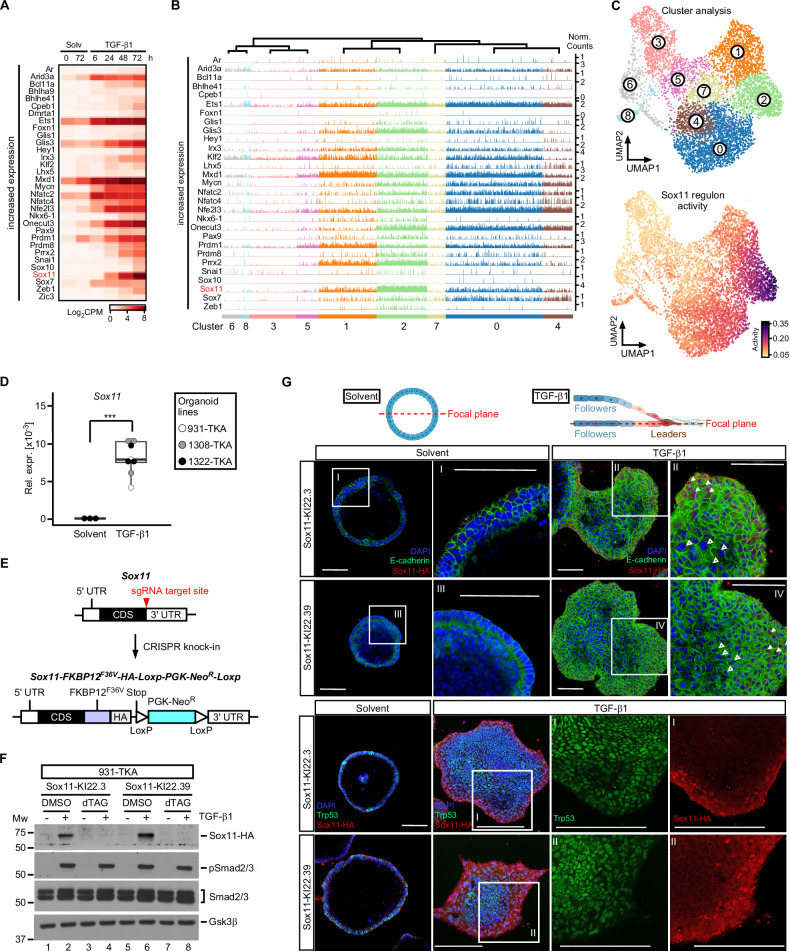
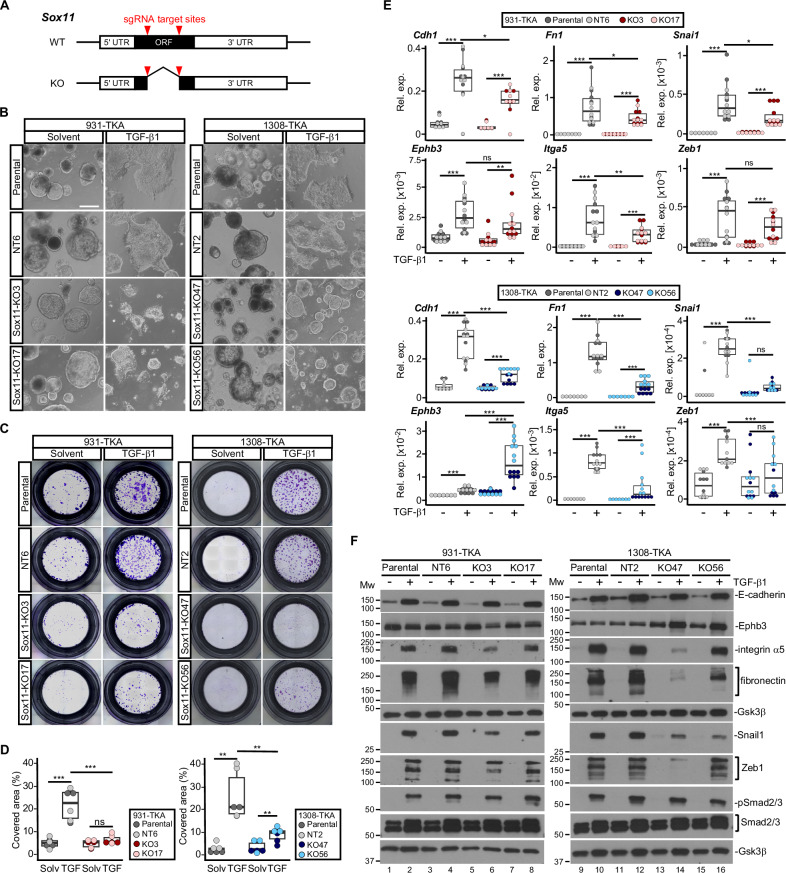
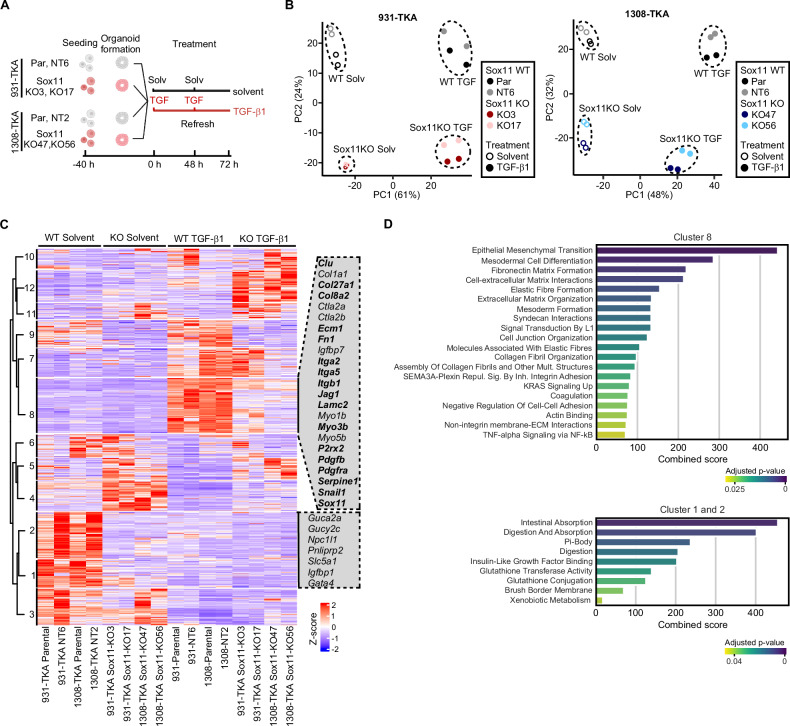
Cancer cells infiltrating surrounding tissue frequently undergo partial epithelial-mesenchymal transitions (pEMT) and employ a collective mode of invasion. How these phenotypic traits are regulated and interconnected remains underexplored. Here, we used intestinal organoids with colorectal cancer (CRC) driver mutations as model system to investigate the mechanistic basis of TGF-β1-induced pEMT and collective invasion. By scRNA-seq we identified multiple cell subpopulations representing a broad pEMT spectrum, where the most advanced pEMT state correlated with the transcriptional profiles of leader cells in collective invasion and a poor prognosis mesenchymal subtype of human CRC. Bioinformatic analyses pinpointed Sox11 as a transcription factor gene whose expression peaked in the potential leader/pEMThigh cells. Immunofluorescence staining confirmed Sox11 expression in cells at the invasive front of TGF-β1-treated organoids. Loss-of-function and overexpression experiments showed that Sox11 is necessary, albeit not sufficient, for TGF-β1-induced pEMT and collective invasion. In human CRC samples, elevated SOX11 expression was associated with advanced tumor stages and worse prognosis. Unexpectedly, aside from orchestrating the organoid response to TGF-β1, Sox11 controlled expression of genes related to normal gut function and tumor suppression. Apparently, Sox11 is embedded in several distinct gene regulatory circuits, contributing to intestinal tissue homeostasis, tumor suppression, and TGF-β-mediated cancer cell invasion.


Conflict of interest statement

Competing interests: The authors declare no competing interests. Ethical approval and consent to participate: All methods were performed in accordance with the relevant guidelines and regulations. Mice were handled in compliance with legal directives at the Center for Experimental Models and Transgenic Service of the University of Freiburg Medical Center (project registration number: X-21/02F). No research involving humans was performed in this study.

Figures

Fig. 1
Fig. 1. Detection of a broad spectrum of transitory states and a pEMT endpoint in TGF-β1-treated TKA-organoids.
A Schematic overview of the scRNA-seq workflow. The figure was generated with BioRender.com. B Unsupervised clustering and UMAP visualization of 931-TKA organoid cells upon TGF-β1 treatment for 0, 24, 48, and 72 h and scRNA-seq. C Individual organoid cells in the UMAP were annotated according to TGF-β1 treatment times deduced by 10x Genomics sample indices. The color code represents TGF-β1 treatment times. RNA velocity analyses (D) and PAGA-based trajectory prediction (E) of scRNA-seq results from 931-TKA organoids. The arrows in the RNA velocity plot predict the starting point of cell states and directions of future progression projected onto the UMAP space. The thickness of the lines denotes the strength of connectivity between clusters. F Heatmap showing the MSigDB hallmark gene sets enriched in gene expression profiles of organoid cell clusters. The red-blue color scale represents the z-score. G TGF-β pathway activity was evaluated by MSigDB with decoupleR. Enrichment was determined by over-representation analysis (ORA) using the SCANPY function: score_gene function and visualized in the UMAP. H Expression of an EMT signature was scored by MSigDB with decoupleR and projected onto the UMAP space. I UMAP cluster-specific visualization of EMT scores in violin plots. J UMAPs visualizing expression levels of epithelial and mesenchymal marker genes in organoid cells treated with TGF-β1 for 0, 24, 48, and 72 h. The color code represents the normalized counts (Norm. counts) of the indicated genes.
Fig. 2
Fig. 2. Cells in the most advanced pEMT state express features of leader cells.
A Expression of a custom leader cell gene expression profile was scored with SCANPY. The obtained leader cell scores were projected onto the UMAP. B UMAP cluster-specific visualization of leader cell scores in violin plots. C Expression of exemplary leader cell genes visualized in the UMAP space. The color scales represent the normalized counts (Norm. counts) of the indicated genes.
Fig. 3
Fig. 3. Sox11 is the most highly expressed TGF-β1-inducible transcription factor in cluster 2 cells and localizes to a layer of cells at the invasive front of TKA-organoids.
A Heatmap displaying TF genes with increasing expression in combined, time-resolved bulk RNA-seq data from solvent (Solv) or TGF-β1-treated 931-TKA and 947-TKA organoids [10]. All murine TFs with log2 fold changes > 4 at least at one time point of TGF-β1 stimulation were selected for display. Samples treated with TGF-β1 for 6 h and 24 h were compared to samples harvested at the beginning of the treatment (solvent 0 h). Samples treated with TGF-β1 for 48 h and 72 h were compared to samples kept in solvent for 72 h. Normalized log2CPM values were used as gene expression units. B Trackplots showing cluster-wise expression of the same TF genes as in (A) in scRNA-seq data from solvent or TGF-β1-treated 931-TKA organoid cells. Each peak represents the normalized count for a given gene in a single organoid cell. C Unsupervised cell clustering and UMAP visualization of 931-TKA organoid cells upon TGF-β1 treatment for 0, 24, 48, and 72 h (top) and projection of SCENIC-predicted Sox11 regulon activity onto the UMAP (bottom). D Expression of Sox11 in TKA-organoid lines (931-TKA, 1308-TKA, and 1322-TKA). Organoids were embedded in 3 mg/ml Matrigel and treated with solvent or TGF-β1 for 72 h, followed by RNA collection and cDNA synthesis. RNA levels of Sox11 were evaluated by qRT-PCR and normalized by the expression levels of Eef1a1. The box plots show the 26th to 75th percentiles of the data and the median. Dots represent results of individual experiments (n = 3). One-Way ANOVA, ***: p value < 0.001. E Scheme depicting the strategy for CRISPR-mediated in-frame knock-in (KI) of FKBP12F36V coding sequences and the influenza virus hemagglutinin (HA)-epitope tag into the Sox11 gene. The upper and lower schemes represent WT and modified Sox11, respectively. The red arrowhead indicates the sgRNA target site. FKBP12F36V served as a degradation tag. The PGK-promoter driven neomycin resistance gene (NeoR) flanked by two loxP sites was used as selection marker. F Sox11 expression in Sox11-KI clones. Sox11-KI clones KI22.3 and KI22.39 were treated with solvent or TGF-β1 for 72 h. Two hours before harvest organoids additionally received DMSO or 500 nM dTAGV-1. Organoids were collected for western blot analysis to monitor expression of HA-tagged Sox11, phospho-Smad2/3 (pSmad2/3), and total Smad2/3. Gsk3β was detected to control equal loading. Representative results from one out of three experiments are shown (n = 3). MW: molecular weight standard in kDa. G 931-TKA Sox11-KI organoids were seeded in 3 mg/ml Matrigel and treated with solvent or TGF-β1 for 72 h, followed by whole-mount immunofluorescence staining of the antigens indicated and confocal microscopy. Nuclei were counterstained with DAPI. Positions of focal planes examined are shown in the schemes above the micrographs. Boxed areas with Roman numerals are shown at higher magnification. White arrowheads indicate nuclear Sox11-HA staining at organoid invasive fronts; empty arrowheads indicate absence of Sox11-HA staining in the organoid center. Scale bars: 100 µm. Representative images from one out of three experiments are shown (n = 3). The schemes were generated with BioRender.com.
Fig. 4
Fig. 4. Sox11 is necessary for TGF-β1 induced pEMT and collective invasion.
A Structures of Sox11 WT and KO loci. The red arrowheads mark the target sites for two sgRNAs used to delete a large part of the Sox11 open reading frame (ORF). UTR: untranslated region. B Whole-mount phase contrast microscopy of 931-TKA and 1308-TKA organoid lines treated with TGF-β1 for 72 h. The parental lines and clonally derived organoids treated with non-targeting (NT) sgRNAs (931-TKA: NT6; 1308-TKA: NT2) have WT Sox11 genes. KO lines carry biallellic deletions in Sox11 (931-TKA: KO3 and KO17; 1308-TKA: KO47 and KO56). Scale bar: 100 µm. Representative pictures from one of three independent biological replicates are shown. C Representative images of transwell invasion assays with Sox11 WT and mutant organoid lines as indicated. Organoids were seeded in 3 mg/ml Matrigel in the upper chambers of transwell inserts and treated with TGF-β1 for 72 h. Invasive organoid cells that had passed through the Matrigel layer and crossed the transwell bottom membrane were visualized by crystal violet staining. D Quantification of transwell assays with Sox11 WT and mutant organoid lines. Areas of transwell membranes covered by invaded organoid cells as exemplarily shown in (C) were measured by ImageJ (n = 3). Statistical significance was assessed by one-way ANOVA, ns: not significant; **: p value < 0.01; ***: p value < 0.001. E RNA expression levels of epithelial (Cdh1, Ephb3) and mesenchymal markers (Itga5, Fn1, Snai1, Zeb1) in the indicated Sox11 WT and mutant organoid lines treated with solvent or TGF-β1 for 72 h were determined by qRT-PCR and normalized to those of Eef1a1 (n = 3). The box plots show the 26th to 75th percentiles of the data and the median. Dots represent results of individual measurements. Rel. exp.: relative expression. One-way ANOVA; ns: not significant; *: p value < 0.05; **: p value < 0.01; ***: p value < 0.001. F Protein expression levels of epithelial markers (E-cadherin, Ephb3) and mesenchymal markers (integrin α5, fibronectin, Snail1, Zeb1) in the indicated Sox11 WT and mutant organoid lines treated with solvent or TGF-β1 for 72 h were determined by western blot analyses. Phosphorylated Smad2/3 (pSmad2/3) and total Smad2/3 amounts were analyzed to show TGF-β pathway activation. Detection of Gsk3β served to control equal loading. MW: molecular weight standards in kDa. Images are representative examples from one of three independent biological replicates.
Fig. 5
Fig. 5. Bulk RNA-seq reveals multiple functions of Sox11 in resting and TGF-β1-stimulated organoid cells.
A Experimental set-up. Sox11 WT and mutant organoid lines, as indicated, were seeded in 3 mg/ml Matrigel and treated with solvent or TGF-β1 for 72 h, followed by RNA collection and next generation sequencing. The figure was generated with BioRender.com. B Principal component analyses of RNA-seq results from the indicated Sox11 WT and mutant organoid lines cultured in conditions as shown. The color codes specify Sox11 genotypes. Empty and filled symbols distinguish samples treated with solvent or TGF-β1 for 72 h. C Heatmap showing differentially expressed genes in the indicated Sox11 WT and mutant organoid lines treated with solvent or TGF-β1 for 72 h. Genes with absolute values of log2 fold changes of expression > 1 and adjusted p values < 0.05 in any condition when comparing Sox11 WT and mutant organoid lines were extracted from the bulk RNA-seq results. Gene expression levels in counts per million (CPM) were then normalized by z-score transformation, sorted with a pre-determined number of 12 clusters, and visualized in the heatmap. Selected genes from clusters 1, 2, and 8 are shown next to the heatmap. Bold type identifies members of the Sox11 regulon with an importance score < 300. The color code indicates z-scores of the genes. D Pathway analyses. Differentially expressed genes from clusters 1, 2, and 8 in (C) were examined for enrichment of gene expression signatures from the MSigDB Hallmark and Reactomes datasets and the GO collections Biological Process, Cellular Component, and Molecular Function. Results of pathway analyses are given as combined scores based on adjusted p-values and odds ratios, which reflect the fraction of genes from a given gene set showing enrichment among DEGs versus the total number of genes in the respective set. Color codes indicate adjusted p values with Fisher’s exact test.
Fig. 6
Fig. 6. Higher SOX11 expression correlates with shorter survival times in colon and rectum adenocarcinomas.
A The gene expression matrices of colon adenocarcinoma (COAD) and rectum adenocarcinoma (READ) samples from the TCGA database were retrieved from the UCSC Xena browser, and SOX11 RNA expression values in combined COAD and READ cohorts were visualized as box plots. Black dots show SOX11 expression in individual samples. The box plots show the 26th to 75th percentiles of the data and the median. Statistical analyses were performed using Mann–Whitney U-test, ns: not significant. B COAD and READ gene expression matrices from the TCGA database were stratified according to tumor stages, and SOX11 expression levels in combined COAD and READ stage I, II, III, and IV primary tumors are displayed. Black dots show SOX11 expression in individual samples. Mann–Whitney U test, ns: not significant; *: p value < 0.05; **: p value < 0.01; ***: p value < 0.001. C Kaplan-Meier plots showing overall survival and disease-free interval associated with high [log2(FPKM-UQ + 1) > 3.842] and low [log2(FPKM-UQ + 1) < 3.842] SOX11 expression in TCGA COAD and READ cohorts. The p values were calculated by the log-rank method. D Correlation analyses of the expression of the genes indicated in combined transcriptomes of COAD and READ primary tumors. Each orange dot shows an individual sample. A linear regression line (red line), rank-based Spearman correlation coefficients, and p values are annotated in each plot. The pink shaded regions indicate 95% confidence intervals. Gene expression levels are given as log2(FPKM-UQ + 1) values. E Box plots visualizing expression of the genes indicated in CMS-stratified transcriptomes of COAD and READ primary tumors from the TCGA database. Each black dot shows an individual sample. The box plots show the 26th to 75th percentiles of the data and the median. Statistical analyses were performed using Mann–Whitney U-test; ***: p value < 0.001. NC not classifiable.

References

    1. Dongre A, Weinberg RA. New insights into the mechanisms of epithelial-mesenchymal transition and implications for cancer. Nat Rev Mol Cell Biol. 2019;20:69–84. - PubMed
    1. Pastushenko I, Blanpain C. EMT transition states during tumor progression and metastasis. Trends Cell Biol. 2019;29:212–26. - PubMed
    1. Pastushenko I, Brisebarre A, Sifrim A, Fioramonti M, Revenco T, Boumahdi S, et al. Identification of the tumour transition states occurring during EMT. Nature. 2018;556:463–8. - PubMed
    1. Puram SV, Tirosh I, Parikh AS, Patel AP, Yizhak K, Gillespie S, et al. Single-cell transcriptomic analysis of primary and metastatic tumor ecosystems in head and neck cancer. Cell. 2017;171:1611–24.e24. - PMC - PubMed
    1. Simeonov KP, Byrns CN, Clark ML, Norgard RJ, Martin B, Stanger BZ, et al. Single-cell lineage tracing of metastatic cancer reveals selection of hybrid EMT states. Cancer Cell. 2021;39:1150–62.e9. - PMC - PubMed

LinkOut - more resources