. 2025 May 20;16(1):4274.
doi: 10.1038/s41467-025-59531-6.

CREBBP inactivation sensitizes B cell acute lymphoblastic leukemia to ferroptotic cell death upon BCL2 inhibition

Affiliations

CREBBP inactivation sensitizes B cell acute lymphoblastic leukemia to ferroptotic cell death upon BCL2 inhibition

Alicia Garcia-Gimenez et al. Nat Commun. .

Abstract

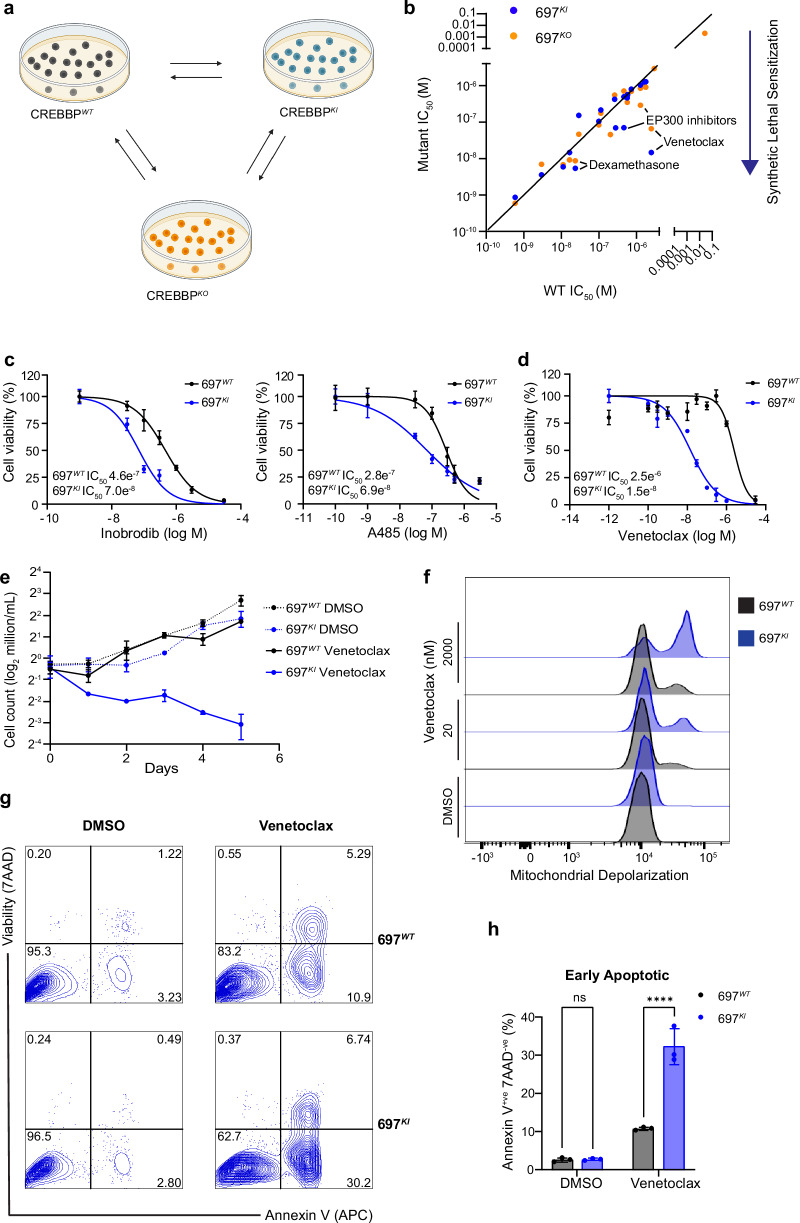
B-cell acute lymphoblastic leukemia (B-ALL) is a leading cause of death in childhood and outcomes in adults remain dismal. There is therefore an urgent clinical need for therapies that target the highest risk cases. Mutations in the histone acetyltransferase CREBBP confer high-risk and increased chemoresistance in ALL. Performing a targeted drug-screen in isogenic human cell lines, we identify a number of small molecules that specifically target CREBBP-mutated B-ALL, the most potent being the BCL2-inhibitor Venetoclax. Of note, this acts through a non-canonical mechanism resulting in ferroptotic rather than apoptotic cell death. CREBBP-mutated cell lines show differences in cell-cycle, metabolism, lipid composition and response to oxidative stress, predisposing them to ferroptosis, which are further dysregulated upon acquisition of Venetoclax resistance. Lastly, small-molecule inhibition of CREBBP pharmacocopies CREBBP-mutation, sensitizing B-ALL cells, regardless of genotype, to Venetoclax-induced ferroptosis in-vitro and in-vivo, providing a promising drug combination for broader clinical translation in B-ALL.


Conflict of interest statement

Competing interests: N.N. is a former employee of the Walter and Eliza Hall Institute which receives milestone and royalty payments related to Venetoclax. N.N. received payments from WEHI related to Venetoclax. The combination of BCL2 and CREBBP/EP300 inhibitors in ALL is protected under Cambridge Enterprise patent PCT/GB2024/052398 (S.E.R. and B.P.J.H. listed inventors). The remaining authors declare no competing interests.

Figures

Fig. 1
Fig. 1. CREBBP-mutated B-ALL cell lines show increased sensitivity to Venetoclax.
a Schematic of genome editing strategy used to engineer 697WT (black) into isogenic CREBBP 697KI (blue) and 697KO (yellow) clones. Created in BioRender. Huntly, B. (2025) https://BioRender.com/s71p510. b Cell-based drug screening was performed using a panel of 32 small molecule compounds predicted to have differential sensitivity between CREBBP WT and mutant lines. 72 h viability was measured by MTS assays using a wide concentration range between 3pM and 30 µM in n = 3 technical replicates and repeated using narrower concentration ranges to define IC50 where appropriate. Results are presented as an IC50 ratio of 697KI (blue) and 697KO (yellow) clones compared to WT. c Dose response curves of two CREBBP/EP300 inhibitors Inobrodib (left) and A485 (right) showing enhanced sensitivity of 697KI (blue) compared to 697WT (black) in 72 h MTS viability assay. n = 3 technical replicates, mean ± SD. d Dose response curve of 697WT (black) and 697KI (blue) lines to Venetoclax in 72 h MTS viability assay. n = 3 technical replicates, mean ± SD. e Growth curve of 697WT (black) and 697KI (blue) grown in the presence of either DMSO vehicle (dotted lines) or 20 nM Venetoclax (solid lines). n = 3 independent replicates, mean ± SD. f Mitochondrial depolarization as assessed by staining for JC1 by flow cytometry (488 nm 530/30) in response to DMSO vehicle, or Venetoclax at 20 or 2000nM in 697WT (black) and 697KI (blue) cell lines. g Representative flow cytometry plots of externalization of Annexin-V (reported by APC) in response to 24 h exposure to DMSO vehicle (left) or Venetoclax 20 nM (right) in 697WT (top) and 697KI (bottom) cell lines. Viability is assessed by 7AAD exclusion. h Proportion of viable 7AAD-veAnnexin-V+ve early apoptotic cells. n = 3 independent replicates. Mean ± SD, 2-way ANOVA ****, P = 0.000009. Source data are provided as a Source Data file.
Fig. 2
Fig. 2. Venetoclax exerts its effect on CREBBP-mutated B-ALL cell lines by on-target inhibition of BCL2.
a Schematic of doxycycline-inducible shRNA KD system competitive co-culture assay. 697WT and 697KI cells were stably transfected with two separate doxycycline-inducible shRNAs targeting BCL2, reported by mCherry, or a control shRNA targeting Renilla, reported by GFP. BCL2 and Renilla shRNA-expressing cells were mixed in equal numbers, doxycycline added to the media (500 ng/ml) to induce shRNA expression and the proportion of cells surviving BCL2/Renilla-KD analysed by daily flow cytometry. Created in BioRender. Huntly, B. (2025) https://BioRender.com/w63h764. b BCL2 shRNA KD competitive proliferation assay for two different BCL2-targeting shRNAs are presented, showing the ratio of BCL2-targeting shRNA (mCherry) vs. Renilla control (GFP), in 697KI normalized to 697WT as a percentage. n = 3 independent replicates, mean ± SD. c Representative flow cytometry plots of externalization of Annexin-V (APC) in 697WT (top) and 697KI (bottom) cell lines in response to doxycycline-induced shRNAs targeting Renilla (left), or two different BCL2-targeting shRNAs (middle and right). Day 6 post induction. Viability is assessed by 7AAD exclusion. d Proportion of viable 7AAD-veAnnexin-V+ve early apoptotic cells normalized to doxycycline-induced Renilla control. n = 3 independent replicates analysed 6 days after induction, mean ± SD, 2-way ANOVA ****, shRNA1 P = 0.0000003 and shRNA2 P = 0.00002. e Dose response curve of 697WT (black) and 697KI (blue) to Navitoclax in 72 h MTS viability assays. n = 3 technical replicates, mean ± SD. f Dose response curve of 697WT (black) and 697KI (blue) to A1155463 (BCLXL only inhibitor, left) and AZD5991 (MCL1 inhibitor, right) in 72 h MTS viability assays. n = 3 technical replicates, mean ± SD. Source data are provided as a Source Data file.
Fig. 3
Fig. 3. CREBBP-mutated B-ALL cell lines show significant cell cycle and metabolic dysregulation.
a Normalized read enrichments of CREBBP binding (dark) and H3K27ac marks (light) in 697WT (black) and 697KI (blue) centered on transcriptional start sites (TSSs), separated on up-regulated (left), non-differentially expressed (center) and down-regulated genes (right). b BETA analysis of association of CREBBP-bound H3K27-acetylated enhancers with gene targets, showing association for active differential gene expression in 697WT (top) and repressive differential gene expression in 697KI (bottom). Reported P values shown in legend. P values comparing the UP/DOWN and non-differentially expressed gene sets calculated using the Kolmogorov-Smirnov test. c Summary of most significantly down-regulated (left) and up-regulated (right) KEGG pathways from DEGs of RNAseq analysis comparing DMSO vehicle-treated 697KI with 697WT. d GSEA analysis of ranked genes of RNAseq analysis comparing DMSO vehicle-treated 697KI with 697WT. NES normalized enrichment score, FDR false discovery rate. e Comparison of BCL2 expression in 697WT (black) and 697KI (blue) cells by RNAseq. Each dot represents one sample. Bars show mean fragments per kilobase of transcript per million fragments mapped (FPKM) value ± SD, n = 3 independent replicates, significance calculated by two-tailed unpaired t test, **P = 0.0038. f Proliferation of untreated 697WT (black), 697KI (blue) and 697KO (yellow) cells measured by direct counting. n = 3 independent replicates, mean ± SD. g Analysis of cell cycle stage by FUCCI reporter system. Percentage cells in G1, Early S and G2-S-M phases in 697WT (black) and 697KI (blue) cells. n = 3 independent replicates, bar shows mean average ± SD; significance calculated by 2-way ANOVA, ****P = 0.00004, Early S P = 0.0498; G2-S-M P = 0.0342. h Comparison of CDKN2A expression in 697WT (black) and 697KI (blue) cells by RNAseq. Each dot represents one sample. Bars show mean FPKM value ± SD, n = 3 independent replicates, significance calculated by two-tailed unpaired t test, ***P = 0.0002. i Glycolytic rate measured by extracellular acidification rate (ECAR) in 697WT (black) and 697KI (blue) cells. Summary of maximal ECAR. Each dot represents a single replicate acquired from two separate experiments. Significance calculated by two-tailed unpaired t test, ****P < 1 × 10–15. j Mitochondrial oxygen consumption rate (OCR). Summary of basal OCR (left), maximal OCR (middle) and spare respiratory capacity (SRC) (right). Each dot represents a single replicate acquired from two separate experiments. Significance calculated by two-tailed unpaired t test, *, P = 0.0315; ****, Maximal respiration P = 6.2 × 10–12, SRC P = 7.3 × 10–7. Source data are provided as a Source Data file.
Fig. 4
Fig. 4. Venetoclax induces ferroptotic cell death in CREBBP-mutated B-ALL cell lines.
a Summary of most significantly down-regulated (top) and up-regulated (bottom) KEGG pathways from DEGs of RNAseq analysis comparing Venetoclax-treated 697KI with 697WT. b GSEA analysis of ranked genes of RNAseq analysis comparing Venetoclax-treated 697KI with 697WT. c Cellular viability assessed by flow cytometry of 697WT (left) and 697KI (right) cells treated with increasing doses of Venetoclax at 24 h either with exposure to the cell-permeant pan-caspase inhibitor Z-VAD (purple) or DMSO control (black). n = 3 independent replicates, analysed by 2-way ANOVA, ****, 697WT P = 0.000006; 697KI P = 0.0000008. d Cellular viability assessed by flow cytometry of 697WT (left) and 697KI (right) cells treated with increasing doses of Venetoclax at 24 h, either with exposure to the ferroptotic inhibitor Liproxstatin 1 (purple) or DMSO control (black). n = 3 independent replicates, analysed by 2-way ANOVA; ***P = 0.0004; ****P = 0.000004. e Lipid peroxidation in Venetoclax-treated 697WT (black), 697KI (blue) and 697KO (yellow) cells assessed by BODIPYC11 expressed as a ratio of FL1:FL3 (488 nm 530/30:610/20) mean fluorescence intensity (MFI) normalized to untreated cells. n = 3 independent replicates, each dot represents a single sample, mean ± SD, two-way ANOVA, ****, 697WT vs. 697KI,P = 0.000003, 697WT vs. 697KO, P = 4 × 10–4; *P = 0.0179. Source data are provided as a Source Data file.
Fig. 5
Fig. 5. CREBBP-mutation affects the redox balance and lipid content of B-ALL cell lines.
a Viability of 697WT (black) and 697KI (blue) cells following 48 h exposure to Erastin at 15 or 30 µM. Viability assessed by 7AAD exclusion using flow cytometry. n = 3 independent replicates, mean ± SD. Two-way ANOVA; *, P = 0.014. b Lipid peroxidation in RSL3-treated 697WT (black) and 697KI (blue) cells assessed by BODIPYC11 expressed as a ratio of FL1:FL3 MFI normalized to untreated cells. Mean ± SD n = 6 each dot represents an individual passage from two independent experiments performed on separate days. Two-way ANOVA, ****P = 0.0005. c Volcano plot of total proteomic analysis showing differential protein abundance in 697KI vs. 697WT (red=increased expression in 697KI). Two-sided limma statistical test. To control for the false discovery rate (FDR), p values were adjusted using the Benjamini-Hochberg method for multiple testing correction. n = 4 independent replicates. d Total lipidomic analysis showing the concentration of polyunsaturated structural lipids in 697WT (black) vs. 697KI (blue) (nmol/million cells). Degree of unsaturation is categorized on the x axis. n = 4 independent replicates, mean ± SEM. * p value < 0.05, **p value < 0.01, ***p value < 0.001. e Total lipidomic analysis showing the concentration of ether-linked lipids in 697WT (black) vs. 697KI (blue) (nmol/million cells). PE-O Alkyl Ether-Linked Phosphatidyl ethanolamine, PE-P Alkenyl Ether-Linked Phosphatidyl ethanolamine (Plasmalogen), PC-O Alkyl Ether-Linked Phosphatidylcholine, PC-P Alkenyl Ether-Linked Phosphatidylcholine (Plasmalogen). n = 4 independent replicates, mean ± SEM. * p value < 0.05, **p value < 0.01, ***p value < 0.001. f Two-sided Pearson correlation with p value adjusted for multiple testing using Bonferroni correction of gene sets for ferroptosis compared to CREBBP expression in patients with RNAseq data in the TARGET Phase 2 cohort. Each dot represents an individual patient (n = 203). g Two-sided Pearson correlation with p value adjusted for multiple testing using Bonferroni correction of RPKM-normalized gene expression compared to CREBBP expression from patients with RNA-seq data in the TARGET Phase 2 cohort (n = 203). Significantly correlated genes are highlighted in red (Padj < 0.05) with significantly correlated genes related to ferroptosis annotated. Source data are provided as a Source Data file.
Fig. 6
Fig. 6. Acquisition of Venetoclax resistance results in transcriptional convergence.
a Principal component analysis of global transcriptional profile by RNAseq of 697WT (black), 697KI (blue), 697WT-Res (gray) and 697KI-Res (pale blue) cells by RNAseq. n = 3 independent replicates, each dot represents one sample. b Lipid peroxidation in RSL3-treated 697WT (black plain), 697KI (blue plain), 697WT-Res (black hashed) and 697KI-Res (blue hashed) cells assessed by BODIPYC11 expressed as a ratio of FL1:FL3 MFI normalized to untreated cells and expressed as a percentage of parental 697WT. Mean ± SD n = 6 each dot represents an individual passage from two independent experiments performed on separate days. Two-way ANOVA. c Comparison of BCL2 expression levels in 697WT (black) and 697KI (blue) cells comparing parental and Venetoclax-resistant lines. Each dot represents one sample. Bars show mean FPKM value ± SD, n = 3 independent replicates. Two-way ANOVA, ****, 697WT P = 4.8 × 10–8 and 697KI P = 4 × 10–8. d GSEA of ranked RNAseq expression for E2F cell cycle signatures in 697WT-Res vs. 697WT (left), 697KI-Res vs. 697KI (middle) and 697KI-Res vs. 697WT-Res (right). e Comparison of CDKN1A (left) and CDKN2A (right) expression levels in 697WT (black) and 697KI (blue) cells comparing parental and Venetoclax-resistant lines. Each dot represents one sample. Bars show mean FPKM value ± SD, n = 3 independent replicates. Two-way ANOVA, ****, left: 697WT P = 6 × 10–8 and 697KI P = 1.1 × 10–8; right: 697WT P = 0.00006 and 697KI P = 4.9 × 10–8. f Summary of basal (left) and maximal (right) mitochondrial OCR in 697WT (black) and 697KI (blue) cells comparing parental and resistant lines. Each dot represents a single replicate acquired from two separate experiments. One way ANOVA, ****, left: 697WT vs. 697WT-Res P = 2.1 × 10−10, 697WT-Res vs. 697KI-Res P = 1.2 × 10–9, 697KI vs. 697KI-Res P = 1.9 × 10–11; right: 697WT vs. 697WT-Res P = 2 × 10–11, 697KI vs. 697KI-Res P = 2 × 10–11. g Summary of glycolytic rate (ECAR) in 697WT (black) and 697KI (blue) cells comparing parental and resistant lines. Each dot represents a single replicate acquired from two separate experiments. One way ANOVA, ****, 697WT vs. 697WT-Res P = 8.7 × 10–7, 697KI vs. 697KI-Res P < 1 × 10–15. Source data are provided as a Source Data file.
Fig. 7
Fig. 7. Acquisition of Venetoclax resistance sensitizes cells to Erastin.
a Comparison of VDAC1 expression levels by RNAseq in 697WT (black) and 697KI (blue) cells comparing parental and Venetoclax-resistant lines. Each dot represents one sample. Bars show mean FPKM value ± SD, n = 3 independent replicates. Two-way ANOVA, ****, 697WT P = 4.5 × 10–10 and 697KI P = 5 × 10–11. b Viability of 697WT (black), 697KI (blue) cells comparing parental (plain) and resistant (hashed) lines following 48 h exposure to Erastin at 15 or 30 µM. Viability assessed by 7AAD exclusion using flow cytometry. n = 3 independent replicates, mean ± SD. Two-way ANOVA, ****, 15 µM: 697WT vs. 697WT-Res P = 2.3 × 10–14, 697WT-Res vs. 697KI-Res P = 7.5 × 10–6, 697KI vs. 697KI-Res P = 2.4 × 10–14; 30 µM: 697WT vs. 697WT-Res P = 2.3 × 10–14, 697WT-Res vs. 697KI-Res P = 3.4 × 10–6, 697KI vs. 697KI-Res P = 2.3 × 10–14. c Three-dimensional diffusion plot of ZIP synergy score to combined doses of synchronous Erastin and Venetoclax in 697WT (left) (peak ZIP 41.37), 697WT-Res (middle) (peak ZIP 33.34)and 697KI-Res (right) (peak ZIP 22.69). Viability measured by 72 h MTS assay. Source data are provided as a Source Data file.
Fig. 8
Fig. 8. Pharmacological inhibition of CREBBP function can sensitize B-ALL cell lines to Venetoclax in-vitro.
a Dose response curve of 697WT (black) and 697WT pre-treated with 3 days of A485 (pale blue) to Venetoclax in 72 h MTS viability assays. n = 3 technical replicates, mean ± SD. b Three-dimensional diffusion plot of ZIP synergy score to combined doses of synchronous A485 and Venetoclax (peak ZIP 62.24) in 697WT cells. Viability measured by 72 h MTS assay. c Summary BODIPYC11 staining 697WT (black) and 697WT treated with A485 (pale blue) cells in response to Venetoclax. FL1:FL3 signal normalized to DMSO vehicle. n = 3 independent replicates, each dot represents a single sample, mean ± SD, two-way ANOVA, ***P = 0.0006, ****P = 1.2 × 10–6. d Summary of basal (left) and maximal (middle) mitochondrial oxygen consumption rate (OCR) and spare respiratory capacity (right) measured using Seahorse (Agilent) Mitostress test in 697WT cells treated with A485 (pale blue) or DMSO vehicle (black). Each dot represents a single replicate acquired from two separate experiments. Two-tailed unpaired t test ****, Basal respiration P = 9.2 × 10–8, Maximal respiration P = 5.5 × 10–8, SRC P = 7.3 × 10–7. e Growth curve of 697WT cells treated with Venetoclax 100 nM and/or A485 at two different doses (100 nM and 300 nM). Mean of duplicate independent replicates presented as log2 accumulative fold change. f Annexin-V (APC) externalization assessed by flow cytometry in 697WT cells treated with Venetoclax 100 nM and/or A485 at two different doses (100 nM and 300 nM). Duplicate measurements, each dot represents a single independent replicate, MFI ± SD normalized to DMSO control. g Dose response curve of NALM6WT (solid line) and NALM6WT pre-treated with 3 days of A485 (hashed line) to Venetoclax in 72 h MTS viability assays. n = 3 technical replicates, mean ± SD. h Summary BODIPYC11 staining NALM6WT (red) and NALM6WT treated with A485 (brown) cells in response to Venetoclax. FL1:FL3 signal normalized to DMSO vehicle. n = 3 independent replicates, each dot represents a single sample, mean ± SD, two-way ANOVA, ****1 µM P = 4.9 × 10–7, 10 µM P = 5.6 × 10–8, 30 µM P = 4 × 10–11. i Three-dimensional diffusion plot of ZIP synergy score to combined doses of A485 and Venetoclax. Viability measured by 72 h MTS assays in Venetoclax-sensitive cell lines: SUPB15 (BCR::ABL1) (peak ZIP 13.86), KOPN8 (MLL::ENL) (peak ZIP 12.66) and RS4-11 (MLL::AF4) (peak ZIP 27.08). Source data are provided as a Source Data file.
Fig. 9
Fig. 9. Genetic or pharmacological inhibition of CREBBP sensitizes B-ALL to Venetoclax in-vivo.
a Schema of 697WT vs. 697KI in vivo drug dosing protocol. NSG mice were intravenously injected with 697WT vs. 697KI luciferase-expressing cell lines. At 8 days post injection animals were administered Venetoclax (100 mg/kg) or vehicle control by oral gavage. Mice were imaged by BLI as indicated. n = 6 per group. Created in BioRender. Huntly, B. (2025) https://BioRender.com/7ikpp8s. b Representative BLI images of mice engrafted with 697WT cells at days 11 and 17 of treatment. n = 6 mice per group. c Average BLI radiance of mice engrafted with 697WT cells at days 11 and 17 of treatment (log p/s/cm2/sr). Mean ± SEM. n = 6 mice per group. d Representative BLI images of mice engrafted with 697KI cells at days 11, 17 and 21 of treatment. n = 6 mice per group. e Average BLI radiance of mice engrafted with 697KI cells at days 11, 17 and 21 of treatment (log p/s/cm2/sr). Mean ± SEM. Vehicle (n = 5) and Venetoclax treated (n = 6). f Overall survival of NSG mice engrafted with 697WT vs. 697KI B-ALL cells treated with oral Venetoclax (100 mg/kg) or vehicle control. 30 day maximal treatment window is indicated. n = 6 per group. Significance calculated by Mantel Cox log-rank test. g Overall survival of NSG mice engrafted with 697WT B-ALL cells treated with oral Inobrodib (20 mg/kg) or a combination of Inobrodib (20 mg/kg) plus Venetoclax (100 mg/kg) (n = 4 per group). Engraftment control groups were treated with Venetoclax only (n = 2) or vehicle control (n = 1). Treatment began at day 8 post-transplant. Significance calculated by Mantel Cox log-rank test. h Overall survival of NSG mice engrafted with CREBBP-mutated B-ALL high-risk PDX cells orally treated with Vehicle control (black, n = 5), Inobrodib (20 mg/kg) (green, n = 5), Venetoclax (100 mg/kg) (red, n = 7) or a combination of Inobrodib (blue, 20 mg/kg) plus Venetoclax (100 mg/kg) (n = 7). Treatment began at day 77 post-transplant for 3 consecutive days per week for up to 10 weeks. Significance calculated by Mantel Cox log-rank test, **P = 0.0063; **P = 0.0024;***P = 0.0003. Source data are provided as a Source Data file.

References

    1. Hunger, S. P. & Mullighan, C. G. Acute lymphoblastic leukemia in children. N. Engl. J. Med.373, 1541–1552 (2015). - PubMed
    1. Pasqualucci, L. et al. Inactivating mutations of acetyltransferase genes in B-cell lymphoma. Nature471, 189–195 (2011). - PMC - PubMed
    1. Horton, S. J. et al. Early loss of Crebbp confers malignant stem cell properties on lymphoid progenitors. Nat. Cell Biol.19, 1093–1104 (2017). - PMC - PubMed
    1. Mullighan, C. G. et al. CREBBP mutations in relapsed acute lymphoblastic leukaemia. Nature471, 235–239 (2011). - PMC - PubMed
    1. Brady, S. W. et al. The genomic landscape of pediatric acute lymphoblastic leukemia. Nat. Genet54, 1376–1389 (2022). - PMC - PubMed

MeSH terms

LinkOut - more resources