. 2025 May 21;16(1):4711.
doi: 10.1038/s41467-025-59923-8.

APOBEC affects tumor evolution and age at onset of lung cancer in smokers

Affiliations

APOBEC affects tumor evolution and age at onset of lung cancer in smokers

Tongwu Zhang et al. Nat Commun. .

Abstract

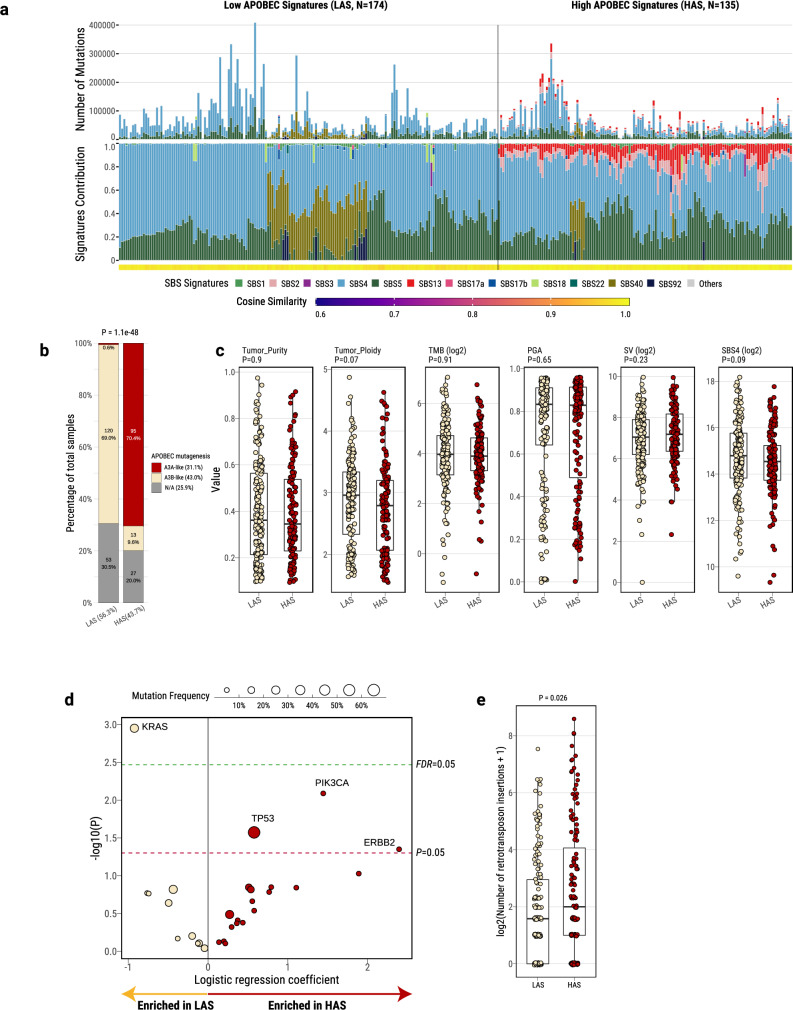
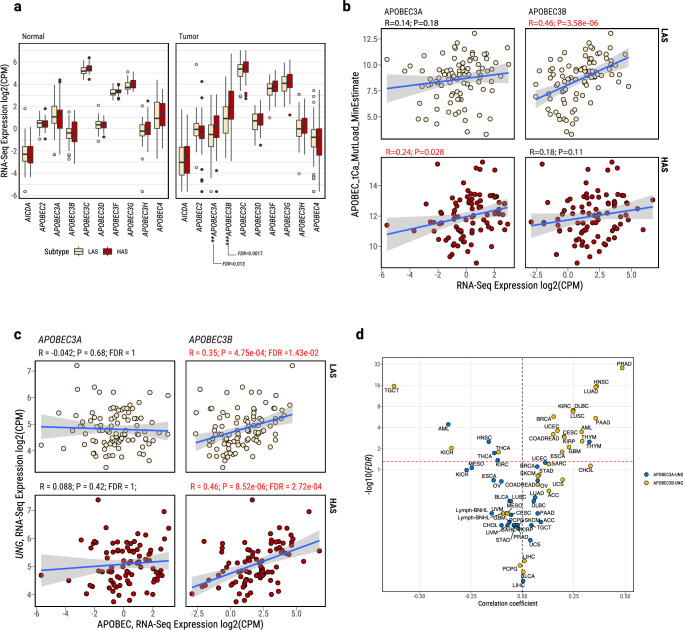
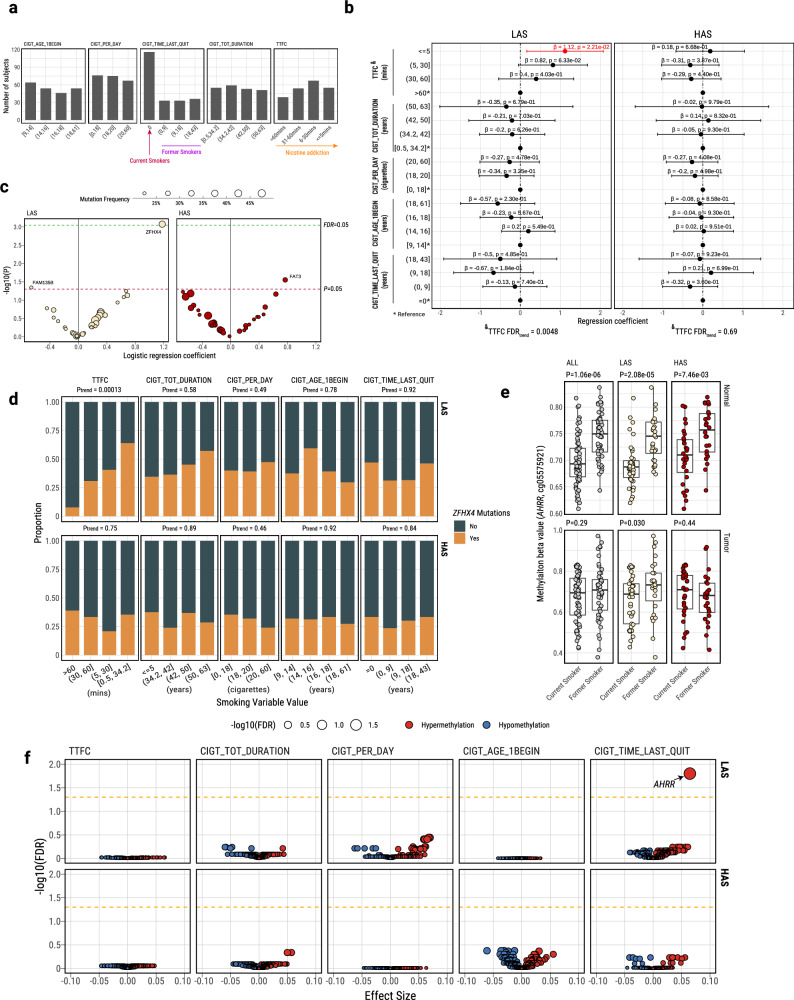
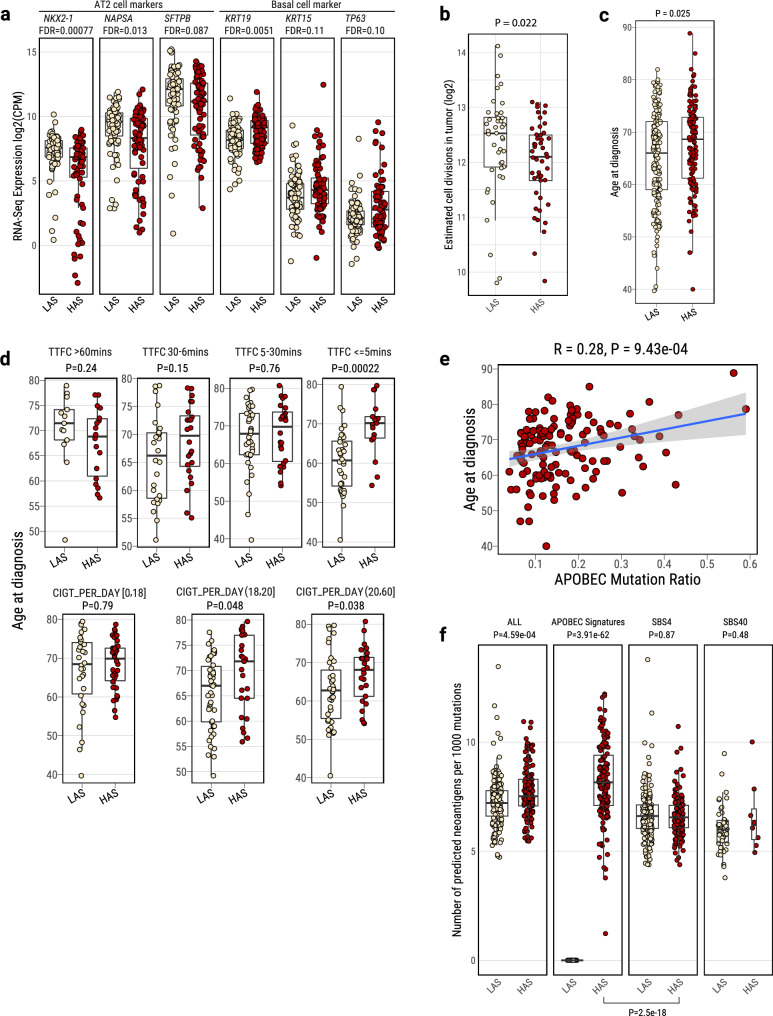
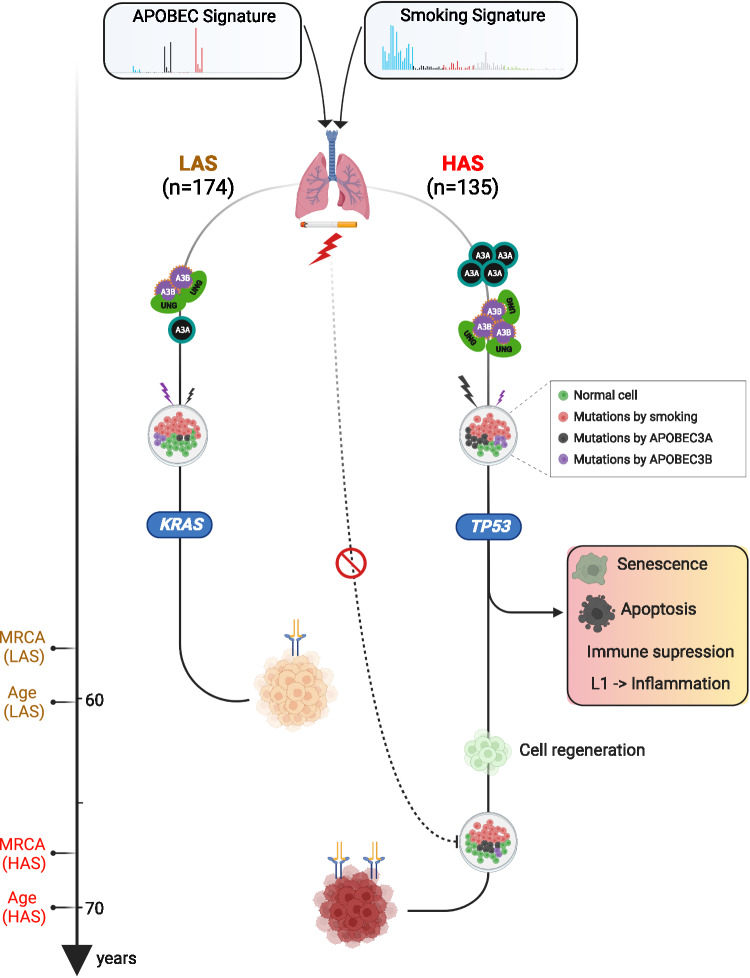
Most solid tumors harbor somatic mutations attributed to off-target activities of APOBEC3A (A3A) and/or APOBEC3B (A3B). However, how APOBEC3A/B enzymes affect tumor evolution in the presence of exogenous mutagenic processes is largely unknown. Here, multi-omics profiling of 309 lung cancers from smokers identifies two subtypes defined by low (LAS) and high (HAS) APOBEC mutagenesis. LAS are enriched for A3B-like mutagenesis and KRAS mutations; HAS for A3A-like mutagenesis and TP53 mutations. Compared to LAS, HAS have older age at onset and high proportions of newly generated progenitor-like cells likely due to the combined tobacco smoking- and APOBEC3A-associated DNA damage and apoptosis. Consistently, HAS exhibit high expression of pulmonary healing signaling pathway, stemness markers, distal cell-of-origin, more neoantigens, slower clonal expansion, but no smoking-associated genomic/epigenomic changes. With validation in 184 lung tumor samples, these findings show how heterogeneity in mutational burden across co-occurring mutational processes and cell types contributes to tumor development.


Conflict of interest statement

Competing interests: L.B.A. is a compensated consultant and has equity interest in io9, LLC. His spouse is an employee of Biotheranostics, Inc. L.B.A. is also an inventor of a US Patent 10,776,718 for source identification by non-negative matrix factorization. E.N.B. and L.B.A. declare U.S. provisional patent applications with serial numbers 63/289,601 and 63/269,033. L.B.A. also declares U.S. provisional patent applications with serial numbers: 63/366,392; 63/367,846; and 63/412,835. All other authors declare no competing interests.

Figures

Fig. 1
Fig. 1. Genomic classification and characterization of lung cancer in smokers based on mutational signatures analyses.
a Landscape of SBS mutational processes and identification of two tumor subtypes based on APOBEC mutational signatures. The landscape of mutational signatures includes a bar plot presenting the total number of mutations assigned to each signature, the proportion of signatures assigned to each sample, and the cosine similarity between the original mutation profile and the signature decomposition. b Proportions of A3A-like and A3B-like mutagenesis between LAS and HAS tumors. Tumors not enriched with TCA mutations or without significant differences between RTCA and YTCA mutations are classified as N/A. The P-values derived from the two-sided Chi-squared test are shown above the plots. c Comparison of genomic alterations and features between LAS (n = 174 tumors) and HAS (N = 135 tumors). The P-values derived from the two-sided Wilcoxon rank-sum test are shown above the plots. d Logistic regression analysis between tumor subtypes and nonsynonymous mutation status of driver genes, adjusting for the following covariates: age, sex, histology, TMB, and tumor purity. The significance thresholds P < 0.05 (red) and FDR < 0.05 (green) are indicated by the dashed lines. Multiple testing correction was performed using the Benjamini–Hochberg method. e Number of retrotransposon insertions in LAS (n = 174 tumors) and HAS (n = 135 tumors). The P-values derived from the two-sided Wilcoxon rank-sum test are shown above the plots. All box plots display the median (centerline), interquartile range (box), and whiskers extending to 1.5 × the interquartile range (IQR) by default in ggplot2. Each data point is plotted individually as a dot. Source data are provided as a Source Data file.
Fig. 2
Fig. 2. Characterization of APOBEC3A and APOBEC3B expression in lung cancers from smokers.
a Differentially expressed APOBEC family genes between LAS and HAS in both normal and tumor samples. Sample sizes are as follows: normal tissues—LAS (n = 45 samples), HAS (n = 34 samples); tumor tissues—LAS (n = 97 samples), HAS (n = 86 samples). After multiple testing corrections based on the Benjamini–Hochberg method, only APOBEC3A and APOBEC3B show significant differential expression between LAS and HAS tumors. Of note, APOBEC1 expression was extremely low across most tumor samples, thus it is not included in the analysis. b Correlation between minimal estimated APOBEC TCA mutational load from P-MACD and gene expression of APOBEC3A and APOBEC3B, stratified by LAS and HAS tumors. Pearson correlation coefficients and P-values are labeled above each plot and in red ink if P < 0.05. c Gene expression correlation between UNG and APOBEC3A (left) or APOBEC3B (right), stratified by LAS (top) and HAS (bottom) tumors. Significant P-values and Pearson correlation coefficients are shown on top of each scatter plot. FDR values were calculated using the Benjamini-Hochberg method based on 32 genes in the base excision repair pathway. d Validation of gene expression correlation between UNG and APOBEC3A and APOBEC3B in all TCGA cancer types. Volcano plot shows the correlations between UNG and APOBEC3A (blue) and between UNG and APOBEC3B (yellow). The suggested significance threshold (FDR = 0.05) is indicated by a dashed red line. All box plots display the median (centerline), interquartile range (box), and whiskers extending to 1.5 × the interquartile range (IQR) by default in ggplot2. Each data point is plotted individually as a dot. Cancer type abbreviations from the TCGA study can be found here: https://gdc.cancer.gov/resources-tcga-users/tcga-code-tables/tcga-study-abbreviations. In (b, c), the shaded area represents the 95% confidence level. Source data are provided as a Source Data file.
Fig. 3
Fig. 3. Multivariate regression analysis between five tobacco smoking variables and genomic or epigenomic features in the EAGLE samples.
a Distributions of the values of each smoking variable in the 218 EAGLE samples. b Forest plot for the associations between TMB and smoking variables, stratified by LAS (n = 114 tumors) and HAS (n = 84 tumors). P-values and regression coefficients with 95% confidence intervals (CIs) are shown for each category of smoking variables. Significant associations are highlighted in red. Trend test P-values, adjusted for multiple testing using the Benjamini–Hochberg method (FDRtrend) from associations between TTFC and TMB are included below the forest plots. Error bars represent 95% confidence intervals of the regression coefficients. c Volcano plot shows the association between each TTFC category and the mutation status of commonly mutated genes (Frequency > 20%). We performed logistic regression analyses between LAS and HAS tumors. The size of each point on the volcano plot indicates the overall gene mutation frequency. The red and green dashed line indicates the association significance threshold P = 0.05, and FDR = 0.05, respectively. d Example of an association between each TTFC category and ZFHX4 mutation frequency stratified by LAS and HAS subtypes. Trend test P-values (Ptrend) are labeled above each subplot. e Multivariate regression analysis of the DNA methylation level at CpG probe cg05575921 within the AHRR gene and smoking status, conducted in tumor (n = 116 samples) and normal (n = 119 samples) EAGLE tissue samples. The association analyses are performed on all tumors and separately between LAS and HAS tumor subtypes. Trend test P-values (Ptrend) are labeled above each subplot. f Volcano plots of the associations between smoking variables and methylation levels of known smoking-related CpG probes (n = 116 tumors). Association FDR values (adjusted using the Benjamini-Hochberg method) are shown on the y-axis. The orange dashed line indicates the associations with FDR < 0.05. The CpG probes associated with tobacco smoking are derived from a study comparing methylation levels between smokers and never smokers in normal lung tissue. The size and color of each point represent the FDR and association direction, respectively. All association analyses are adjusted for the following covariates: age, sex, histology, and tumor purity. All box plots display the median (centerline), interquartile range (box), and whiskers extending to 1.5 × the interquartile range (IQR) by default in ggplot2. Each data point is plotted individually as a dot. Source data are provided as a Source Data file.
Fig. 4
Fig. 4. Tumor cell composition and age at onset differences between LAS and HAS tumors.
a Boxplots show the differential expression of gene markers specific to lung cell types in LUAD tumors, comparing LAS (n = 84 tumors) and HAS (n = 71 tumors). b Cumulative number of stem cell division estimates in LAS and HAS tumors based on methylation data (LAS: n = 43 tumors; HAS: n = 47 tumors). c, d Age at diagnosis difference between LAS and HAS tumors overall (c), and (d) stratified by TTFC [Time to first cigarette in the morning (from the first question of the Fagerstrom test for nicotine dependence: ‘How soon after you wake up do you smoke your first cigarette?’)] or CIGT_PER_DAY (Average intensity of cigarette smoking, measured as the number of cigarettes per day). Sample sizes: overall—LAS (n = 174 tumors), HAS (n = 135 tumors); with TTFC data—LAS (n = 112 tumors), HAS (n = 83 tumors); with CIGT_PER_DAY data—LAS (n = 114 tumors), HAS (n = 84 tumors). e Correlation between APOBEC mutation ratio and age at diagnosis in HAS tumor. The shaded area represents the 95% confidence level. f Neoantigen prediction for different mutational signatures between LAS and HAS. Sample sizes: overall—LAS (n = 174 tumors), HAS (n = 135 tumors); with SBS4 signature—LAS (n = 174 tumors), HAS (n = 135 tumors); with APOBEC signature—LAS (n = 0 tumors), HAS (n = 135 tumors); with SBS40 signature—LAS (n = 46 tumors), HAS (n = 8 tumors). P-values from the two-sided Wilcoxon rank-sum test are labeled for each boxplot. On the bottom, P-value for the different contributions of SBS4 and APOBEC mutational signatures to neoantigen prediction in HAS tumors. All box plots display the median (centerline), interquartile range (box), and whiskers extending to 1.5 × the interquartile range (IQR) by default in ggplot2. Each data point is plotted individually as a dot. Source data are provided as a Source Data file.
Fig. 5
Fig. 5. Conceptual diagram of APOBEC shaping tumor development and influencing age at onset of lung cancers from smokers.
The schematic was generated using BioRender (https://biorender.com/).

Update of

Similar articles

Cited by

  • Tobacco smoke carcinogens exacerbate APOBEC mutagenesis and carcinogenesis.
    Durfee C, Bergstrom EN, Díaz-Gay M, Zhou Y, Temiz NA, Ibrahim MA, Nandi SP, Wang Y, Liu X, Steele CD, Proehl J, Vogel RI, Argyris PP, Alexandrov LB, Harris RS. Durfee C, et al. Res Sq [Preprint]. 2025 Jun 3:rs.3.rs-5843684. doi: 10.21203/rs.3.rs-5843684/v1. Res Sq. 2025. PMID: 40502742 Free PMC article. Preprint.
  • Tobacco smoke carcinogens exacerbate APOBEC mutagenesis and carcinogenesis.
    Durfee C, Bergstrom EN, Díaz-Gay M, Zhou Y, Temiz NA, Ibrahim MA, Nandi SP, Wang Y, Liu X, Steele CD, Proehl J, Vogel RI, Argyris PP, Alexandrov LB, Harris RS. Durfee C, et al. bioRxiv [Preprint]. 2025 Jan 22:2025.01.18.633716. doi: 10.1101/2025.01.18.633716. bioRxiv. 2025. PMID: 39896515 Free PMC article. Preprint.
  • The mutagenic forces shaping the genomic landscape of lung cancer in never smokers.
    Díaz-Gay M, Zhang T, Hoang PH, Khandekar A, Zhao W, Steele CD, Otlu B, Nandi SP, Vangara R, Bergstrom EN, Kazachkova M, Pich O, Swanton C, Hsiung CA, Chang IS, Wong MP, Leung KC, Sang J, McElderry J, Yang L, Nowak MA, Shi J, Rothman N, Wedge DC, Homer R, Yang SR, Lan Q, Zhu B, Chanock SJ, Alexandrov LB, Landi MT. Díaz-Gay M, et al. medRxiv [Preprint]. 2024 May 17:2024.05.15.24307318. doi: 10.1101/2024.05.15.24307318. medRxiv. 2024. PMID: 38798417 Free PMC article. Preprint.
  • The mutagenic forces shaping the genomes of lung cancer in never smokers.
    Díaz-Gay M, Zhang T, Hoang PH, Leduc C, Baine MK, Travis WD, Sholl LM, Joubert P, Khandekar A, Zhao W, Steele CD, Otlu B, Nandi SP, Vangara R, Bergstrom EN, Kazachkova M, Pich O, Swanton C, Hsiung CA, Chang IS, Wong MP, Leung KC, Sang J, McElderry JP, Hartman C, Colón-Matos FJ, Miraftab M, Saha M, Lee OW, Jones KM, Gallego-García P, Yang Y, Zhong X, Edell ES, Santamaría JM, Schabath MB, Yendamuri SS, Manczuk M, Lissowska J, Świątkowska B, Mukeria A, Shangina O, Zaridze D, Holcatova I, Mates D, Milosavljevic S, Kontic M, Bossé Y, Rothberg BEG, Christiani DC, Gaborieau V, Brennan P, Liu G, Hofman P, Yang L, Nowak MA, Shi J, Rothman N, Wedge DC, Homer R, Yang SR, Pesatori AC, Consonni D, Lan Q, Zhu B, Chanock SJ, Choi J, Alexandrov LB, Landi MT. Díaz-Gay M, et al. Nature. 2025 Aug;644(8075):133-144. doi: 10.1038/s41586-025-09219-0. Epub 2025 Jul 2. Nature. 2025. PMID: 40604281

References

    1. Stratton, M. R., Campbell, P. J. & Futreal, P. A. The cancer genome. Nature458, 719–724 (2009). - PMC - PubMed
    1. Alexandrov, L. B. & Stratton, M. R. Mutational signatures: the patterns of somatic mutations hidden in cancer genomes. Curr. Opin. Genet. Dev.24, 52–60 (2014). - PMC - PubMed
    1. Alexandrov, L. B. et al. The repertoire of mutational signatures in human cancer. Nature578, 94–101 (2020). - PMC - PubMed
    1. Koh, G., Degasperi, A., Zou, X., Momen, S. & Nik-Zainal, S. Mutational signatures: emerging concepts, caveats and clinical applications. Nat. Rev. Cancer21, 619–637 (2021). - PubMed
    1. Roberts, S. A. et al. An APOBEC cytidine deaminase mutagenesis pattern is widespread in human cancers. Nat. Genet.45, 970–976 (2013). - PMC - PubMed

MeSH terms