. 2025 May 20;16(1):4681.
doi: 10.1038/s41467-025-59381-2.

Histone methyltransferase ASH1L primes metastases and metabolic reprogramming of macrophages in the bone niche

Affiliations

Histone methyltransferase ASH1L primes metastases and metabolic reprogramming of macrophages in the bone niche

Chenling Meng et al. Nat Commun. .

Abstract

Bone metastasis is a major cause of cancer death; however, the epigenetic determinants driving this process remain elusive. Here, we report that histone methyltransferase ASH1L is genetically amplified and is required for bone metastasis in men with prostate cancer. ASH1L rewires histone methylations and cooperates with HIF-1α to induce pro-metastatic transcriptome in invading cancer cells, resulting in monocyte differentiation into lipid-associated macrophage (LA-TAM) and enhancing their pro-tumoral phenotype in the metastatic bone niche. We identified IGF-2 as a direct target of ASH1L/HIF-1α and mediates LA-TAMs' differentiation and phenotypic changes by reprogramming oxidative phosphorylation. Pharmacologic inhibition of the ASH1L-HIF-1α-macrophages axis elicits robust anti-metastasis responses in preclinical models. Our study demonstrates epigenetic alterations in cancer cells reprogram metabolism and features of myeloid components, facilitating metastatic outgrowth. It establishes ASH1L as an epigenetic driver priming metastasis and macrophage plasticity in the bone niche, providing a bona fide therapeutic target in metastatic malignancies.


Conflict of interest statement

Competing interests: The authors declare no competing interests.

Figures
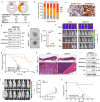
Fig. 1
Fig. 1. ASH1L promotes cancer invasiveness and bone metastasis.
a The percentages of genetic alterations of ASH1L in human localized (TCGA) and metastatic (SU2C) PCa samples. b Correlation of ASH1L protein expression with Gleason grade in human prostate tumors. The staining intensity of nuclear ASH1L was scored from 0 to 2. The Pearson correlation coefficient (r) and two-tailed P value are shown. c IHC staining of ASH1L in primary and lymph node (LN) metastatic tumors derived from Pb-Cre; PtenL/L; Trp53L/L; Smad4L/L; mTmG (PbPPS) mice. Scale bar = 20 μm. d Western blot analysis of the indicated proteins in control and ASH1L-depleted PC-3M cells. Two sgRNAs were used for CRISPR-Cas9-mediated ASH1L knockout. The samples were derived from the same experiment, but different gels for ASH1L and Actin, another for H3, another for H3K4me3, and another for H3K36me3 were processed in parallel. e 3D sphere invasion assays of control and ASH1L-depleted PC-3M cells (n = 3 biological replicates/group). Scale bar = 100 μm. f Control and ASH1L-depleted PC-3M cells expressing firefly luciferase and RFP were intracardially injected into male nude mice. In vivo bioluminescence images of mice over time are shown. g Kaplan–Meier analysis of the overall survival of mice. The log-rank (Mantel-Cox) test was used for statistical analysis. n = 12, 7, and 9 mice per group, as indicated. h H&E staining of bone tissues from mice transplanted with control and ASH1L-depletion PC-3M cells. Scale bar = 2 mm (upper), and 300 μm (bottom). T Tumor, B Bone. i Western blot analysis of indicated histone marks in LNCaP cells overexpressing HA-tagged ASH1L-F3. The samples were derived from the same experiment, but different gels for HA, another for H3, another for H3K4me3, another for H3K36me2, and another for H3K36me3 were processed in parallel. j Control and ASH1L-F3-overexpressed LNCaP cells (Luc-RFP+) were injected into the tibias of one leg of nude male mice at 6 weeks of age. Bioluminescence images and BLI intensity quantification of bone tumors over time are shown (n = 6 mice per group). k Kaplan–Meier analysis of overall survival of mice. The log-rank (Mantel-Cox) test was used for statistical analysis. Statistical significance was determined by unpaired two-tailed T-test (j) or one-way ANOVA with Tukey’s post hoc test (e). Data in e, j represent the mean ± standard deviation. The experiments in d, i were repeated independently three times, yielding similar results. Source data are provided as a Source Data file.
Fig. 2
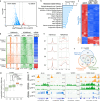
Fig. 2. ASH1L reprograms pro-metastatic transcriptome via modulating methylations at H3K4 and H3K36.
a Volcano plot illustrating differentially expressed genes (DEGs) in ASH1L-depleted (sg#2) versus control PC-3M. Blue: downregulated genes upon ASH1L-depletion; Red: upregulated genes. Horizontal line: FDR = 0.05; Vertical line: fold change (FC) = 2. b Pathway analysis of DEGs using IPA. P values were determined by one-sided Fisher’s exact test. c Heatmap displaying the relative expression of DEGs in control (sgCtrl) versus ASH1L-knockout PC-3M cells mediated by two sgRNAs (sg#2 and sg#3). d Heatmaps illustrating the signal of H3K4me3 (orange) and H3K36me3 (green) marks over Transcription start sites (TSS) or body of genes in control and ASH1L-depleted PC-3M cells, determined by CUT&RUN. Genes were grouped into five clusters (C1–C5) by changes in H3K4me3 and H3K36me3 signals upon ASH1L depletion. % of genes in each cluster is shown. The right column, color-coded in red (upregulated) or blue (downregulated), represents the log2FC of gene expression in sgASH1L#2 versus sgCtrl cells (RNA-seq). e Metaplots illustrating the average signal distribution of H3K4me3 (left) and H3K36me3 (right) over genes in C1-C4. The signals in control (gray) and ASH1L-depleted (red) PC-3M cells are compared. TSS and transcript end sites (TES) are indicated. f Venn diagram displaying the overlap of genes with decreased H3K4me3 (FDR ≤0.05; FC ≥1.5), genes with decreased H3K36me3 (FDR ≤0.05; FC ≥1.5), and expression downregulated genes (both sgRNAs; FDR ≤0.05; FC ≥1.5) upon ASH1L depletion. P values were calculated using two-sided Fisher’s exact test. g Box plots illustrating the log2FC of gene expression in sgASH1L#2 versus sgCtrl cells for the five clusters. Each box represents the interquartile range (IQR; 25th to 75th percentile). Centerline indicates median; Whiskers extend to the most extreme data points within 1.5×IQR. P values were calculated using two-sided unpaired Welch’s t-tests. n = 580 genes (C1); n = 1042 genes (C2); n = 750 genes (C3); n = 384 genes; n = 16875 genes (C5). h Representative CUT&RUN tracks illustrating the enrichments of H3K4me3 (orange) and H3K36me3 (green) at the indicated gene loci in control and ASH1L-depleted PC-3M cells, with corresponding RNA-Seq tracks (blue) for the indicated genes. Source data are provided as a Source Data file.
Fig. 3
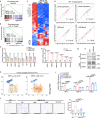
Fig. 3. ASH1L co-opts with HIF-1α to induce pro-metastatic genes and enhance invasiveness.
a, b GSEA demonstrating the downregulation of hypoxia-associated genes and HIF-1α target genes upon ASH1L depletion. The normalized enrichment score (NES) and nominal p value (NOM P) are indicated. c Heatmap displaying the relative expression of HIF-1α target genes in control versus ASH1L-depleted PC-3M. d Scatter plots demonstrating the changes in gene expression, H3K4me3, and H3K36me3 marks of HIF-1α target genes upon ASH1L depletion. Genes with downregulated signals (FDR ≤0.05) are highlighted in red. Dotted lines: FC = 1.5. e Expression of metastasis-associated HIF-1α targets in control and ASH1L-depleted PC-3M, determined by qPCR. n = 3 biological replicates per group. f LNCaP cells overexpressing ASH1L-F3 were treated with CoCl2 (200uM) for 24 h to mimic hypoxia conditions. mRNA expression of the indicated genes was determined by qPCR. n = 3 biological replicates per group. g Endogenous co-IP of ASH1L and HIF-1α in PC-3M cells treated with 20 μM MG132 for 8 h, followed by Western blot analysis. The samples were derived from the same experiment, but different gels for ASH1L and another for HIF1A were processed in parallel. h tSNE views of 23,651 epithelial cells from human PCa samples (GSE141445; n = 13 patients), color-coded by the count of HIF-1α target genes. 13 PCa patients were classified into two groups (ASH1L_Low vs ASH1L_High) by ASH1L expression levels in epithelial cells. i Control or ASH1L-F3-overexpressing LNCaP cells were transfected with siRNA targeting HIF1A in the presence of CoCl2 (200uM). mRNA expression of the indicated genes was determined. n = 3 biological replicates per group. j Control and ASH1L-F3-overexpressing LNCaP cells were treated with Vehicle (Veh) or HIF-1α inhibitors LW6 (15 μM), 2-MeOE2 (2-ME, 25 μM), or PX-478 (20 μM) for 48 h in the presence of CoCl2 (200uM), followed by migration assays. n = 3 biological replicates per group. Scale bar = 1000 μm. Statistical significance was determined by unpaired two-tailed T-test (f) or one-way ANOVA with Tukey’s post hoc test (e, i, j). Data in e, i, j represent the mean ± standard deviation. The experiments in (g) were repeated independently three times, yielding similar results. Source data are provided as a Source Data file.
Fig. 4
Fig. 4. Loss of ASH1L impairs bone tumor outgrowth and bone niche remodeling.
a Schematics of DX1-derived bone metastasis model. Control or ASH1L-depleted DX1 cells expressing firefly luciferase were injected into the tibia of one leg of C57BL/6 J male mice. Created in BioRender. Meng, C. (2025) https://BioRender.com/wzb1hcr. b Bioluminescence images and BLI intensity quantification of bone tumors over time are shown. n = 15 mice (sgCtrl), 10 mice (sg#3) or 7 mice (sg#5). c Representative images of X-Ray imaging, H&E, Tartrate-resistant acid phosphatase (TRAP), and Toluidine blue staining of bone tumors. Scale bar = 300 μm for H&E; Scale bar = 200 μm for TRAP; Scale bar = 50 μm for Toluidine blue. CB cortical bone, WB woven bone. d, e Quantification of cortical bone (d) and new woven bone (e) volume fraction from control (n = 5 mice) and ASH1L-depleted (n = 7 mice) bone tumors. Cortical BV/TV (%): percentage of cortical bone volume in the entire tibia tissue area; Woven BV/TV (%): percentage of new woven bone volume in bone formation tissue area (see more details in Fig. S6a). f, g Quantification of osteoclasts (f) and osteoblasts (g) in new woven bone tissues from control (n = 6 mice) and ASH1L-depleted (n = 9 mice) bone tumors. Blue and red arrows indicate osteoclasts and osteoblasts, respectively. hl ScRNA-seq was performed in control (n = 3 mice) and ASH1L-depleted (n = 4 mice) bone tumors. PTPRC+ immune cells were subclustered and analyzed. tSNE views of 17,423 immune cells color-coded by nine subclusters (C1-C9, h) or two groups (j) are presented. The bubble plot presents marker gene expression for each immune cell subcluster (i), where dot size and color represent the percentage of marker gene expression (Percentage) and the averaged scaled expression (Average) value, respectively. Immune cell composition distribution (k) and percentage comparison (l) of nine subclusters among seven samples. TAM tumor-associated macrophage, DC dendritic cell. Statistical significance was determined by unpaired two-tailed T-test (dg, l) or one-way ANOVA with Tukey’s post hoc test (b). Data in b, dg, l represent the mean ± standard deviation. Source data are provided as a Source Data file.
Fig. 5
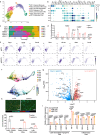
Fig. 5. Single-cell transcriptome profiling reveals ASH1L induces macrophage plasticity in metastatic bone niche.
a The UMAP view of 3046 Monocytes and TAMs color-coded by seven subclusters (MC1-MC7) is presented with the nomination of each subcluster. b The bubble plot presents marker gene expression for each subcluster, where dot size and color represent the percentage of marker gene expression (Percentage) and the averaged scaled expression (Average) value, respectively. c, d Composition distribution (c) and percentage comparison (d) of seven monocyte/TAM subclusters among samples. n = 3 mice for control group, n = 4 mice for ASH1L-depleted group. e UMAP views of TAMs from control versus ASH1L-depleted bone tumors, color-coded by expression of indicated genes. f Single-cell trajectory and pseudotime analysis of monocytes and TAMs. The UMAP views are color-coded by seven subclusters (left) and pseudotime (right). g Volcano plot of the differentially expressed genes (DEGs, FDR <0.05) in monocytes and TAMs in ASH1L-depleted versus control tumors. Blue dots indicate the downregulated genes in TAMs upon ASH1L depletion in DX-derived bone tumors, while red dots indicate the upregulated genes (fold change [FC] >1.5). Gray dots present the genes FC <1.5. h Representative images (enlarged) and quantifications of pro-tumoral TAMs (F4-80+CD206+), pro-inflammatory TAMs (F4-80+CD206-), and monocytes (LY6C+) in control and ASH1L-knockdown metastatic bone tumors, determined by multiplex IHC staining. Scale bar = 50 μm. n = 3 mice per group. i Human monocytes were isolated from blood, induced by M-CSF (50 ng/ml) for 5 days, and then co-cultured with conditional medium (CM) derived from control and ASH1L-depleted PC-3M cells for 48 h. Marker gene expression was analyzed using qPCR. GAPDH was used as a loading control. n = 3 biological replicates per group. Statistical significance was determined by unpaired two-tailed T-test (d, h) or one-way ANOVA with Tukey’s post hoc test (i). Data in d, h, i represent the mean ± standard deviation. Source data are provided as a Source Data file.
Fig. 6
Fig. 6. ASH1L induces lipid-associated TAMs by promoting IGF-2-mediated oxidative phosphorylation.
a Pathway analysis of DEGs (FDR <0.05; FC >1.5) in TAMs in ASH1L-depleted versus control tumors using IPA. The activation Z-scores indicate the activation states of biological functions of each pathway. Blue bars indicate the downregulated pathways upon ASH1L depletion; Red bars indicate the upregulated pathways. b UMAP views of monocytes and TAMs from control versus ASH1L-depleted bone tumors, color-coded by the count of signature genes in oxidative phosphorylation (OXPHOS) pathways. c Venn diagram displaying the HIF-1α direct target genes that are significantly downregulated in PC-3M upon ASH1L depletion (Blue circle, RNA-seq FDR <0.05; FC >2), exhibit decreased H3K4me3 and/or H3K36me3 marks upon ASH1L depletion (Orange circle, CUT&RUN FDR ≤0.05; FC ≥1.5), and associated with TAM function modulation (Green circle). d Representative CUT&RUN tracks illustrating the enrichments of H3K4me3 (orange) and H3K36me3 (green) at IGF-1 and IGF-2 gene loci in control and ASH1L-depleted PC-3M cells, with corresponding RNA-Seq tracks (blue). e, f mRNA expression of IGF-2 in ASH1L-depleted PC-3M cells (e) or ASH1L-overexpressing LNCaP cells in the presence of CoCl2 (200uM) (f), determined by qPCR. n = 3 biological replicates per group. g Schematics of OXPHOS pathway genes downregulated in TAMs upon ASH1L depletion in cancer cells (FDR <0.05; FC >1.5). Created in BioRender. Meng, C. (2025) https://BioRender.com/5we2ig4. h Human monocytes were isolated from blood and co-cultured with conditional medium from control and ASH1L-depleted PC-3M cells for 48 h, with or without recombinant protein of human IGF-2 (10 ng/ml). The expression of indicated genes was determined by qPCR. n = 3 biological replicates per group. Data in e, f, h represents the mean ± standard deviation. Statistical significance was determined by unpaired two-tailed T-test (f) or one-way ANOVA with Tukey’s post hoc test (e, h). Source data are provided as a Source Data file.
Fig. 7
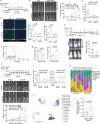
Fig. 7. Inhibition of the ASH1L-HIF-1α-TAM axis suppresses bone metastases of PCa.
a Schematics of experimental design. 5 × 105 control and ASH1L-knockdown DX1 cells were injected into the tibia of C57BL/6 J male mice, followed by macrophage blockade using CSF1R or IgG antibodies (i.p., 300 μg/injection). Created in BioRender. Meng, C. (2025) https://BioRender.com/xsz0qzx. b Bioluminescence images and intensity quantification of bone tumors over time are shown. n = 5 mice/group. c Quantification of bone tumor weight at the endpoint. d Representative immunofluorescent images (enlarged, left) and quantifications of TAMs (right) in bone tumors. n = 3 mice/group. Scale bar = 50 μm. e 2 × 106 PC-3M cells were intracardiac injected into male nude mice, followed by treatment of vehicle or ASH1L inhibitor AS-99 (i.p., 25 mg/kg). Bioluminescent imaging and intensity quantification of metastatic tumors on Day 34 are presented (n = 7 mice/group). Created in BioRender. Meng, C. (2025) https://BioRender.com/2ngdt7t. f Overall survival of tumor-bearing mice. g Multiplex IHC staining of TAMs in bone tumors. n = 3 mice/group. h 5 × 105 control and ASH1L-depleted DX1 cells were injected into the tibia of C57BL/6J male mice, followed by treatment of vehicle or HIF-1α inhibitor PX-478 (i.p.,40 mg/kg). Created in BioRender. Meng, C. (2025) https://BioRender.com/bwpla4s. Bioluminescence images and intensity quantification of bone tumors over time are shown. n = 7, 6, 9, and 7 mice/group as indicated. i Multiplex IHC staining of pro-tumoral and pro-inflammatory TAMs in bone tumors. n = 3 mice/group. jl Single-cell transcriptomic analysis of human PCa metastatic tumors (GSE210358; n = 13 patients). j The UMAP view of 24,433 non-epithelial cells, color-coded by 18 subclusters with cell-type assignment. LA-TAM lipid-associated TAM, CAF cancer-associated fibroblast, EC endothelial cells. k Composition distribution of major cell types among 13 samples grouped by ASH1L expression in epithelial cells. l Fraction of LA-TAMs in total non-epithelial cells from metastatic tumors with low versus high ASH1L expression (Low n = 8; High n = 5). Statistical significance was determined by unpaired two-tailed T-test (e, g, l), one-way ANOVA with Tukey’s post hoc test (bd, h, i), or log-rank (Mantel-Cox) test (f). Data in ce, gi, l represents the mean ± standard deviation. Source data are provided as a Source Data file.
Fig. 8
Fig. 8. Schematic of working model.
Histone methyltransferase ASH1L is genetically amplified and overexpressed in metastatic cells and promotes H3K4me3 and H3K36me2/3 on HIF-1α target genes. ASH1L cooperates with HIF-1α to induce pro-metastatic genes, including MMPs, VEGF, SNAI, and PLAU, facilitating cancer cell invasiveness. Besides, the regulatory axis of ASH1L-IGF-2 in metastatic cells induces lipid-associated TAMs (LA-TAMs) and maintains their pro-tumoral and anti-inflammatory phenotypes by enhancing oxidative phosphorylation (OXPHOS). As an epigenetic determinant in metastatic cancers, ASH1L plays vital cell-intrinsic and -extrinsic roles in priming metastasis and reshaping the immune landscape in the bone niche. Pharmacologic inhibition of ASH1L using small molecular compound AS-99 axis elicits anti-metastasis responses. Schematic of the working model created in BioRender. Meng, C. (2025) https://BioRender.com/el9a9q1.

References

    1. Gupta, G. P. & Massague, J. Cancer metastasis: building a framework. Cell127, 679–695 (2006). - PubMed
    1. Grasso, C. S. et al. The mutational landscape of lethal castration-resistant prostate cancer. Nature487, 239–243 (2012). - PMC - PubMed
    1. Abida, W. et al. Genomic correlates of clinical outcome in advanced prostate cancer. Proc. Natl Acad. Sci. USA116, 11428–11436 (2019). - PMC - PubMed
    1. Stopsack, K. H. et al. Oncogenic genomic alterations, clinical phenotypes, and outcomes in metastatic castration-sensitive for prostate cancer. Clin. Cancer Res.26, 3230–3238 (2020). - PMC - PubMed
    1. Wang, G., Zhao, D., Spring, D. J. & DePinho, R. A. Genetics and biology of prostate cancer. Genes Dev.32, 1105–1140 (2018). - PMC - PubMed

MeSH terms

Substances