. 2025 May 20;15(1):17525.
doi: 10.1038/s41598-025-01427-y.

The unique hypertrophic and fibrotic features of neonatal right ventricle in response to pressure overload

Affiliations

The unique hypertrophic and fibrotic features of neonatal right ventricle in response to pressure overload

Yingying Xiao et al. Sci Rep. .

Abstract

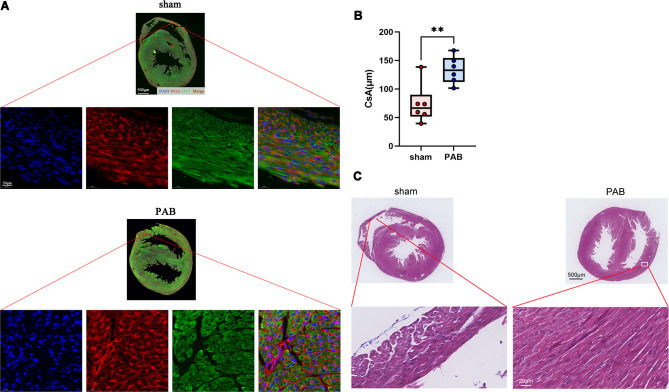
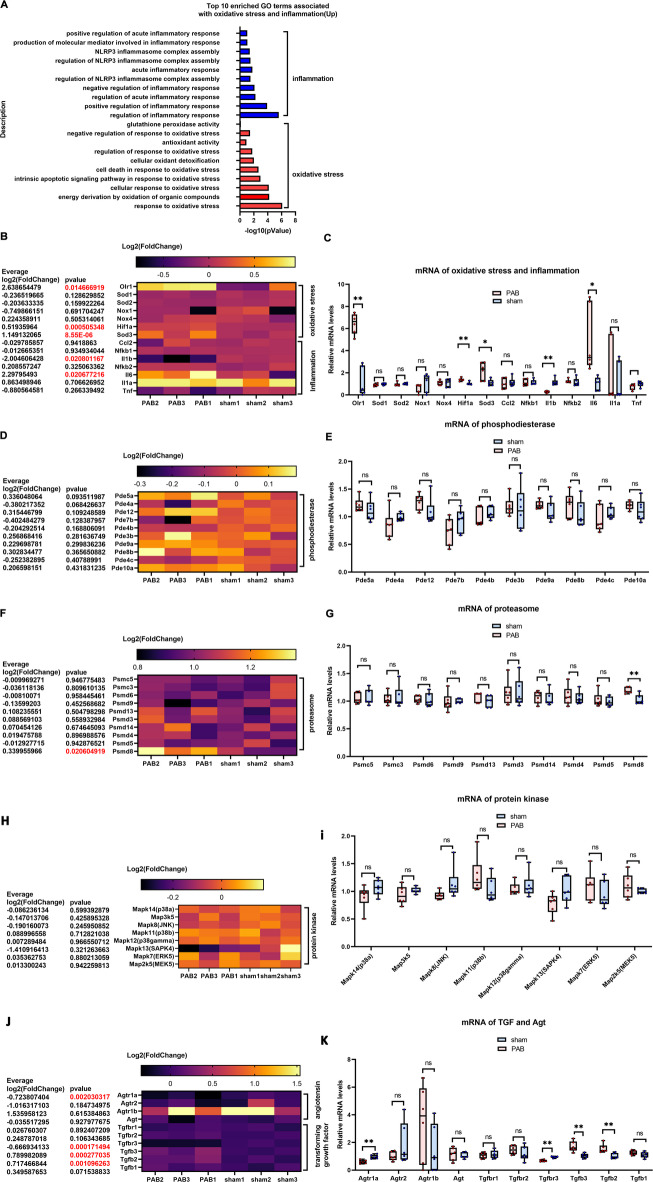
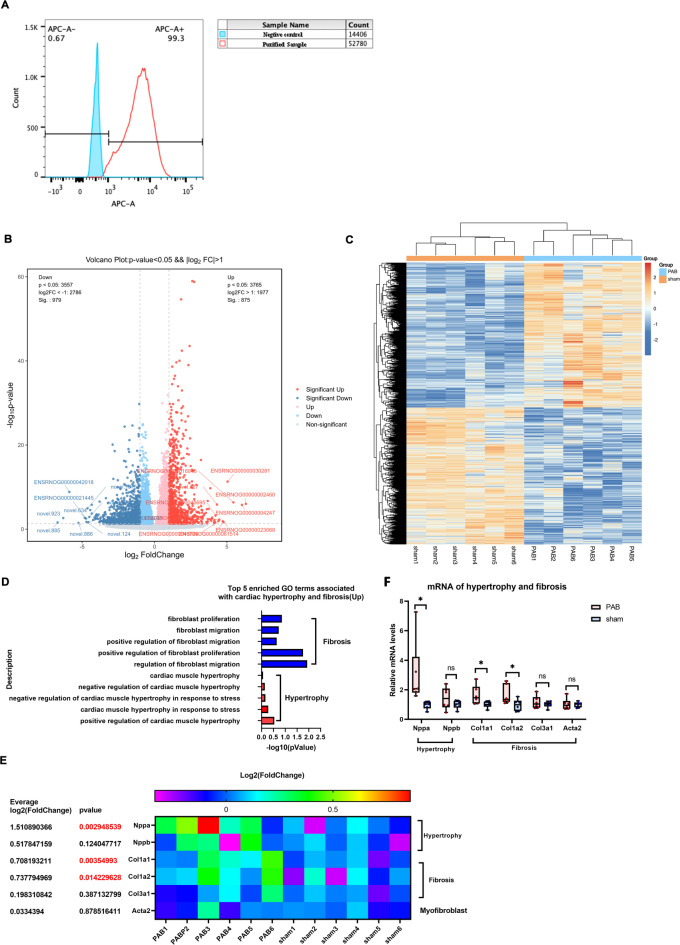
Pediatric heart failure (HF) research remains in its infancy partly due to the lack of neonatal rat/mouse models of HF. The aim of the study is to introduce a neonatal rat/mouse model of right ventricular (RV) pressure overload (RVPO), a significant cause of pediatric HF, and to uncover the molecular features of RVPO-induced RV hypertrophy and fibrosis-the two most important transitional pathological states between normal and dysfunctional RV. Neonatal rat/mouse model of RVPO was established by pulmonary artery banding (PAB) surgery on postnatal day 1(P1) and confirmed by echocardiography and morphological examination on P7. Bulk RNA and single-cell RNA sequencing was performed on RV tissues, along with bulk RNA sequencing on RV cardiomyocytes, to screen a range of key genes and signaling pathways that are upregulated and that play critical roles in adult hypertrophy and fibrosis. The sequencing results were further verified by qRT-PCR and histological staining. Most of the pathways and associated genes, such as oxidative stress, inflammation, phosphodiesterase, proteasome, protein kinase, transforming growth factor, and angiotensin were not changed or downregulated in the neonatal RVPO model. This study reveals the unique features of hypertrophy and fibrosis in the neonatal RV in response to pressure overload, which partly explains why adult-effective anti-HF drugs fail to treat pediatric HF. More importantly, single-cell RNA sequencing data of the neonatal RV with pressure overload were documented, providing an important reference for future basic or clinical investigations on pediatric RV failure.

Keywords: Pediatric; Pressure overload; Right heart failure; Right ventricle; Single-cell sequencing.


Conflict of interest statement

Declarations. Competing interests: The authors declare no competing interests.

Figures

Fig. 1
Fig. 1
Right ventricular pressuure overload (RVPO) induces RV hypertrophy. (A) Timeline of experiments in the current study. (B) H&E-stained 2-chamber cross sections of P7 mouse hearts after sham and PAB surgery. (C) Quantification of RV free wall thickness of P7 hearts after sham and PAB surgery. (D) Representative echocardiography from the sham and PAB mice. (E) Quantification of peak velocity. (F) Quantification of Peak Pressure gradient (PPG). (G) Quantification of velocity-time integral (VTI).
Fig. 2
Fig. 2
RVPO induces cardiomyocyte hypertrophy but not RV fibrosis. (A) Representative cross-sectional area (CsA) of cardiomyocytes of P7 mouse hearts after sham and PAB surgery. WGA (red), cardiac troponin T (cTnT, green), and DAPI (blue). (B) Quantification of CsA. (C) Representative Masson staining of P7 mouse hearts after sham and PAB surgery.
Fig. 3
Fig. 3
Bulk RNA-seq analysis of RV tissues demonstrates the unique hypertrophic and fibrotic feature of neonatal RV in response to RVPO. (A) Volcano plot demonstrates that RVPO generates thousands of DEGs between the sham and PAB groups at P7. (B) Cluster heatmap analysis of the DEGs in the sham and PAB groups at P7 reveals similarities within groups and differences between groups. (C) Top 10 enriched GO terms associated with cardiac hypertrophy and fibrosis in upregulated DEGs. (D) Heatmap of Log2 (fold-change) of hypertrophy and fibrosis marker genes. (E) Relative mRNA levels of hypertrophy and fibrosis marker genes. Cluster heatmap was generated using the OECloud tools (v1.26) at https://cloud.oebiotech.com.
Fig. 4
Fig. 4
Bulk RNA-seq analysis of RV tissues demonstrates that the signaling pathways that account for hypertrophy and fibrosis in neonatal RV are different from those in adult RV. (A) Top 10 enriched GO terms associated with oxidative stress and inflammation in upregulated DEGs. (B) Heatmap of Log2 (fold-change) of oxidative stress and inflammation marker genes. (C) Relative mRNA levels of oxidative stress and inflammation marker genes. (D) Heatmap of Log2 (fold-change) of phosphodiesterase genes. (E) Relative mRNA levels of phosphodiesterase genes. (F) Heatmap of Log2 (fold-change) of proteasome genes. (G) Relative mRNA levels of proteasome genes. (H) Heatmap of Log2 (fold-change) of protein kinase genes. (I) Relative mRNA levels of protein kinase genes. (J) Heatmap of Log2 (fold-change) of TGF and AGT. (K) Relative mRNA levels of TGF and AGT genes. Cluster heatmap was generated using the OECloud tools (v1.26) at https://cloud.oebiotech.com.
Fig. 5
Fig. 5
Bulk RNA-seq analysis of RV cardiomyocytes demonstrates the unique hypertrophic and fibrotic feature of neonatal RV in response to RVPO. (A) Flow cytometry indicates that ~ 99% of purified cells were cTnT-positive. (Obtained from Ye L, et al. J Am Heart Assoc. 2020;9(11):e015574. with the permission of the publisher). (B) Volcano plot demonstrates that RVPO generates thousands of DEGs in cardiomyocytes between the sham and PAB groups at P7. (C) Cluster heatmap analysis of the DEGs in cardiomyocytes between the sham and PAB groups at P7 reveals similarities within groups and differences between groups. (D) Top 5 enriched GO terms associated with cardiac hypertrophy and fibrosis in upregulated DEGs of cardiomyocytes. (E) Heatmap of Log2 (fold-change) of hypertrophy and fibrosis marker genes in cardiomyocytes. (F) Relative mRNA levels of hypertrophy and fibrosis marker genes in cardiomyocytes. Cluster heatmap was generated using the OECloud tools (v1.26) at https://cloud.oebiotech.com.
Fig. 6
Fig. 6
Bulk RNA-seq analysis of RV cardiomyocytes demonstrates that the signaling pathways that account for hypertrophy and fibrosis in neonatal RV are different from those in adult RV. (A) Top 10 enriched GO terms associated with oxidative stress and inflammation in upregulated DEGs in cardiomyocytes. (B) Heatmap of Log2 (fold-change) of oxidative stress and inflammation marker genes. (C) Relative mRNA levels of oxidative stress and inflammation marker genes. (D) Heatmap of Log2 (fold-change) of phosphodiesterase genes. (E) Relative mRNA levels of phosphodiesterase genes. (F) Heatmap of Log2 (fold-change) of proteasome genes. (G) Relative mRNA levels of proteasome genes. (H) Heatmap of Log2 (fold-change) of protein kinase genes in cardiomyocytes. (I) Relative mRNA levels of protein kinase genes in cardiomyocytes. (J) Heatmap of Log2 (fold-change) of TGF and AGT in cardiomyocytes. (K) Relative mRNA levels of TGF and AGT genes in cardiomyocytes. Cluster heatmap was generated using the OECloud tools (v1.26) at https://cloud.oebiotech.com.
Fig. 7
Fig. 7
Single-cell RNA-seq analysis of RV tissues demonstrates that the signaling pathways that account for hypertrophy and fibrosis in neonatal RV are different from those in adult RV. (A) Left panel: Umap analysis demonstrates that there are mainly 9 types of cells in the neonatal PO-RV. (B) The expression levels of marker genes in each cell type. (C) Percentage of each cell type in normal (sham) and PO (PAB)-RV. (D) Umap analysis demonstrates that the expression of Nppa (maker of hypertrophy) is significantly increased in PO (PAB)-cardiomyocytes than in sham (normal) cardiomyocytes. (E) Umap analysis demonstrates that the expression of Acta2 (maker of fibrosis) in PO (PAB)-cardiomyocytes is not different from that in sham (normal) cardiomyocytes. (F) Umap analysis demonstrates that the expression of PDE5a in PO (PAB)-cardiomyocytes is not different from that in sham (normal) cardiomyocytes. (G) Umap analysis demonstrates that the expression of SOD1 in PO (PAB)-cardiomyocytes is not different from that in sham (normal) cardiomyocytes. (H) Umap analysis demonstrates that the expression of Psmd3 in PO (PAB)-cardiomyocytes is not different from that in sham (normal) cardiomyocytes. (I) Umap analysis demonstrates that the expression of AGT in PO (PAB)-cardiomyocytes is not different from that in sham (normal) cardiomyocytes. (J) Umap analysis demonstrates that the expression of AGT in PO (PAB)-cardiomyocytes is not different from that in sham (normal) cardiomyocytes.

References

    1. Daly, K. P. & Zuckerman, W. A. The burden of pediatric heart failure that Lies just under the surface. J. Am. Coll. Cardiol.79 (19), 1929–1931. 10.1016/j.jacc.2022.03.339 (2022). - PubMed
    1. Amdani, S. et al. Burden of pediatric heart failure in the united States. J. Am. Coll. Cardiol.79 (19), 1917–1928. 10.1016/j.jacc.2022.03.336 (2022). - PubMed
    1. Siegel, R. L., Miller, K. D., Fuchs, H. E., Jemal, A. & Cancer statistics. CA Cancer J Clin.72(1), 7–33. 10.3322/caac.21708 (2022). - PubMed
    1. Mahle, W. T. et al. Pediatric heart network investigators. heart failure after the Norwood procedure: an analysis of the single ventricle reconstruction trial. J. Heart Lung Transpl.37 (7), 879–885. 10.1016/j.healun.2018.02.009 (2018). - PMC - PubMed
    1. Rossano, J. W. et al. International society for heart and lung transplantation. The international thoracic organ transplant registry of the international society for heart and lung transplantation. Twenty-second pediatric heart transplantation report – 2019; focus theme: donor and recipient size match. J. Heart Lung Transpl.38 (10), 1028–1041. 10.1016/j.healun.2019.08.002 (2019). - PMC - PubMed