. 2025 May 20;15(1):17552.
doi: 10.1038/s41598-025-01150-8.

Sphingolipid metabolism-related genes as diagnostic markers in pneumonia-induced sepsis: the AUG model

Affiliations

Sphingolipid metabolism-related genes as diagnostic markers in pneumonia-induced sepsis: the AUG model

Jing Wu et al. Sci Rep. .

Abstract

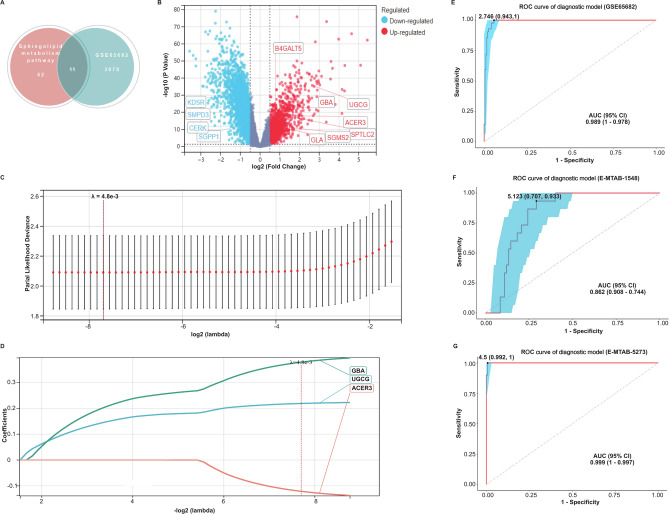
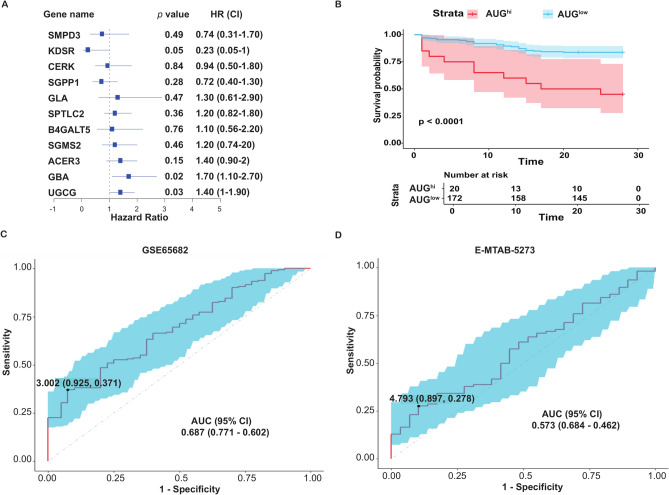
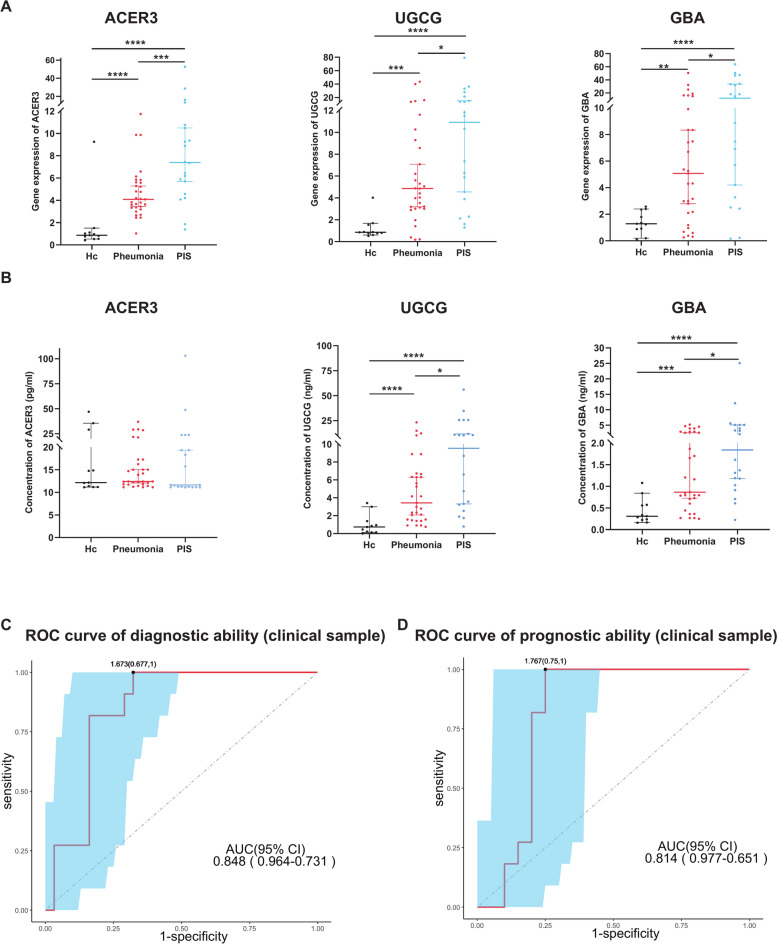
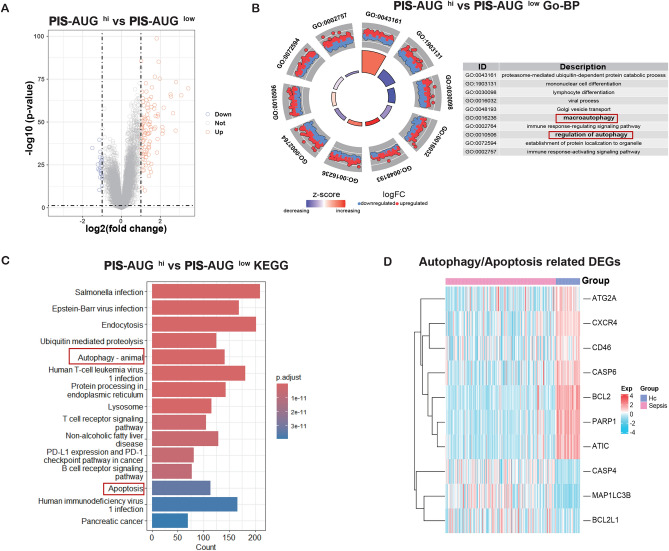
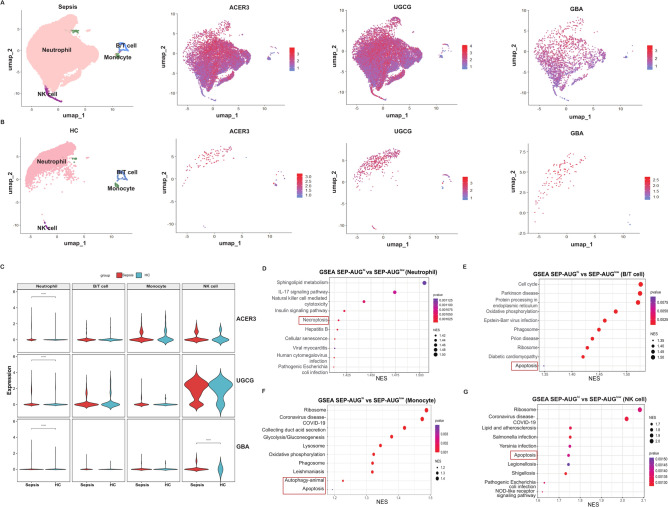
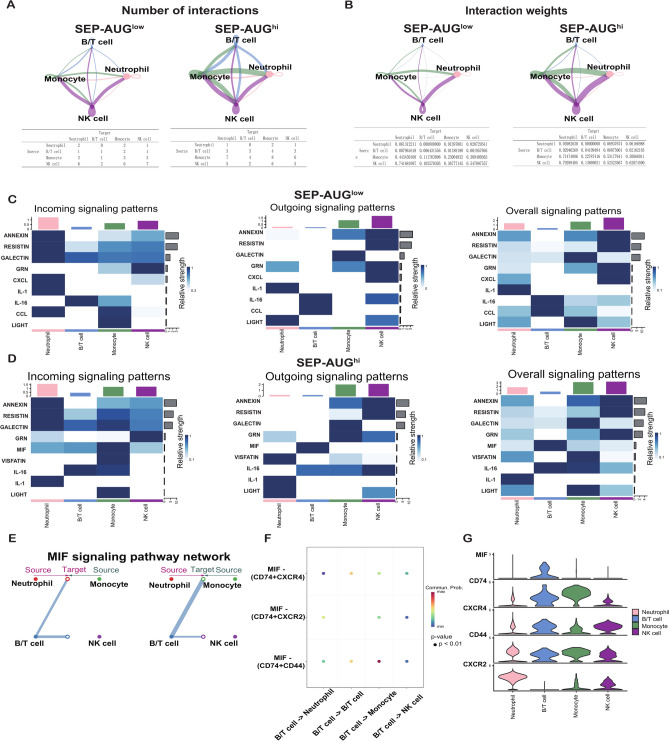
Pneumonia-induced sepsis (PIS) is a life-threatening condition with high mortality rates, necessitating the identification of biomarkers and therapeutic targets. Sphingolipid, particularly ceramides, are pivotal in modulating immune responses and determining cell fate. In this study, we identified a novel gene signature related to sphingolipid metabolism, comprising ACER3, UGCG, and GBA, which are key enzymes involved in the synthesis and metabolism of ceramides. This signature, termed the "AUG model", demonstrated strong diagnostic performance and modest prognostic efficacy across both training (GSE65682) and validation (E-MTAB-1548 and E-MTAB-5273) datasets. A clinical cohort comprising 20 PIS patients, 31 pneumonia cases, and 11 healthy controls further validated the increased expression of AUG genes at both mRNA and protein levels in peripheral blood samples upon admission. Our comprehensive analysis of bulk and single-cell transcriptome datasets revealed that these genes are implicated in immune cell death pathways, including autophagy and apoptosis. Additionally, cell-communication analysis indicated that enhanced macrophage migration inhibitory factor (MIF) signaling may be associated with dysregulated sphingolipid metabolism, potentially driving the inflammatory cascade. This study identifies a novel predictive model for PIS, highlighting the role of sphingolipid metabolism-related genes in disease progression and suggesting potential therapeutic targets for sepsis management.

Keywords: MIF signaling; Pneumonia-induced sepsis; Programmed cell death; Sphingolipid metabolism.


Conflict of interest statement

Declarations. Competing interests: The authors declare no competing interests. Ethics approval and consent to participate: This study received ethical approval from the ethics committee of the School of Medicine, Xiamen University (Approval No. XDYX202302K06). Before sample collection, consent was obtained from the guardians. Consent for publication: The authors have consent for publication.

Figures

Fig. 1
Fig. 1
Construction and validation of a diagnostic model for pneumonia-induced sepsis. (A) The Venn diagram illustrates the overlap between the 53 sphingolipid metabolism-related genes from the KEGG database and the 3889 DEGs identified from the GSE65682 dataset. The threshold for identifying DEGs was set based on an adjusted P value (Adj.P.Val) < 0.05 and a |log2 FC|> 0.5. (B) Volcano plot of DEGs in the GSE65682 dataset. The eleven sphingolipid metabolism-associated DEGs were pointed out, with seven upregulated and four downregulated in the pneumonia-induced sepsis (PIS) patients. (C, D) Screening of variables based on Lasso regression. (C) The variation characteristics of the coefficient of variables. (D) The optimal value of the parameter lambda in the Lasso regression model, 4.8e−3, was selected using the cross-validation method. With lambda set to 4.8e−3, three genes—ACER3, UGCG, and GBA—were identified, which were then used to construct the diagnostic model, named the “AUG”model. (E) Validation of the diagnostic model in the GSE65682 dataset. (F) Validation of the diagnostic model in an external dataset E-MTAB-1548. (G) Validation of the diagnostic model in an external dataset E-MTAB-5273.
Fig. 2
Fig. 2
Prognostic performance of the AUG model in PIS patients. (A) The hazard ratio for the 11 sphingolipid-related DEGs associated with 28-day mortality in PIS patients. (B) Kaplan–Meier survival curves of 28-day mortality in the training set, stratified by the median “AUG” value. (C) ROC curve for 28-day survival status in the training set. The AUROC is 0.687 (95% CI 0.771–0.602), with a sensitivity of 0.371 and a specificity of 0.925. (D) ROC curve for 28-day survival status in the E-MTAB-5273 dataset. The AUROC is 0.573 (95% CI 0.684–0.462), with a sensitivity of 0.278 and a specificity of 0.897.
Fig. 3
Fig. 3
AUG Model Efficacy in PIS Cohort. (A) The mRNA expression levels of ACER3, UGCG, and GBA in peripheral blood leukocytes among three groups, including pneumonia patients (n = 31), PIS patients (n = 20), and healthy controls (HC, n = 11). Error bars throughout all figures represent a 95% confidence interval or one standard deviation where indicated. Data were analyzed using Bonferroni-adjusted Mann–Whitney tests for all intergroup comparisons (HC vs Pneumonia vs PIS), with significance denoted as *p < 0.05, **p < 0.01, ***p < 0.001, ****p < 0.0001. (B) Serum protein levels of ACER3, UGCG, and GBA in the three groups. Error bars throughout all figures represent a 95% confidence interval or one standard deviation where indicated. Data were analyzed using Bonferroni-adjusted Mann–Whitney tests for all intergroup comparisons (HC vs Pneumonia vs PIS), with significance denoted as *p < 0.05, **p < 0.01, ***p < 0.001, ****p < 0.0001. (C) Diagnostic performance of the AUG model (the diagnostic model based on three key genes: ACER3, UGCG, and GBA) in the clinical cohort, with an AUROC of 0.848 (95% CI 0.964–0.731), a sensitivity of 1, and a specificity of 0.677. (D) Prognostic performance of the AUG model for 28-day mortality in the clinical cohort, with an AUROC of 0.814 (95% CI 0.977–0.651), a sensitivity of 1, and a specificity of 0.75.
Fig. 4
Fig. 4
Bulk transcriptomic analysis revealed that AUG genes were involved in cell death signaling pathways. (A) Volcano plot revealing DEGs in PIS-AUGhi versus PIS-AUGlow patients. The threshold was set at |logFC|> 1, P < 0.05. (B) Gene Ontology (GO) analyses of DEGs. (C) KEGG enrichment analysis of DEGs. Pathways related to cell death, including apoptosis and autophagy, were highlighted with red boxes in Figures B and C. (D) Heatmap demonstrating mRNA expression levels of genes associated with autophagy and apoptosis in PIS (pink) and healthy controls (HC) (blue).
Fig. 5
Fig. 5
Single-cell expression profiling of AUG genes in patients with sepsis. (A, B) Single-cell transcriptome analysis of AUG gene distribution among immune cell types in sepsis patients (A) and healthy controls (HC) (B). Cell types were indicated by color: pink for neutrophils, blue for B/T cells, green for monocytes, and purple for NK cells. (C) Comparative quantitative analysis of AUG gene expression levels in different immune cell types between sepsis patients and HC groups. (DG) Gene Set Enrichment Analysis (GSEA) of DEGs between the SEP-AUGhi and SEP-AUGlow groups revealed enriched pathways associated with the AUG genes in neutrophils (D), B/T cells (E), monocytes (F), and NK cells (G), respectively.
Fig. 6
Fig. 6
MIF signaling mediated enhanced immune cell communications in sepsis patients with high AUG expression. (A, B) Analysis of intercellular communication numbers (A) and weights (B) in PIS patients with low (SEP-AUGlow) and high (SEP-AUGhi) AUG expression levels. Arrows denoted the direction of signal transmission from signaling to receiving cells. (C, D) Comparative analysis of incoming, outgoing, and overall signaling patterns across different cell subsets in SEP-AUGlow (C) and SEP-AUGhi groups (D). Upper square bar graphs indicated communication strength within specific pathways, while grey bar graphs represented the number of receptor-ligand pairs. (E) Communication signals within the MIF signaling pathway among various immune cell types, with line thickness reflecting signal strength. (F) Contribution of individual ligand-receptor pairs to the MIF signaling pathway across different cell types, color-coded by P-value significance. (G) Expression distribution of MIF signaling pathway markers, including MIF, CD74, CXCR4, CD44, and CXCR2, in distinct cell subpopulations.

Similar articles

References

    1. Aliberti, S., Dela Cruz, C. S., Amati, F., Sotgiu, G. & Restrepo, M. I. Community-acquired pneumonia. Lancet398(10303), 906–919 (2021). - PubMed
    1. Angus, D. C. & Van Der Poll, T. Severe sepsis and septic shock. N Engl. J. Med.369(9), 840–851 (2013). - PubMed
    1. Rudd, K. E. et al. Global, regional, and national sepsis incidence and mortality, 1990–2017: Analysis for the Global Burden of Disease Study. The Lancet395(10219), 200–211 (2020). - PMC - PubMed
    1. Petrache, I., Petrusca, D. N., Bowler, R. P. & Kamocki, K. Involvement of ceramide in cell death responses in the pulmonary circulation. Proc. Am. Thorac. Soc.8(6), 492–496 (2011). - PMC - PubMed
    1. Shi, M. et al. Mass spectrometry detects sphingolipid metabolites for discovery of new strategy for cancer therapy from the aspect of programmed cell death. Metabolites13(7), 867 (2023). - PMC - PubMed