. 2025 May 20;16(1):4694.
doi: 10.1038/s41467-025-60088-7.

SKSR1 identified as key virulence factor in Cryptosporidium by genetic crossing

Affiliations

SKSR1 identified as key virulence factor in Cryptosporidium by genetic crossing

Wei He et al. Nat Commun. .

Abstract

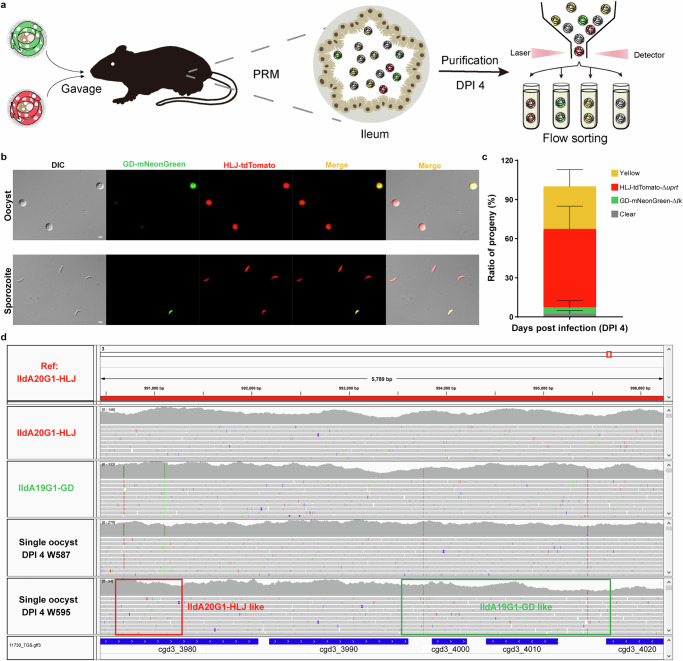
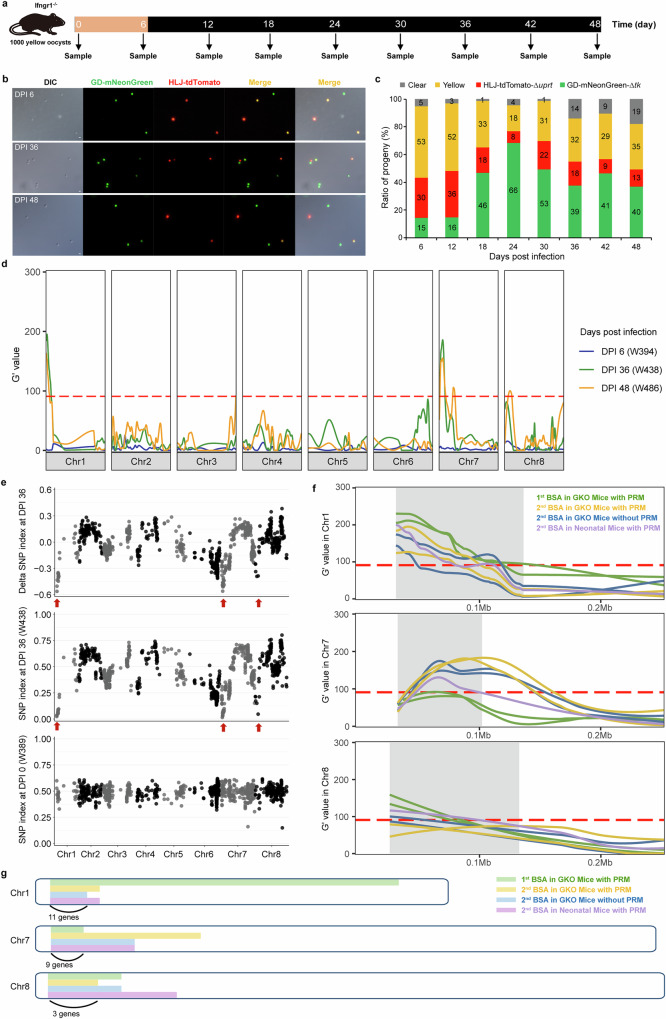
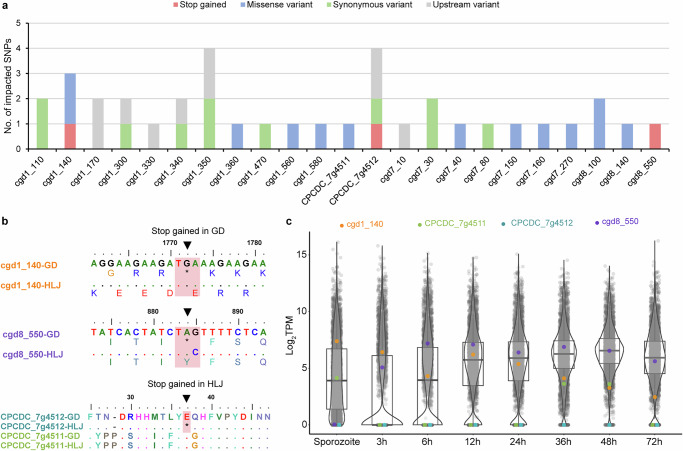
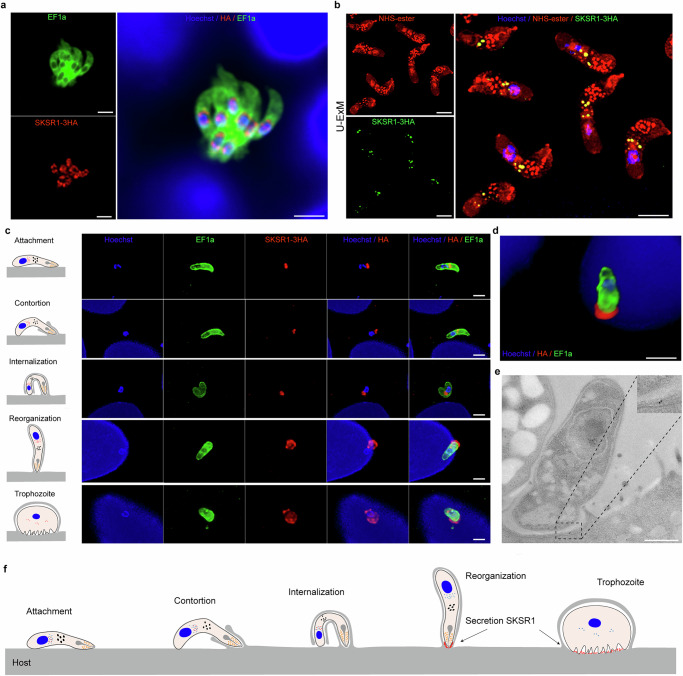
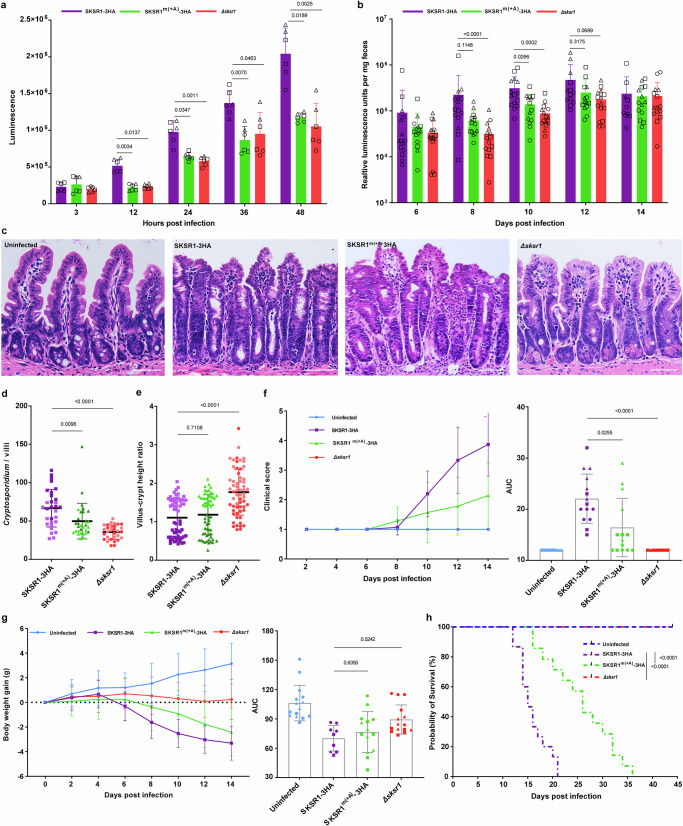
Cryptosporidium is a major cause of severe diarrhea. Although Cryptosporidium isolates exhibit significant differences in infectivity and virulence, the genetic determinants for these traits are not clear. In this study, we use classical genetics to cross two Cryptosporidium parvum isolates of different virulence and use bulk segregant analysis of whole-genome sequences from the progeny to identify quantitative trait loci (QTL) associated with Cryptosporidium infectivity and virulence. Of the 23 genes in three QTL, two have loss-of-function mutations in the low-virulence isolates, including the SKSR1 gene encoding a variant secretory protein. Deletion of the SKSR1 gene or expression of the frame-shifted sequence reduces the pathogenicity of the virulent isolate. SKSR1 is expressed in small granules and secreted into the parasite-host interface during invasion. These results demonstrate that SKSR1 is an important virulence factor in Cryptosporidium, and suggest that the extended SKSR protein family, encoded by clusters of subtelomeric genes, may contribute to pathogenesis.


Conflict of interest statement

Competing interests: The authors declare no competing interests.

Figures

Fig. 1
Fig. 1. Genetic crosses between virulent HLJ and avirulent GD strains of Cryptosporidium parvum in vivo.
a Diagram of genetic crosses of HLJ and GD in mice and flow cytometric sorting of the progeny. b Image of oocysts harvested from the intestinal mucosa 4 days after coinfection of oocysts tagged with different fluorescent proteins and the sporozoites excysted from them. Scale bars = 2 µm. c Ratio of oocysts of each color in intestinal content of mice 4 days after coinfection, as determined by microscopy of samples (mean ± SD) from three independent experiments (the 2nd, 3rd, and 4th genetic crosses). d Confirmation of genetic recombination in single oocysts of progeny by read mapping of whole genome sequences. W587 and W595 represent the IDs of the sequenced single oocyst genomes. Two polymorphic sites relative to the parental sequences on the genomes in oocyst W595 are marked, indicating crossover of sequence types in this region. Source data are provided as a Source Data file.
Fig. 2
Fig. 2. Screening of genes potentially associated with Cryptosporidium growth using bulk segregant analysis (BSA).
a Diagram showing the design of the BSA study in GKO mice and the time of sample collection for WGS analysis. b Image of purified oocysts at different time points of the second BSA infection with PRM. Images of purified oocysts at DPI 6, DPI 36, and DPI 48 are shown. Scale bars = 5 µm. c Ratio of oocysts of different colors at different time points of infection as determined by microscopy. d Distribution of G′ values of Cryptosporidium genomes at DPI 6, DPI 36, and DPI 48 of the BSA study. e Distribution of the SNP index of Cryptosporidium genomes collected at DPI 0 (progeny pool) and DPI 36. The delta SNP indices in the subtelomeric regions of chromosomes 1, 7, and 8 are close to −1, indicating the enrichment of HLJ alleles (n = 3 mice; data from one representative replicate at DPI 36 are shown). The first row is the delta SNP index of the DPI 36 (W438) and DPI 0 (W389) genomes, which is the result after removing the background noise, i.e., the pre-screening interference (the SNP index of DPI 0). The second and third rows are the SNP indices of the DPI 36 and DPI 0 genomes, respectively. W389 and W438 are the IDs of the genomes. Data in (be) are from the second BSA infection study with the progeny pool from the second genetic cross. Altogether, four BSA studies were performed using progeny from two genetic crosses. f Identification of three regions on chromosomes 1, 7, and 8 as theQTLs underlying the growth differences between HLJ and GD, based on a 95% confidence interval of data from four BSA studies. The shaded areas are overlapping QTL regions obtained from different BSA studies after Venn analysis of the data. g Identification of 23 candidate genes associated with growth using physical and Venn plots of data from four BSA studies. Source data are provided as a Source Data file.
Fig. 3
Fig. 3. Sequence and expression characteristics of candidate Cryptosporidium growth-associated genes.
a Distribution of different types of SNPs in 23 genes. b Alignment of the partial nucleotide and amino acid sequences of 3 candidate virulence genes. Insertion of base A in cgd1_140 results in premature termination of SKSR1-GD transcription (the arrowhead). The other two arrowheads indicate the position of the base mutation causing a termination codon in cgd8_550-GD and CPCDC_7g4512-HLJ. c Box and violin plots of the expression of potential virulence genes. The CPCDC_7g4512 gene is not expressed in all life cycle stages examined. Each dot represents one gene (n = 4 for the RNA-seq analysis of each culture point). The bounds and horizontal bar of the box in each plot represent quartile and median expression level, while the density curves in the violin plot shows the distribution of gene expression levels. Source data are provided as a Source Data file, and the RNA-seq data are available at NCBI under BioProject No. PRJNA1011005.
Fig. 4
Fig. 4. Localization of SKSR1 expression and translocation of the protein during invasion.
a Identification of SKSR1-3HA expression in 8 egressing merozoites. SKSR1(red) is localized near the nucleus; EF1a in green; nuclei (stained with Hoechst) in blue; scale bar = 5 µm. b Ultrastructure expansion microscopy (U-ExM) showing SKSR1 in green relative to NHS ester-stained organelles (red); nuclei in blue; scale bar = 5 µm. c Dynamics of SKSR1 expression during invasion. SKSR1 is translocated from small granules to the apical region of C. parvum sporozoites during the late phase of the host cell invasion. The cartoon images to the left of IFA panels illustrate the process of sporozoite invasion. Scale bar = 5 µm. d Immunofluorescence localization of SKSR1 at the stage when sporozoites form a cup-like structure (side view) with the host cell membrane. Scale bar = 5 µm. e Immunoelectron microscopic localization of SKSR1. SKSR1 is localized at the parasite-host interface. Scale bars = 500 nm. a–e Each experiment was performed at least twice with similar results. f A model of SKSR1 secretion during Cryptosporidium invasion. The SKSR1 protein is shown in red. Source data are provided as a Source Data file.
Fig. 5
Fig. 5. Involvement of SKSR1 in the virulence of Cryptosporidium parvum.
a Growth pattern of SKSR1-3HA, SKSR1m(+A)-3HA, and Δsksr1 lines in HCT-8 cultures. The Δsksr1 and SKSR1m(+A)-3HA lines had significantly slower growth at 24 h and 48 h post infection (dots represent data from a total of six replicates in three independent experiments, and each bar represents the mean ± SD). b Oocyst shedding pattern of Δsksr1, SKSR1−3HA, and SKSR1m(+A)-3HA lines in GKO mice. Dots represent data from three independent experiments with a total of 15 mice per group, and each bar represents the mean ± SD. c Hematoxylin and eosin (H&E) microscopic images. Scale bar = 100 μm. d Parasite load per villus on the ileal surface under H&E microscopy. e Villus length and crypt depth ratio of the ileum of uninfected and infected mice. Data in (d and e) are the mean ± SD from two independent experiments (n = 15 villi per mouse), and different color shades represent two independent experiments. f Differences in clinical score (left) and the area under the curve (AUC) (right) (mean ± SD) between groups. At 14 days post infection, in three independent experiments, six mice in the SKSR1−3HA-infected group were moribund, which we defined as animals with the worst clinical signs. g Body weight gain and AUC (mean ± SD) during the course of infection with different lines. Dead mice were not included in the AUC statistics for body weight gain. Statistical analysis in (ag) was performed using the Kruskal–Wallis test. h Survival curves of infected mice. The time of death of mice in the SKSR1-3HA group was significantly different from that in the Δsksr1 and SKSR1m(+A)−3HA groups by the Gehan-Breslow-Wilcoxon test (two-tailed). Data in (b and f–h) are from three independent infection studies with five mice per group in each experiment, the different dots represent data from three independent experiments. One mouse in the SKSR1m(+A)-3HA group died of a non-infection-related cause during the first infection study and its data were not included in subsequent analyses. Source data are provided as a Source Data file.

Similar articles

References

    1. Kotloff, K. L. et al. Burden and aetiology of diarrhoeal disease in infants and young children in developing countries (the Global Enteric Multicenter Study, GEMS): a prospective, case-control study. Lancet382, 209–222 (2013). - PubMed
    1. Gharpure, R. et al. Cryptosporidiosis outbreaks - United States, 2009-2017. MMWR Morb. Mortal. Wkly. Rep.68, 568–572 (2019). - PMC - PubMed
    1. Checkley, W. et al. A review of the global burden, novel diagnostics, therapeutics, and vaccine targets for Cryptosporidium. Lancet Infect. Dis.15, 85–94 (2015). - PMC - PubMed
    1. Feng, Y., Ryan, U. M. & Xiao, L. Genetic diversity and population structure of Cryptosporidium. Trends Parasitol.34, 997–1011 (2018). - PubMed
    1. Guo, Y. et al. Comparative genomic analysis reveals occurrence of genetic recombination in virulent Cryptosporidium hominis subtypes and telomeric gene duplications in Cryptosporidium parvum. BMC Genomics16, 320 (2015). - PMC - PubMed