. 2025 May 20;16(1):4668.
doi: 10.1038/s41467-025-59898-6.

Targeting epigenetic regulators to overcome drug resistance in the emerging human fungal pathogen Candida auris

Affiliations

Targeting epigenetic regulators to overcome drug resistance in the emerging human fungal pathogen Candida auris

Yuping Zhang et al. Nat Commun. .

Abstract

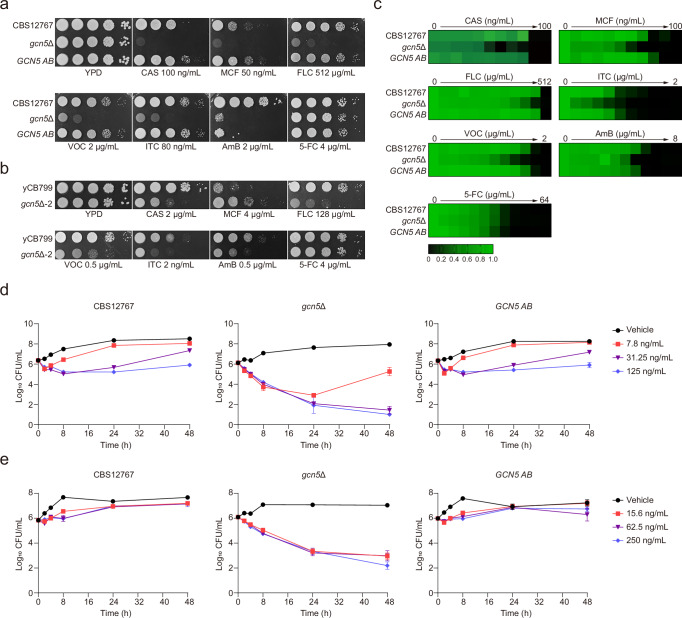
The rise of drug-resistant fungal species, such as Candida auris, poses a serious threat to global health, with mortality rates exceeding 40% and resistance rates surpassing 90%. The limited arsenal of effective antifungal agents underscores the urgent need for novel strategies. Here, we systematically evaluate the role of histone H3 post-translational modifications in C. auris drug resistance, focusing on acetylation mediated by Gcn5 and Rtt109, and methylation mediated by Set1, Set2, and Dot1. Mutants deficient in these enzymes exhibit varying degrees of antifungal drug sensitivity. Notably, we discover that GCN5 depletion and the subsequent loss of histone H3 acetylation downregulates key genes involved in ergosterol biosynthesis and drug efflux, resulting in increased susceptibility to azoles and polyenes. Additionally, Gcn5 regulates cell wall integrity and echinocandin resistance through the calcineurin signaling pathway and transcription factor Cas5. In infection models using Galleria mellonella and immunocompromised mice, GCN5 deletion significantly reduces the virulence of C. auris. Furthermore, the Gcn5 inhibitor CPTH2 synergizes with caspofungin in vitro and in vivo without notable toxicity. These findings highlight the critical role of Gcn5 in the resistance and pathogenicity of C. auris, positioning it as a promising therapeutic target for combating invasive fungal infections.


Conflict of interest statement

Competing interests: The authors declare no competing interests.

Figures

Fig. 1
Fig. 1. Methylation and acetylation of histone H3 in C. auris respond to antifungal drug stress.
a, b Treatment of C. auris fluconazole-resistant strain CBS12767 with 100 ng/mL CAS (caspofungin), 128 μg/mL FLC (fluconazole), 8 μg/mL 5-FC (5-fluorocytosine), or an equal volume of DMSO for 1 h. Western blot was used to detect changes in acetylation (a) and methylation (b) levels of histone H3. c, d Treatment of C. auris fluconazole-resistant strain CBS12767 (c) or echinocandin-resistant strain yCB799 (d) with 100 ng/mL or 8 μg/mL CAS, 128 μg/mL FLC, 8 μg/mL 5-FC, and an equal volume of DMSO for 0, 0.5, 1, and 2 h. qRT-PCR was used to detect changes in transcription levels of genes GCN5, RTT109, SET1, SET2, and DOT1. e-i Western blot was used to detect changes in acetylation or methylation levels of histone H3 corresponding to each gene knockout strain and GCN5-complemented strain (GCN5 AB). Each experiment was independently repeated twice with consistent results. #1 and #2 denote two independently constructed knockout strains. Data presented in (a-d) are expressed as mean ± SD and are representative of two or three independent experiments. Statistical significance analysis was performed using one-way ANOVA with Sidak’s test. Source data are provided as a Source Data file.
Fig. 2
Fig. 2. Significant impact on antifungal drug resistance in C auris due to disruption of the GCN5 gene encoding histone H3 acetyltransferase.
a, b Spot assay comparing the growth differences of C. auris CBS12767, gcn5Δ, and GCN5 AB (a) or yCB799 and gcn5Δ-2 (b) under antifungal drug stress with CAS (caspofungin), MCF (micafungin), FLC (fluconazole), VOC (voriconazole), ITC (itraconazole), AmB (amphotericin B), or 5-FC (5-fluorocytosine). c Microdilution method to test the effects of antifungal drugs CAS, MCF, FLC, VOC, ITC, AmB, or 5-FC in YPD liquid medium on the growth of C. auris CBS12767, gcn5Δ, and GCN5 AB. d, e Time-kill curves of CAS (d) or MCF (e) in YPD liquid medium on C. auris CBS12767, gcn5Δ, and GCN5 AB strains. Data presented in (d, e) are expressed as mean ± SD and are representative of three independent experiments. Source data are provided as a Source Data file.
Fig. 3
Fig. 3. Gcn5 regulates both ergosterol synthesis and drug efflux pump activity in C. auris.
a-d Transcriptomic sequencing of C. auris CBS12767 or gcn5Δ treated with 256 μg/mL FLC (fluconazole) or an equal volume of DMSO for 2 h. a Volcano plot showing differentially expressed genes between gcn5Δ and CBS12767. Statistical analysis was performed using DESeq2 (two-sided Wald test), with multiple testing correction via the Benjamini–Hochberg method. b Heatmap illustrating expression changes in genes related to ergosterol biosynthesis and drug efflux pumps. c GSEA analysis revealed significant enrichment of the ergosterol biosynthesis pathway in differentially expressed genes between gcn5Δ and CBS12767. Statistical significance was determined using a two-sided permutation test (1000 permutations). The normalized enrichment score (NES) was 2.43, with both nominal and FDR-adjusted p-values < 0.0001. d qRT-PCR validation of selected genes involved in ergosterol synthesis (ERG11, ERG1, ERG3, ERG25, UPC2) and drug efflux (CDR1, SNQ2, MDR1) in CBS12767, gcn5Δ, and GCN5 AB. e, f Gcn5-dependent H3K14Ac at the promoter regions of ERG11 and CDR1 assessed by ChIP-qPCR. e Schematic of H3K14Ac enrichment at different positions in the ERG11 promoter (top); Detection of H3K14Ac enrichment in the ERG11 gene promoter region of C. auris CBS12767 or gcn5Δ (bottom left); Fluconazole-induced changes in H3K14Ac levels at the ERG11 promoter of C. auris CBS12767 over time (30, 60, 120 min) (bottom right). f Similar analysis for the CDR1 promoter. g, h R-6G (Rhodamine 6-G) efflux assay testing drug efflux pump activity in C. auris CBS12767, gcn5Δ, and GCN5 AB, with consistent results across two independent repeats. g shows photos of pellets after starvation, dye uptake, glucose stimulation, and centrifugation. h presents the same samples viewed under fluorescence microscopy in the RFP channel. Data presented in (d-f) are expressed as mean ± SD and are representative of three independent experiments. Statistical significance analysis was performed using two-way ANOVA (d) or one-way ANOVA (e, f) with Sidak’s test. Source data are provided as a Source Data file.
Fig. 4
Fig. 4. Gcn5 regulates echinocandin drug resistance and cell wall structure homeostasis in C. auris by modulating the calcineurin pathway and the transcription factor Cas5.
a, b qRT-PCR was used to measure expression levels of the FKS1, FKS2 and RHO1genes (a) and the CAS5 and CRZ1 genes (b) in C. auris strains CBS12767, gcn5Δ, and GCN5 AB. c Spot assay comparing growth differences of C. auris CBS12767, gcn5Δ, cas5Δ, crz1Δ, and cna1Δ (top) or C. auris yCB799, gcn5Δ−2, cas5Δ−2, crz1Δ−2, and cna1Δ−2 (bottom) under 100 ng/mL or 2 μg/mL CAS and 300 mM CaCl2 conditions. d Spot assay assessing growth differences of C. albicans SN250, gcn5Δ/Δ, gcn5Δ/Δ+CAS5OE, gcn5Δ/Δ+CNA1OE and gcn5Δ/Δ+CRZ1OE under 40 ng/mL or 50 ng/mL CAS (caspofungin) conditions. e qRT-PCR analysis of expression changes in genes related to fungal cell wall integrity regulated by the transcription factor Cas5. f Spot assay detecting growth differences of C. auris CBS12767, gcn5Δ, and GCN5 AB strains under cell wall stress conditions of 30 μg/mL CFW (Calcofluor White) or 0.1% W/V SDS (Sodium Dodecyl Sulfate). g Fluorescence microscopy using the UW channel to observe chitin distribution in the cell walls of C. auris CBS12767, gcn5Δ, and GCN5 AB after staining with CFW. The experiment was independently repeated twice with consistent results. h Western blot analysis of phosphorylation levels of MAPK pathway kinases Hog1, Mkc1, and Cek1 in C. auris CBS12767, gcn5Δ, and GCN5 AB growth under normal conditions or after treatment with 100 ng/mL CAS for 30 or 60 min. The experiment was independently repeated twice with consistent results. Data presented in (ae) are expressed as mean ± SD and represent of three independent experiments. Statistical significance analysis was performed using two-way ANOVA with Sidak’s test. Source data are provided as a Source Data file.
Fig. 5
Fig. 5. Gcn5 is essential for the virulence of C. auris in invasive infections in mice.
a Schematic diagram outlining the procedure for generating survival curves. b Thirty-day survival curve of immunosuppressed ICR mice (n = 8) after intravenous infection with C. auris CBS12767, gcn5Δ, or GCN5 AB, monitored daily for mortality. c Schematic diagram illustrating the method for measuring fungal burden in organs. d Assessment of fungal burden in the kidneys, spleen, liver, brain, and lungs of immunosuppressed ICR mice (n = 4) 3 days post-infection with C. auris CBS12767, gcn5Δ, or GCN5 AB, quantified using CFU counts. Data presented in (d) are expressed as mean ± SD. Statistical significance analysis was performed using Log-rank (Mantel-Cox) test (b) or one-way ANOVA with Sidak’s test (d). Source data are provided as a Source Data file.
Fig. 6
Fig. 6. The gcn5Δ mutant is more effectively cleared by CAS treatment in vivo.
a Schematic diagram outlining the experimental procedure. b Assessment of fungal burden in the kidneys, spleen, liver, and lungs of mice following treatment with 4 doses (top) or 8 doses (bottom) of CAS (n = 4). Fungal burden was measured using CFU counts. Data are expressed as mean ± SD. Statistical significance analysis was performed using one-way ANOVA with Sidak’s test. Source data are provided as a Source Data file.
Fig. 7
Fig. 7. Synergistic antifungal effect of CPTH2 and CAS against C. auris in vitro and in vivo.
a Histone H3 acetylation levels in C. auris CBS12767 were assessed by Western blot following treatment with increasing concentrations of CPTH2 or DMSO control. Results are representative of three independent experiments. b Spot assays show the individual and combined antifungal effects of CPTH2 (0.5 μM) and CAS (31.25 ng/mL for CBS12767; 4 μg/mL for yCB799) against C. auris CBS12767 and yCB799. c, d Checkerboard assays evaluated CPTH2 and CAS combinations against CBS12767 (c) and yCB799 (d). FICI values are shown in the upper right corners. e, g Time-kill curves for CPTH2 and CAS, alone or in combination, were generated for CBS12767 (e) and yCB799 (g). Combo1 and Combo2 indicate 4 μM CPTH2 with 7.8 or 31.25 ng/mL CAS (e), and 6 μM CPTH2 with 8 or 128 μg/mL CAS (g). Data are representative of three independent experiments. f, h Colony formation after 48-h drug exposure (alone or combined) and plating on drug-free SDA medium, followed by 36-h incubation at 30  °C for CBS12767 (f) and yCB799 (h). i, j Checkerboard assays demonstrate synergistic activity of CPTH2 and CAS against clinical isolates from five C. auris clades (i) and the gcn5Δ−2 mutant (j), with FICI values in the upper right corner; I, II, III, IV, and V represent Clades I–V. k Survival analysis of Galleria mellonella larvae (n = 20) infected with yCB799 and treated with CPTH2 alone (upper panel) or CPTH2 and CAS alone or in combination (lower panel). l Fungal burden measured in the spleens and liver of mice infected with yCB799 after 6 treatments with CPTH2 (10 mg/kg, n = 6; 40 mg/kg, n = 8) and CAS (10 mg/kg), either alone or in combination. Data presented in (ak) are expressed as mean ± SD. Statistical significance analysis was performed using Log-rank (Mantel-Cox) test (k) or one-way ANOVA with Sidak’s test (a, l). Source data are provided as a Source Data file.
Fig. 8
Fig. 8. Safety assessment of targeting Gcn5 in the host.
a Western blot analysis of histone H3K9 acetylation levels in HeLa cells treated with various concentrations of CPTH2 or an equivalent volume of DMSO for 24 h. Results are representative of three independent experiments. b Detection of LDH release in HeLa cells following treatment with different concentrations of CPTH2 or an equivalent volume of DMSO for 24 h (n = 6). Cell lysis solution was added 45 min before detection as a positive control (n = 4). Data are presented as the ratio of LDH release in the experimental group to the control group. c Survival of Galleria mellonella larvae over 7 days following injection with different concentrations of CPTH2 or DMSO (n = 20). d Body weight monitoring in mice receiving daily intraperitoneal injections of 10, 20, or 40 mg/kg CPTH2, or solvent control, for 4 days (n = 4). e Serum levels of ALT, AST, CREA, BUN, and LDH measured 24 h after the final injection in the 40 mg/kg group and control mice (n = 4). f Histological analysis of kidney and liver tissues in all 4 mice from each group, with consistent results observed across individuals. Data presented in (ad) are expressed as mean ± SD. Statistical significance analysis was performed using one-way ANOVA with Sidak’s test. Source data are provided as a Source Data file.

References

    1. Iliev, I. D. et al. Focus on fungi. Cell187, 5121–5127 (2024). - PMC - PubMed
    1. Jermy, A. Stop neglecting fungi. Nat. Microbiol.2, 17120 (2017). - PubMed
    1. Du, H. et al. Candida auris: epidemiology, biology, antifungal resistance, and virulence. PLoS Pathog.16, e1008921 (2020). - PMC - PubMed
    1. Logan, C., Martin-Loeches, I. & Bicanic, T. Invasive candidiasis in critical care: challenges and future directions. Intensive Care Med.46, 2001–2014 (2020). - PubMed
    1. Kenters, N. et al. Control of Candida auris in healthcare institutions: outcome of an international society for antimicrobial chemotherapy expert meeting. Int. J. Antimicrob. Agents54, 400–406 (2019). - PubMed

MeSH terms

LinkOut - more resources