. 2025 May 20;15(1):17423.
doi: 10.1038/s41598-025-02037-4.

A novel luciferase-based assay for quantifying coronavirus-induced syncytia

Affiliations

A novel luciferase-based assay for quantifying coronavirus-induced syncytia

Keisuke Oguma et al. Sci Rep. .

Abstract

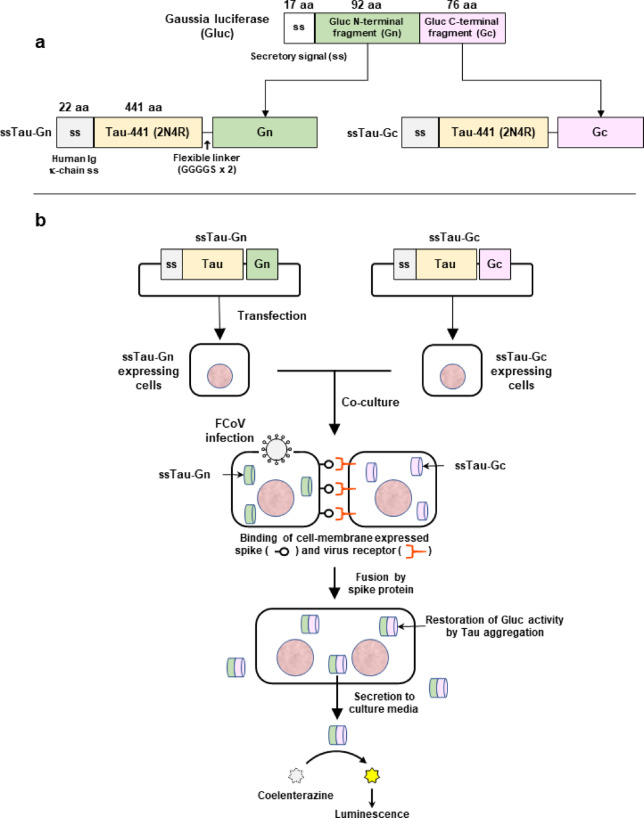
Coronaviruses can induce cell‒cell fusion that results in the formation of multinucleated syncytia through the interaction of viral spike proteins with host cell receptors. Quantifying syncytial formation is crucial for screening potential efficacious antiviral compounds. However, some traditional methods for syncytial quantification are often labor-intensive and limited by a low-throughput capacity. Therefore, we developed a novel high-throughput assay for the efficient quantification of syncytial formation induced by feline coronavirus (FCoV) and SARS-CoV-2. This assay, which is based on the split luciferase system, utilizes a split Gaussia luciferase (Gluc) system. In this system, fragments of Gluc are fused to the multimerizing Tau protein to reconstitute enzymatic activity upon cell fusion. In this study, the activity of the reconstituted luciferase was measured in 20 µL of culture medium to efficiently quantify syncytial formation induced by FCoV and SARS-CoV-2. Our findings demonstrate that this assay can accelerate the discovery of antiviral drugs that target coronaviruses.

Keywords: Coronaviruses; Drug discovery; Drug screening; SARS-CoV-2; Syncytium quantification; Tau proteins.


Conflict of interest statement

Declarations. Competing interests: The authors declare no competing interests.

Figures

Fig. 1
Fig. 1
Overview of the ssTau-split Gluc system. (a) Structure of the ssTau-split Gluc protein. (b) ssTau-split Gluc expression vectors were independently introduced into the cells, which were then co-cultured at a 1:1 ratio. During coronavirus infection, spike proteins expressed on the cell membrane bind to the virus receptor to facilitate cell‒cell fusion. The aggregation of Tau proteins functionally restores Gluc activities that is released into the culture medium, enabling high-throughput measurement of Gluc activity without cell lysis.
Fig. 2
Fig. 2
FCoV-induced cell fusion. Fcwf-4 (left panels, ad) and CRFK (right panels, e–h) cells were cultured in 1 mL of medium per well in a 12-well plate. FCoV strain M91-267 stock virus was half-log diluted from 10− 1 to 10− 6 using culture medium and 0.5 mL of diluted virus were used for infection in a total 1 mL of medium/well. The cells were cultured for 18 h, fixed with methanol and stained with Giemsa solution. Both cell lines infected with virus diluted to 10− 1 had fused or detached cells throughout the well (panel a and e, respectively). Syncytia were surrounded by dashed line and some of them were indicated by arrows (panel b, c, f, and g). In panel (b), dashed line-surrounded areas indicate small regions consisted of non-syncytial cells. Scale bar: 200 μm.
Fig. 3
Fig. 3
Upregulation of the ssTau-split Gluc signal via FCoV infection. (a) Gluc activity in the medium of cells transfected with a Gn/Gc pair of four Tau-split Gluc constructs (a split Gluc fragment (Gn or Gc) at the N- or C-terminus of Tau) in Fcwf-4 and CRFK cells. (1) Vect: Empty expression vector, (2) TGn: ssTau-Gn, (3) TGc: ssTau-Gc, (4) GnT: ssGn-Tau, (5) GcT: ssGc-Tau. The data are expressed as the mean ± standard deviation (SD), with raw values of each well indicated as circles (○). The luciferase values relative to cells transfected only with empty vectors are indicated at the top of each bar. (b) Quantification of FCoV-induced cell‒cell fusion using the ssTau-split Gluc system at 24 h post-infection. The transfected vectors and viral infections in each group are indicated in bar graphs. Ctrl: Non-infected control cells. The data are expressed as the mean ± SD, with raw values of each well indicated as circles. The luciferase values relative to non-infected cells with TGn + TGc vector are shown at the top of each bar. (c) Correlation between viral dose and split-Gluc restoration. The mean luciferase value of each group was used for the analysis. The data are expressed as the mean ± SD, with raw values of each well indicated as circles. MIC: Maximal information coefficient. (d) Effects of GS-441524 on FCoV-induced syncytial formation of Fcwf-4 cells. Luciferase activity at various GS-441524 doses is shown. The data are expressed as the mean ± SD. (e) Inhibition of split-Gluc restoration by GS-441524. The percentage of inhibition was calculated based on the luciferase activity results shown in panel d. The data are expressed as the mean ± SD, with raw values of each well indicated as circles. (f) Effects of GS-441524 on cell survival. Cell viability was assessed using the WST-8 assay after the determination of split-Gluc values. The data are expressed as the mean ± SD, with raw values of each well indicated as circles. (g) Inhibition of cell death by GS-441524. The percentage of inhibition was calculated based on the WST-8 assay results shown in panel (f).
Fig. 4
Fig. 4
Quantitative analysis of FCoV spike protein-induced syncytia. (a) Light microscopy images of parental Fcwf-4 and CRFK cells transfected with FCoV S vectors and either ssTau-Gn or ssTau-Gc, as obtained 24 hpt. Syncytial regions are surrounded by dashed circles or lines. The arrows indicate syncytial cells. Nearly all Fcwf-4 cells expressing GFP-tagged spike formed syncytia in the culture well. Scale bar: 200 μm. (b) Quantification of FCoV spike protein-induced syncytia using the ssTau-split Gluc system. The data are expressed as the mean ± SD, with raw values of each well indicated as circles. The luciferase values relative to those of the empty vector control (Vect) are indicated at the top of each bar. (c) Cell survival analysis. Cell viability was assessed using the WST-8 assay after the determination of Gluc activity (panel b).
Fig. 5
Fig. 5
Time‒lapse microscopy of syncytial cell formation. (a) Early stages of syncytium formation in two parental Fcwf-4 cells transfected with the FCoV S-GFP vector. The initiation of fusion and syncytium formation are indicated by arrows. Images were presented at 30-min intervals. Scale bar: 100 μm. (b) Detachment of the syncytium. The syncytium shown in panel A detached from the culture well within 10 min (indicated by arrows in Panels 5 h 00 m to 5 h 10 m). Images were presented at 5-min intervals. Scale bar: 100 μm.
Fig. 6
Fig. 6
Quantitative evaluation of FCoV spike protein-induced syncytia in Fcwf-4 cells stably expressing ssTau-split Gluc. (a) FCoV S-induced syncytia in Fcwf-stable Tau cells. Fcwf-stable Tau cells were transfected with empty (Vect), tag-free (WT), PA-tagged, or GFP-tagged S expression vectors. Syncytia are surrounded by a dashed line in light microscopy images obtained 24 hpt. Scale bar: 100 μm. (b) Gluc activity of the cells shown in panel a, as determined 24 hpt. The data are expressed as the mean ± SD, with raw values of each well indicated as circles. The luciferase values relative to those of WT are indicated at the top of each bar.
Fig. 7
Fig. 7
SARS-CoV-2 spike protein-induced cell fusion. (a) Visualization of SARS-CoV-2 spike expression-induced syncytia in parental Vero cells. Syncytia are indicated by a dashed line in light microscopy images captured 24 hpt. Scale bar: 100 μm. (b) Upregulation of split-Gluc expression in parental Vero cell culture media. Split-Gluc activity was determined at 24 hpt in co-cultured cells transiently expressing SARS-CoV-2 S and ssTau-Gn or ssTau-Gc. (c) Enhancement of SARS-CoV-2 spike-mediated syncytial formation by human and feline ACE2 in Fcwf-4-stable Tau cells. Syncytia are indicated by a dashed line in light microscopy images obtained 24 hpt. Scale bar: 100 μm. (d) ssTau-split Gluc activity of the Fcwf-stable Tau cells shown in panel (c). The empty control (Vect) or SARS-CoV-2 S expression vectors were co-transfected with human or feline ACE2 expression vectors. Split-Gluc activity was determined at 24 hpt.

References

    1. Alkhatib, G. et al. Characterization of a cleavage mutant of the measles virus fusion protein defective in syncytium formation. J. Virol.68, 6770–6774. 10.1128/jvi.68.10.6770-6774.1994 (1994). - PMC - PubMed
    1. Zokarkar, A. & Lamb, R. A. The paramyxovirus fusion protein C-terminal region: mutagenesis indicates an indivisible protein unit. J. Virol.86, 2600–2609. 10.1128/jvi.06546-11 (2012). - PMC - PubMed
    1. Graves, D. C. & Jones, L. V. Early syncytium formation by bovine leukemia virus. J. Virol.38, 1055–1063. 10.1128/jvi.38.3.1055-1063.1981 (1981). - PMC - PubMed
    1. Gruters, R. A. et al. Interference with HIV-induced syncytium formation and viral infectivity by inhibitors of trimming glucosidase. Nature330, 74–77. 10.1038/330074a0 (1987). - PubMed
    1. Taguchi, F., Ikeda, T. & Shida, H. Molecular cloning and expression of a Spike protein of neurovirulent murine coronavirus JHMV variant cl-2. J. Gen. Virol.73 (Pt 5), 1065–1072. 10.1099/0022-1317-73-5-1065 (1992). - PubMed

LinkOut - more resources