. 2025 May 20;15(1):17475.
doi: 10.1038/s41598-025-02305-3.

Value of PET radiomic features for diagnosis and reccurence prediction of newly diagnosed oral squamous cell carcinoma

Affiliations

Value of PET radiomic features for diagnosis and reccurence prediction of newly diagnosed oral squamous cell carcinoma

Elisabeth Pfaehler et al. Sci Rep. .

Abstract

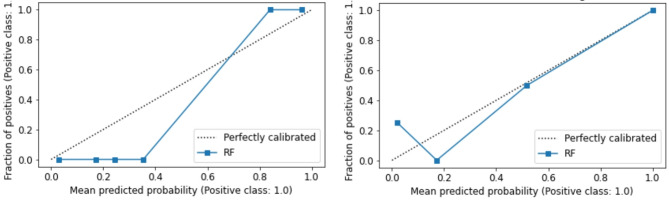
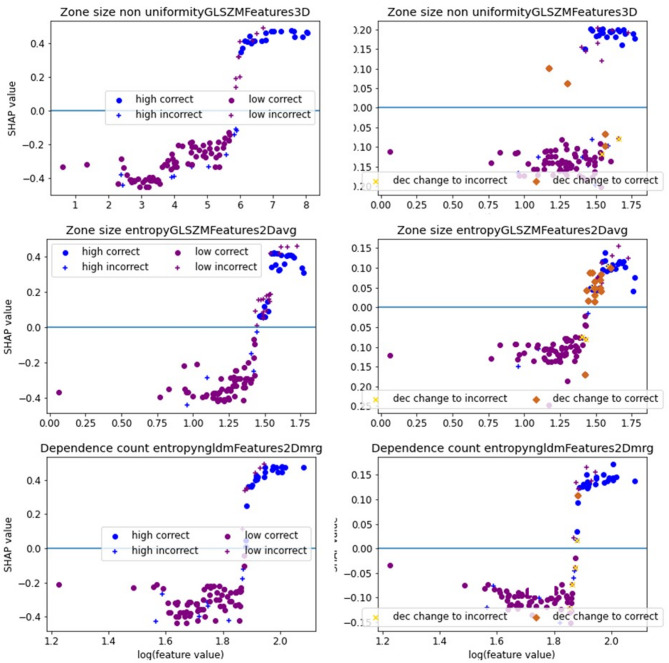
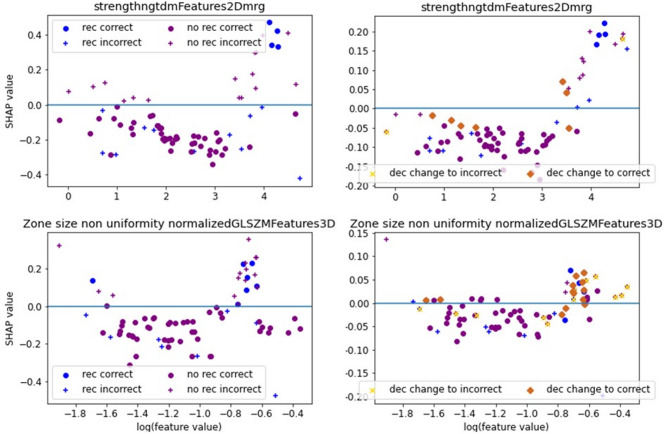
Oral Squamous Cell Carcinoma (OSCC) represents more than 90% of oral cancers. The usefulness of radiomic features extracted from PET images of OSCC patients to predict tumor characteristics such as primary tumor stage (T-stage), or tumor grade has not been investigated yet. In this prospective study, 112 patients with newly diagnosed, treatment-naïve OSCC were included. Tumor segmentation was performed using three strategies, the majority vote of these segmentations was used to calculate 445 radiomic features. Features instable over segmentation methods and features highly correlated with volume, SUVmax, and SUVmean were eliminated. A Random Forest classifier was trained to predict T-stage, tumor grade, lymph node involvement, and tumor recurrence. Stratified 10-fold cross-validation was performed. Evaluation metrics such as accuracy and area under the curve (AUC) were reported. SHAP dependence plots were generated to understand classifier decisions. The classifier reached a mean cross-validation AUC of 0.83 for predicting T-stage, an AUC of 0.56 for the grading of the primary tumor, a mean AUC of 0.64 for lymph node involvement, and a mean AUC of 0.63 for recurrence. In patients with newly-diagnosed OSCC, radiomics might have some potential to predict T-stage. These results need to be validated in a larger patient cohort.

Keywords: Positron emission tomography; Prediction; Radiomics; Squamous cell carcinoma of the oral cavity.


Conflict of interest statement

Declarations. Competing interests: The authors declare no competing interests. Ethical approval: The institutional review board of the Faculty of Medicine at the University of Würzburg approved this study, and written, informed consent was obtained from all participants (clinical trial number NCT04280159). The study was in accordance with the ethical standards of the institutional research committee and with the Declaration of Helsinki.

Figures

Fig. 1
Fig. 1
Calibration curves of random forest (RF) model for T-stage classification. As displayed, the RF model follows very well the required line.
Fig. 2
Fig. 2
Left: SHAP-dependence plot for features when used alone in T-stage classification. The displayed features are the features most frequently selected across folds: SHAP values > 0 indicate a contribution towards classification to 1 (high-stage), SHAP values < 0 indicate a contribution towards classification to 0 (low-stage). Tumors with high-stage are marked in blue, low-stage in purple, i.e. a blue dot with a negative SHAP value reflects a wrong decision. Ideally, all purple dots would be on one side of the x-axis and all blue dots would be on the other side of the x-axis; In this case, there would be a clear threshold between high and low-stage tumors. Right: SHAP-summary plot when all features were used for classification. Marked in brown/yellow: Classifier decision changed when compared with using the feature alone, i.e. feature interaction had an impact on results especially for the feature zone entropy, for the other two features, the classifier output only changed in a few cases; Please note that SHAP values differ between both columns as both columns belong to different classifiers.
Fig. 3
Fig. 3
SHAP summary plots for an example fold for classifying tumor stage (left) and tumor grade (right) for one example fold. The displayed features are features selected in this respective fold.
Fig. 4
Fig. 4
ROC curve for the classification of T-stage (left) and tumor grade (right).
Fig. 5
Fig. 5
SHAP dependence plots for lymph node involvement. For a more explicit explication of the plots, we refer to Fig. 2. No clear threshold between patients with lymph node involvement (blue) and without lymph node involvement (purple) can be observed: Ideally, all blue and all purple dots would be on one side of the x-axis.
Fig. 6
Fig. 6
SHAP dependence plot for recurrence classification. For a deeper explanation, please check Fig. 2.
Fig. 7
Fig. 7
SHAP summary plot for lymph node involvement (left) and tumor recurrence (right).
Fig. 8
Fig. 8
ROC curves for the classification of lymph node involvement (left) and recurrence (right).

Similar articles

References

    1. Hernandez-Guerrero, J. et al. Prevalence trends of oral squamous cell carcinoma. Mexico city’s general hospital experience. Med. Oral Patol. Oral Cirugia Bucal e306–e311. 10.4317/medoral.18043 (2013). - PMC - PubMed
    1. Disease Control Priorities, Third Edition (Volume 3): Cancer. 10.1596/978-1-4648-0349-9 (The World Bank, 2015). - PubMed
    1. Amit, M. et al. Improvement in survival of patients with oral cavity squamous cell carcinoma: an international collaborative study. Cancer119, 4242–4248 (2013). - PubMed
    1. Van Dijk, B. A. C., Brands, M. T., Geurts, S. M. E., Merkx, M. A. W. & Roodenburg, J. L. N. Trends in oral cavity cancer incidence, mortality, survival and treatment in the Netherlands: OCC incidence, mortality, survival and treatment. Int. J. Cancer. 139, 574–583 (2016). - PubMed
    1. DiTroia, J. F. Nodal metastases and prognosis in carcinoma of the oral cavity. Otolaryngol. Clin. North. Am.5, 333–342 (1972). - PubMed

MeSH terms

LinkOut - more resources