. 2025 May 20;15(1):17531.
doi: 10.1038/s41598-025-97718-5.

An explainable AI-driven deep neural network for accurate breast cancer detection from histopathological and ultrasound images

Affiliations

An explainable AI-driven deep neural network for accurate breast cancer detection from histopathological and ultrasound images

Md Romzan Alom et al. Sci Rep. .

Abstract

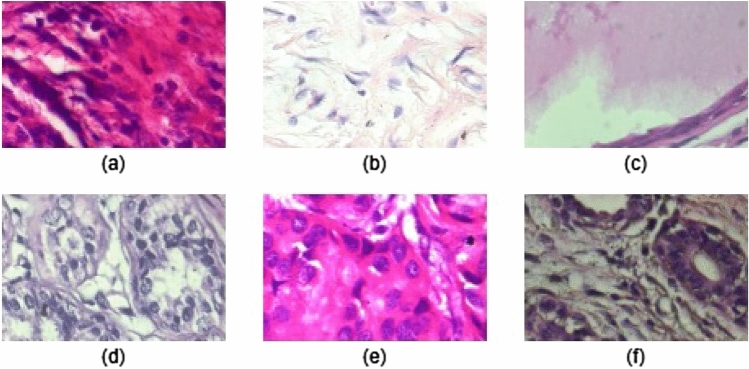
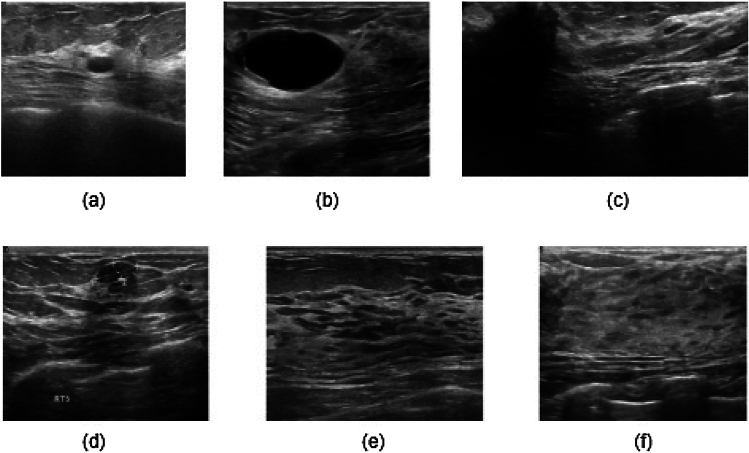
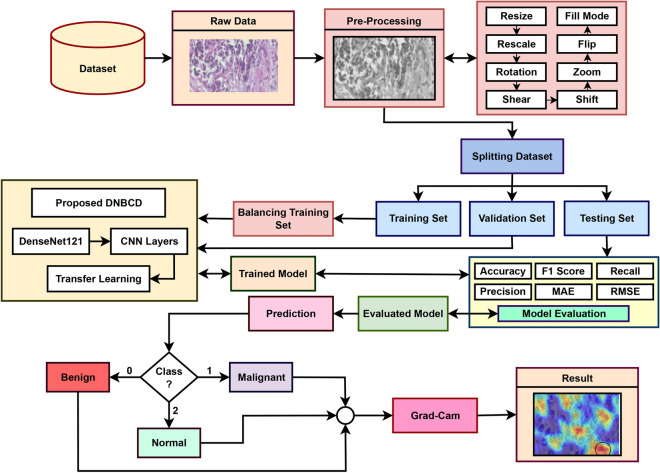
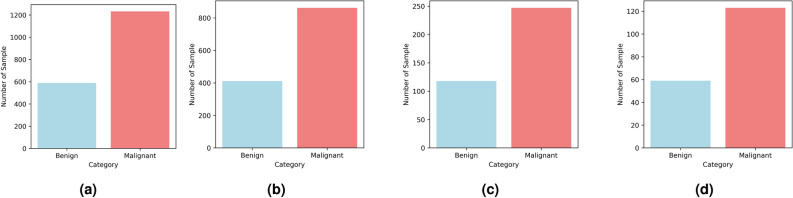
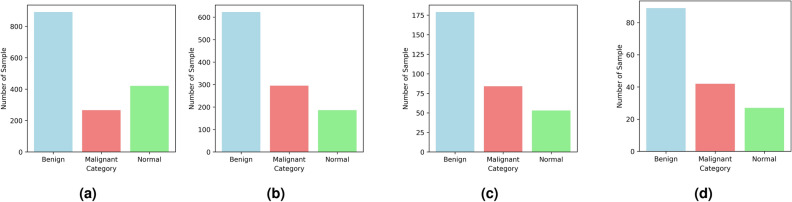
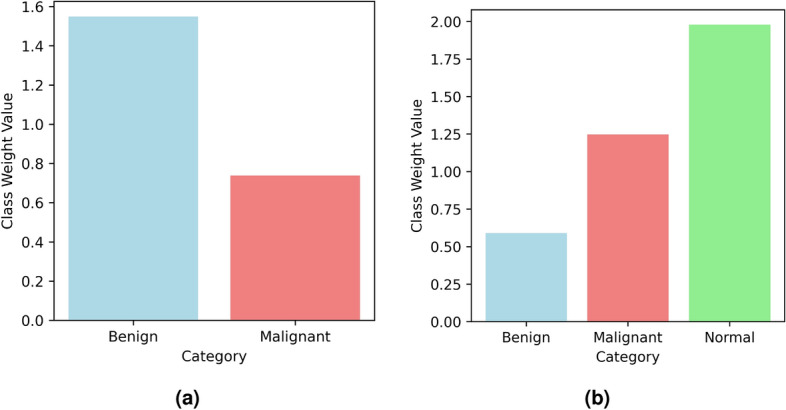
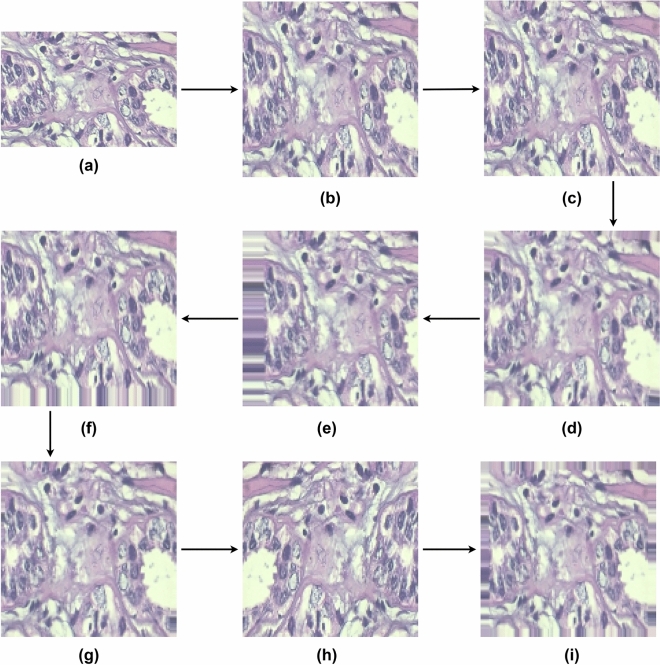
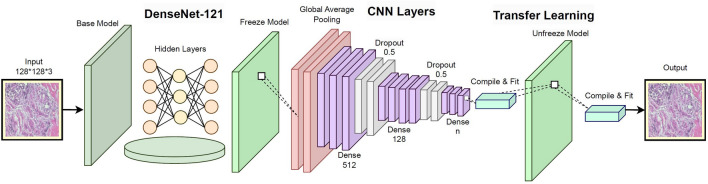
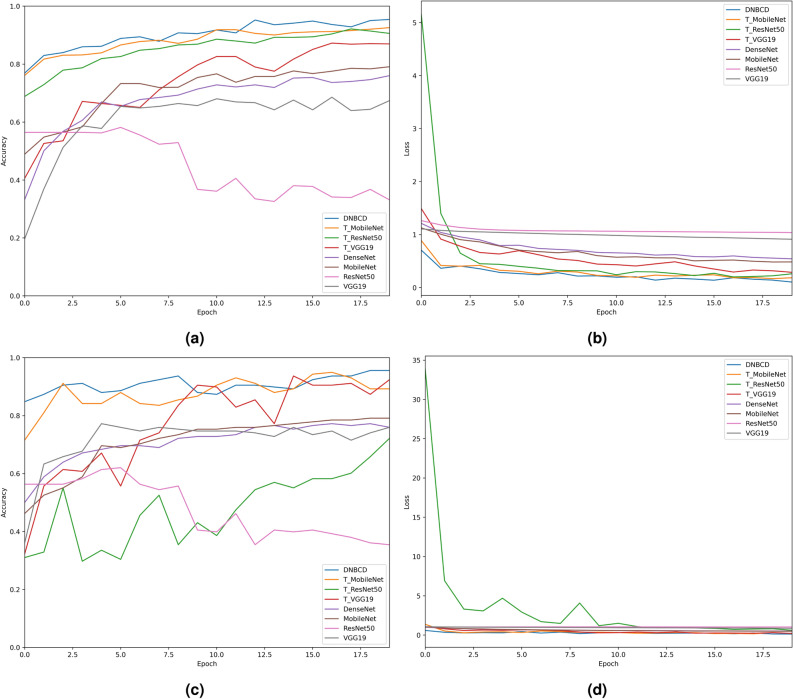
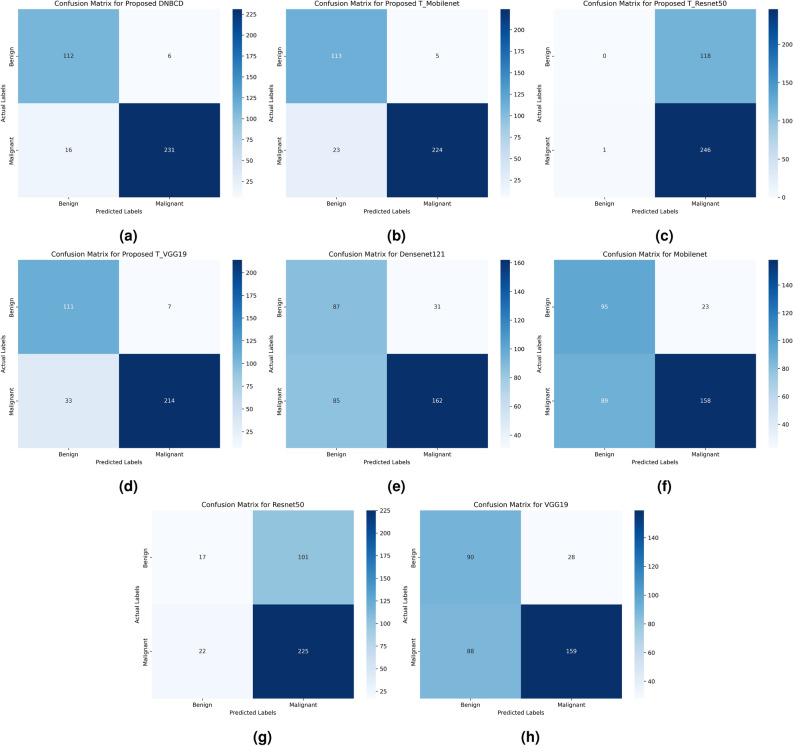
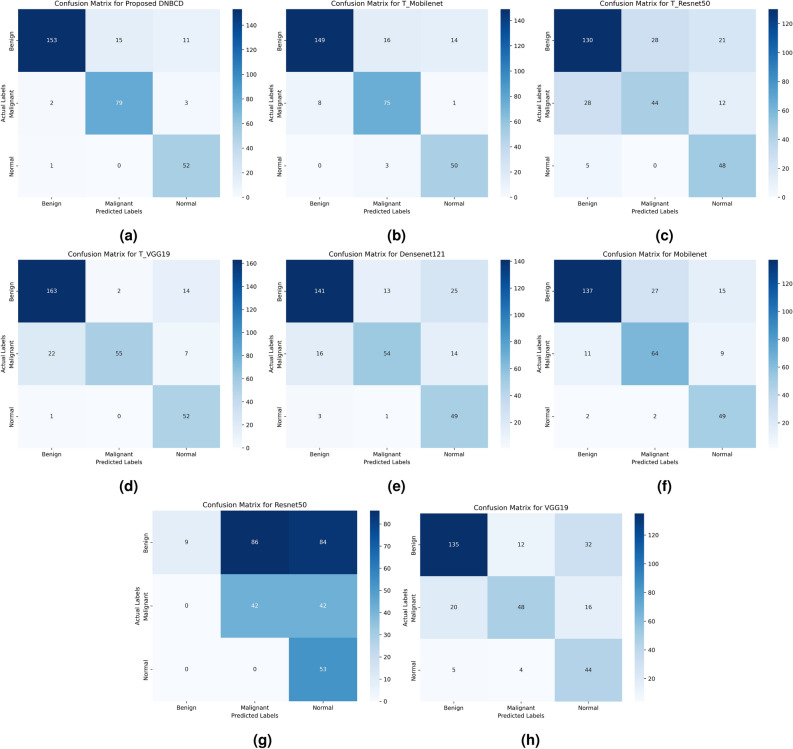
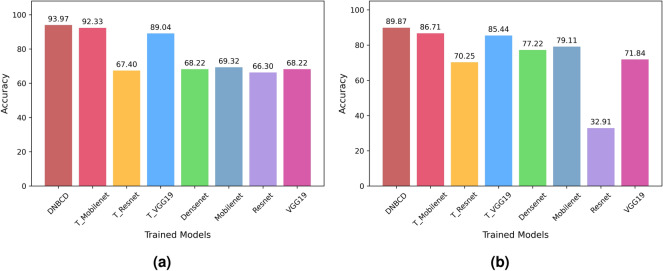
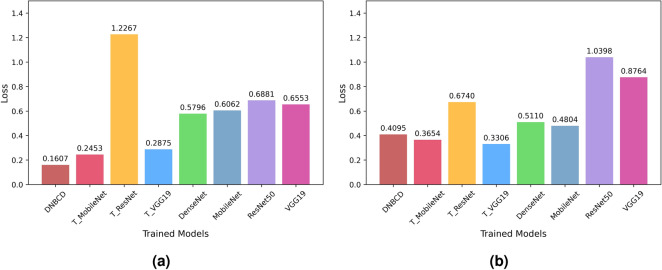
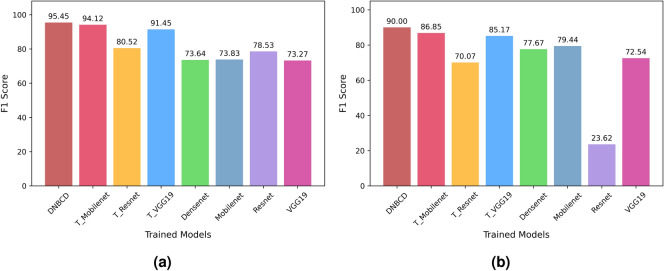
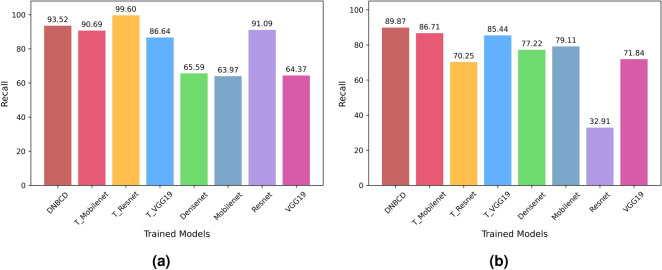
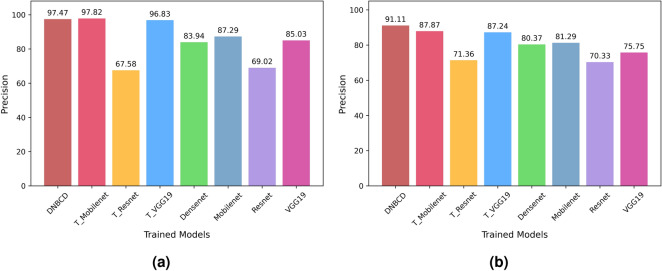
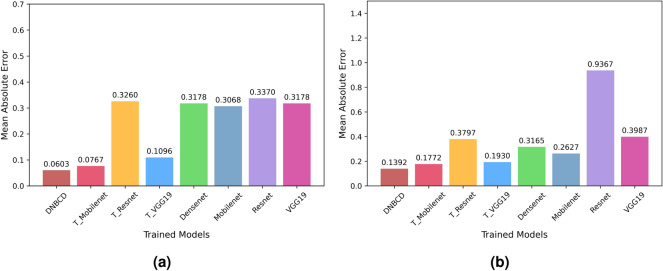
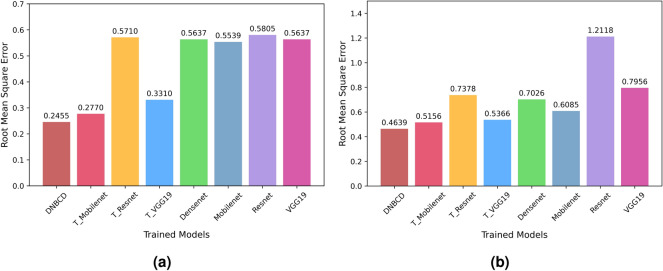
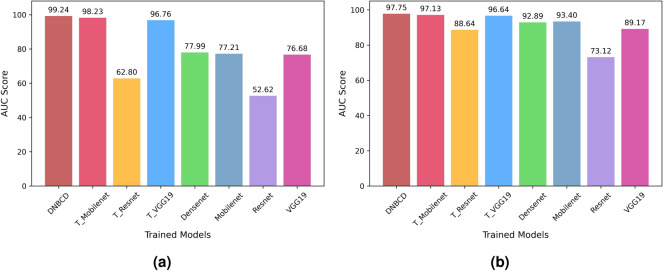
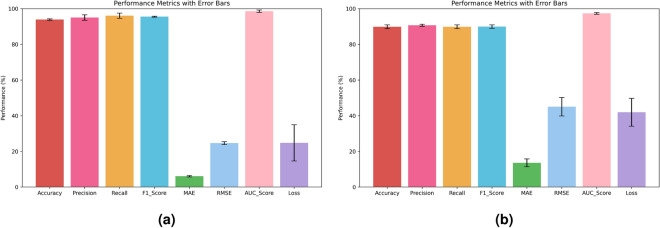
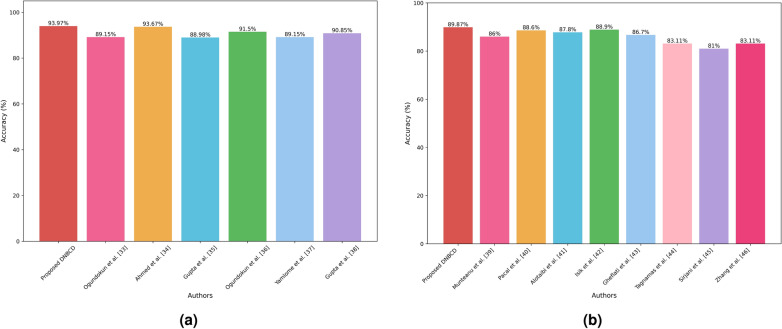
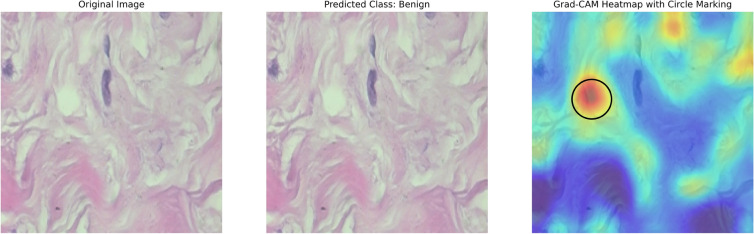
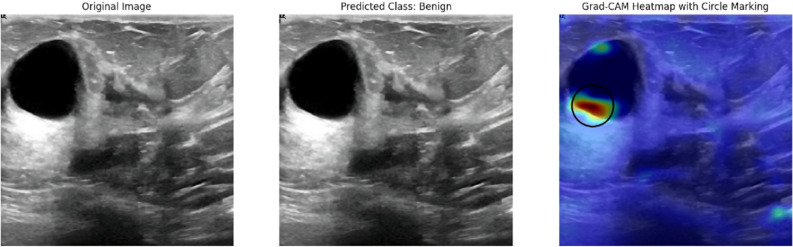
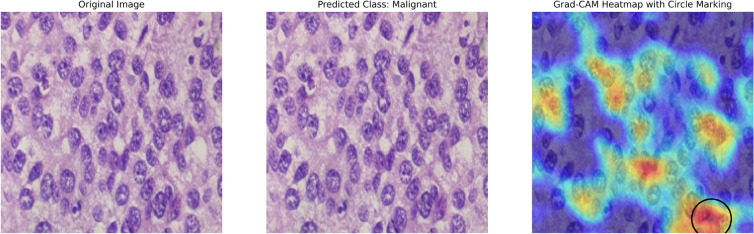
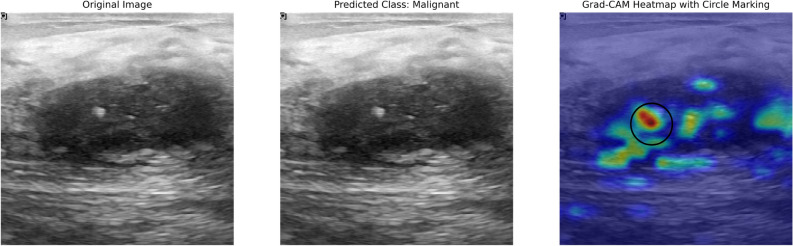
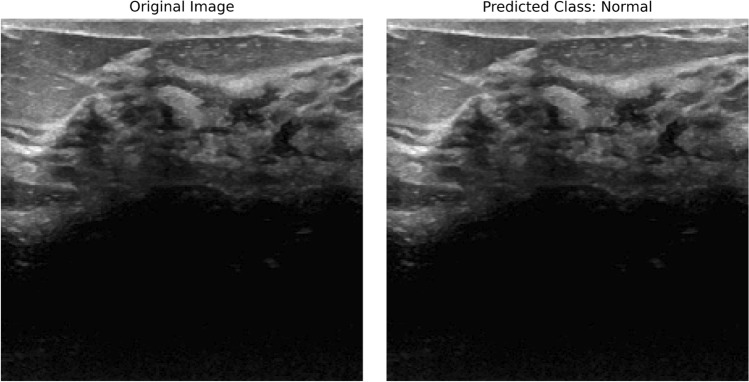
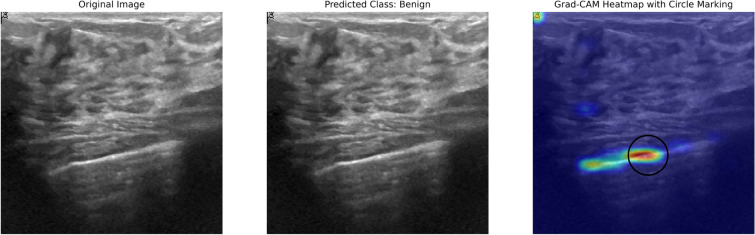
Breast cancer represents a significant global health challenge, which makes it essential to detect breast cancer early and accurately to improve patient prognosis and reduce mortality rates. However, traditional diagnostic processes relying on manual analysis of medical images are inherently complex and subject to variability between observers, highlighting the urgent need for robust automated breast cancer detection systems. While deep learning has demonstrated potential, many current models struggle with limited accuracy and lack of interpretability. This research introduces the Deep Neural Breast Cancer Detection (DNBCD) model, an explainable AI-based framework that utilizes deep learning methods for classifying breast cancer using histopathological and ultrasound images. The proposed model employs Densenet121 as a foundation, integrating customized Convolutional Neural Network (CNN) layers including GlobalAveragePooling2D, Dense, and Dropout layers along with transfer learning to achieve both high accuracy and interpretability for breast cancer diagnosis. The proposed DNBCD model integrates several preprocessing techniques, including image normalization and resizing, and augmentation techniques to enhance the model's robustness and address class imbalances using class weight. It employs Grad-CAM (Gradient-weighted Class Activation Mapping) to offer visual justifications for its predictions, increasing trust and transparency among healthcare providers. The model was assessed using two benchmark datasets: Breakhis-400x (B-400x) and Breast Ultrasound Images Dataset (BUSI) containing 1820 and 1578 images, respectively. We systematically divided the datasets into training (70%), testing (20%,) and validation (10%) sets, ensuring efficient model training and evaluation obtaining accuracies of 93.97% for B-400x dataset having benign and malignant classes and 89.87% for BUSI dataset having benign, malignant, and normal classes for breast cancer detection. Experimental results demonstrate that the proposed DNBCD model significantly outperforms existing state-of-the-art approaches with potential uses in clinical environments. We also made all the materials publicly accessible for the research community at: https://github.com/romzanalom/XAI-Based-Deep-Neural-Breast-Cancer-Detection .

Keywords: BUSI; Breakhis-400x; Breast cancer; CNN; DNBCD; Grad-CAM; Transfer learning; XAI.


Conflict of interest statement

Declarations. Competing interests: The authors declare no competing interests.

Figures

Fig. 1
Fig. 1
Sample of data in BreakHis-400x dataset where (a), (b) and (c) represent benign breast cancer, and (d), (e) and (f) represent malignant breast cancer.
Fig. 2
Fig. 2
Sample of data in BUSI dataset where (a) and (b) representing benign breast cancer, (c) and (d) representing malignant breast cancer, and (e) and (f) representing normal breast images.
Fig. 3
Fig. 3
Proposed methodology of DNBCD system.
Fig. 4
Fig. 4
Class distribution of different category from the B-400x dataset where (a) represents dataset class distribution of different category, (b) represents class distribution of train set, (c) represents class distribution of test set, (d) represents class distribution of validation set.
Fig. 5
Fig. 5
Class distribution of different category and sets from the BUSI where (a) represents class distribution of different category, (b) represents class distribution of train set, (c) represents class distribution of test set, and (d) represents class distribution of validation set.
Fig. 6
Fig. 6
Class weight of different category for handling class imbalance from the B-400x and BUSI dataset where (a) represents the class weight of different category for B-400x, and (b) represents the class weight of different category for BUSI.
Fig. 7
Fig. 7
Effect of the preprocessing processes applied to the B-400x dataset where (a) represents the original image, (b) is the resized version, (c) shows the normalized image, (d) illustrates the image after applying a formula image rotation, (e) depicts a height shift of 20%, (f) corresponds to a width shift of 20%, (g) represents a formula image shear transformation, (h) displays the horizontally flipped version and (i) shows a 15% zoomed image.
Fig. 8
Fig. 8
Proposed architecture of DNBCD model.
Fig. 9
Fig. 9
Comparative performance of loss curve and accuracy curve for different systems using B-400x dataset where (a) represents training accuracy curve, (b) represents training loss curve, (c) represents validation accuracy curve and (d) represents validation loss curve.
Fig. 10
Fig. 10
Comparative performance of loss curve and accuracy curve for different systems using BUSI dataset where (a) represents training accuracy curve, (b) represents training loss curve, (c) represents validation accuracy curve and (d) represents validation loss curve.
Fig. 11
Fig. 11
Confusion matrix for different trained models using Breakhis-400x dataset where (a) represents confusion matrix of DNBCD, (b) represents confusion matrix of T_Mobilenet, (c) represents confusion matrix of T_ResnetNet50, (d) represents confusion matrix of T_VGG19, (e) represents confusion matrix of Densnet121, (f) represents confusion matrix of Mobilenet, (g) represents confusion matrix of Resnet50, and (h) represents confusion matrix of VGG19.
Fig. 12
Fig. 12
Confusion matrix for different trained models using Breakhis-400x dataset where (a) represents confusion matrix of DNBCD, (b) represents confusion matrix of T_Mobilenet, (c) represents confusion matrix of T_ResnetNet50, (d) represents confusion matrix of T_VGG19, (e) represents confusion matrix of Densnet121, (f) represents confusion matrix of Mobilenet, (g) represents confusion matrix of Resnet50, and (h) represents confusion matrix of VGG19.
Fig. 13
Fig. 13
Accuracy comparison of different trained state-of-the-art models for B-400x and BUSI datasets using bar charts, where (a) represents accuracy comparison for B-400x dataset, and (b) represents accuracy comparison for BUSI dataset.
Fig. 14
Fig. 14
Loss comparison of different trained state-of-the-art models for B-400x and BUSI datasets using bar charts, where (a) represents loss comparison for B-400x dataset, and (b) represents loss comparison for BUSI dataset.
Fig. 15
Fig. 15
F1-score comparison of different trained state-of-the-art models for B-400x and BUSI datasets using bar charts, where (a) represents F1-score comparison for B-400x dataset, and (b) represents F1-score comparison for BUSI dataset.
Fig. 16
Fig. 16
Recall comparison of different trained state-of-the-art models for B-400x and BUSI datasets using bar charts, where (a) represents recall comparison for B-400x dataset, and (b) represents recall comparison for BUSI dataset.
Fig. 17
Fig. 17
Precision comparison of different trained state-of-the-art models for B-400x and BUSI datasets using bar charts, where (a) represents precision comparison for B-400x dataset, and (b) represents precision comparison for BUSI dataset.
Fig. 18
Fig. 18
Mean Absolute Error (MAE) comparison of different trained state-of-the-art models for B-400x and BUSI datasets using bar charts, where (a) represents MAE comparison for B-400x dataset, and (b) represents MAE comparison for BUSI dataset.
Fig. 19
Fig. 19
Root Mean Square Error (RMSE) comparison of different trained state-of-the-art models for B-400x and BUSI datasets using bar charts, where (a) represents RMSE comparison for B-400x dataset, and (b) represents RMSE comparison for BUSI dataset.
Fig. 20
Fig. 20
AUC Score comparison of different trained state-of-the-art models for B-400x and BUSI datasets using bar charts, where (a) represents AUC score comparison for B-400x dataset, and (b) represents AUC score comparison for BUSI dataset.
Fig. 21
Fig. 21
Performance metrics with error bars for the B-400x and BUSI datasets where (a) represents performance with error bars using the B-400x dataset and (b) represents performance with error bars using the BUSI dataset, and Each colored bar denotes a different metric, and black error bars indicate the standard deviation across multiple runs.
Fig. 22
Fig. 22
Performance comparison of existing research with accuracy in graphical form, where (a) represents accuracy comparison using B-400x dataset and (b) represents accuracy comparison using BUSI dataset.
Fig. 23
Fig. 23
Example output of DNBCD system for detecting breast cancer from the Break-400x dataset the first panel (left) representing original image having breast cancer, second panel (center) predicted class of benign from the original image, and third panel (right) GradCam heatmap image for explaining detected breast cancer region indicated with red and yellow color and marked by black circle for most affected area.
Fig. 24
Fig. 24
Example output of DNBCD system for detecting breast cancer from the BUSI Dataset the first panel (left) representing original image having breast cancer, second panel (center) predicted class of benign from the original image, and third panel (right) GradCam heatmap image for explaining detected breast cancer region indicated with red and yellow Color and marked by black circle for most affected area.
Fig. 25
Fig. 25
Example output of DNBCD system for detecting breast cancer from the Break-400x dataset the first panel (left) representing original image having breast cancer, second panel (center) predicted class of malignant from the original image, and third panel (right) GradCam heatmap image for explaining detected breast cancer region indicated with red and yellow color and marked by black circle for most affected area.
Fig. 26
Fig. 26
Example output of DNBCD system for detecting breast cancer from the BUSI dataset the first panel (left) representing original image having breast cancer, second panel (center) predicted class of malignant from the original image, and third panel (right) GradCam heatmap image for explaining detected breast cancer region indicated with red and yellow color and marked by black circle for most affected area.
Fig. 27
Fig. 27
Example output of DNBCD system for detecting non-breast cancer from the BUSI dataset the first panel (left) representing original image having non-breast cancer, second panel (right) predicted class of normal.
Fig. 28
Fig. 28
Example output of DNBCD system for incorrect detecting breast cancer from the BUSI dataset the first panel (left) representing original image having non-breast cancer, second panel (center) predicted class of benign from the original image, and third panel (right) Grad Cam heatmap image for explaining detected breast cancer region indicated with red and yellow color and marked by black circle for most affected area.

Similar articles

References

    1. Bray, F. et al. Global cancer statistics 2022: Globocan estimates of incidence and mortality worldwide for 36 cancers in 185 countries. CA Cancer J. Clin.74, 229–263 (2024). - PubMed
    1. Organization, W. H. World health organization (who) — https://www.who.int/ (2024). [Accessed 20-08-2024].
    1. Foundation, N. B. C. Breast cancer facts & stats 2024 - incidence, age, survival, & more. https://www.nationalbreastcancer.org/breast-cancer-facts/#~: (2024). [Accessed 08-08-2024].
    1. Breastcancer.org. Breast cancer facts and statistics 2024 — breastcancer.org. https://www.breastcancer.org/facts-statistics (2024). [Accessed 08-08-2024].
    1. for Biotechnology Information, N. C. Breast cancer early detection: a phased approach to implementation. https://www.ncbi.nlm.nih.gov/pmc/articles/PMC7237065/ (2024). [Accessed 08-08-2024].

MeSH terms

LinkOut - more resources