. 2025 May 20;15(1):17541.
doi: 10.1038/s41598-025-01885-4.

The complexity of pharmaceutical expenditures across U.S. states

Affiliations

The complexity of pharmaceutical expenditures across U.S. states

Lisa Cross et al. Sci Rep. .

Abstract

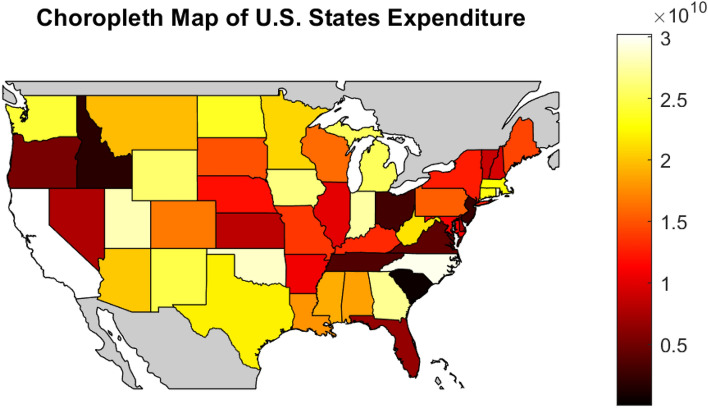
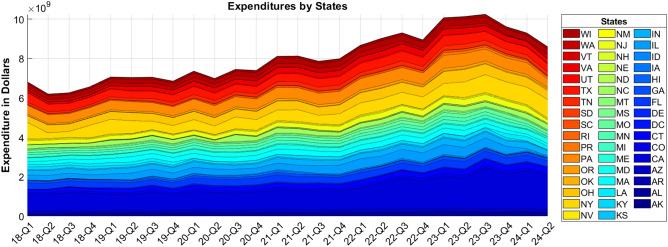
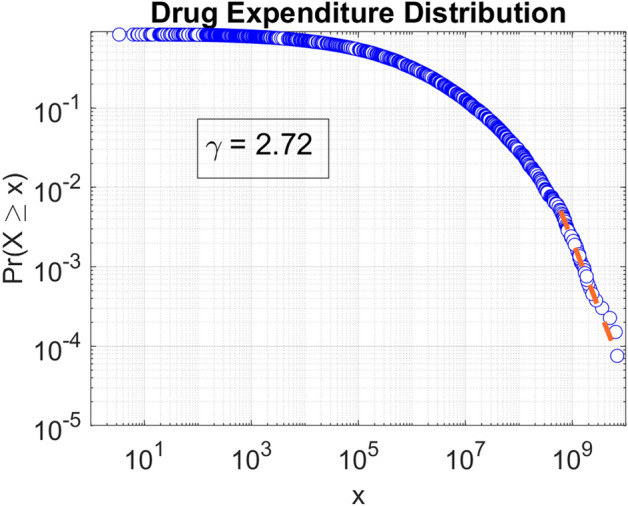
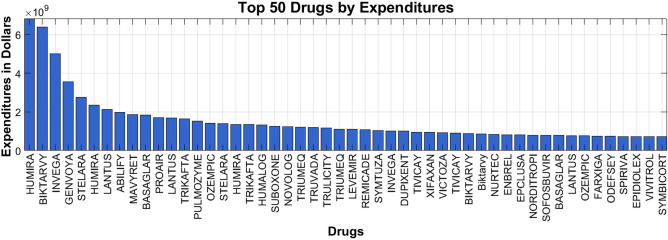
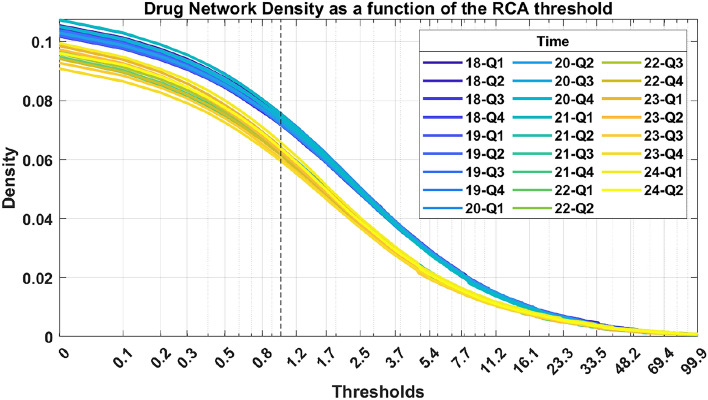
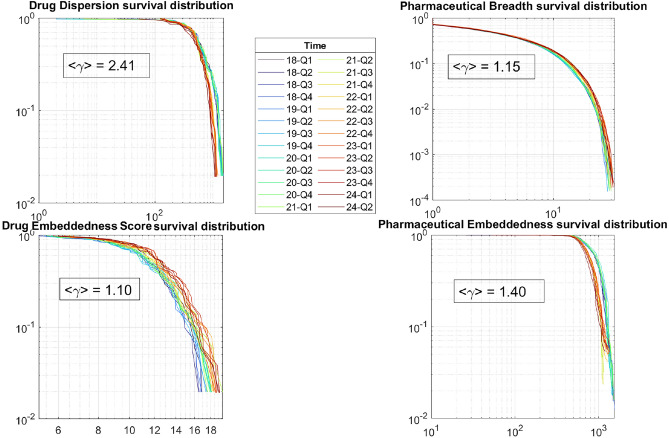
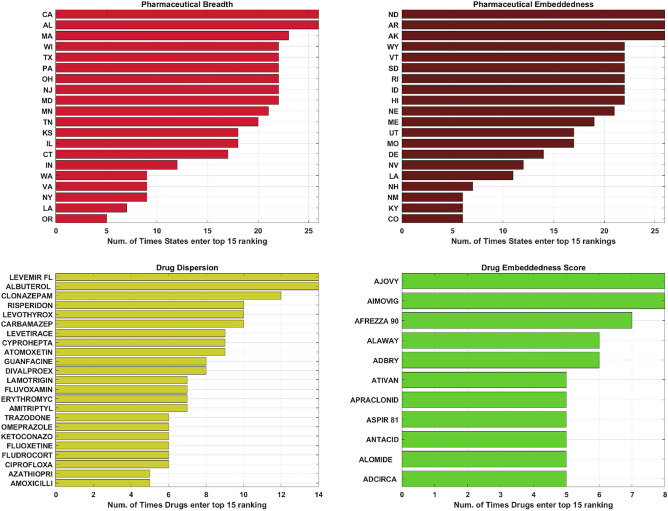
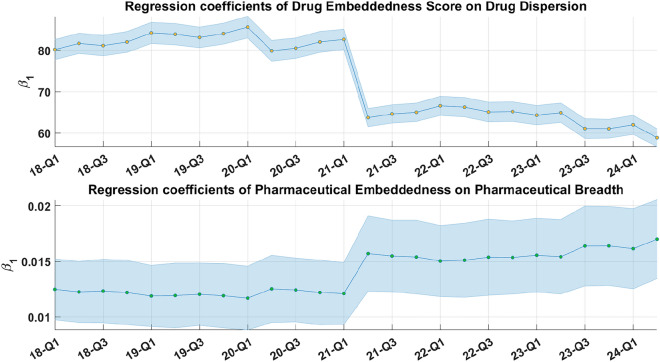
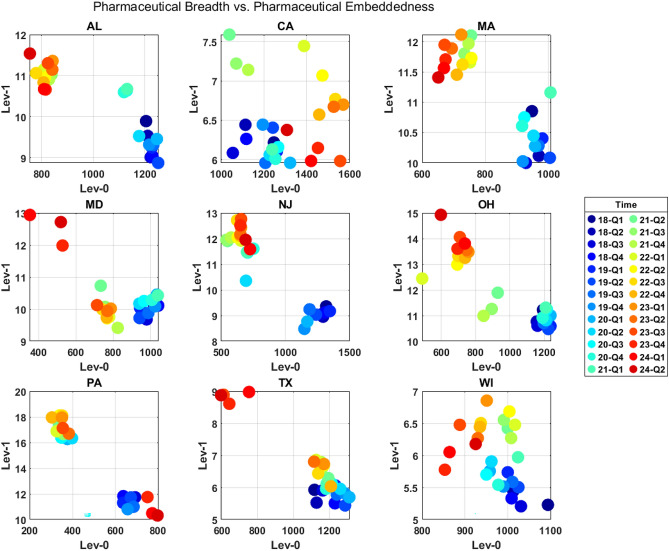
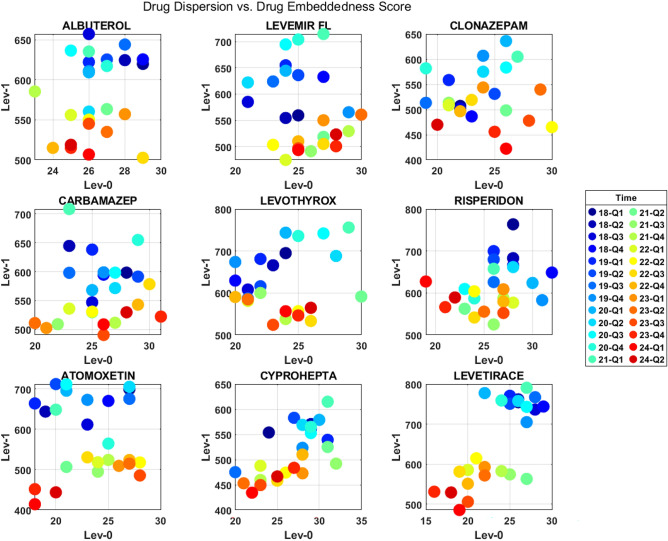
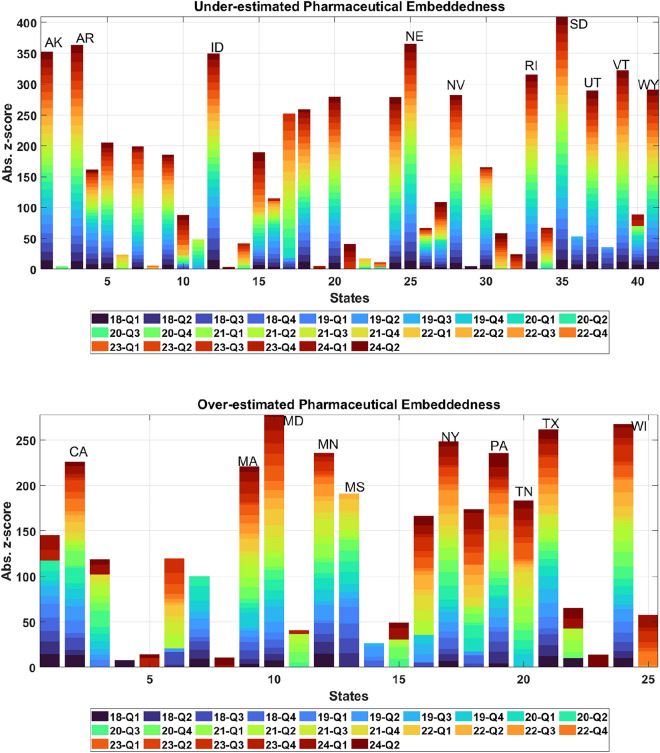
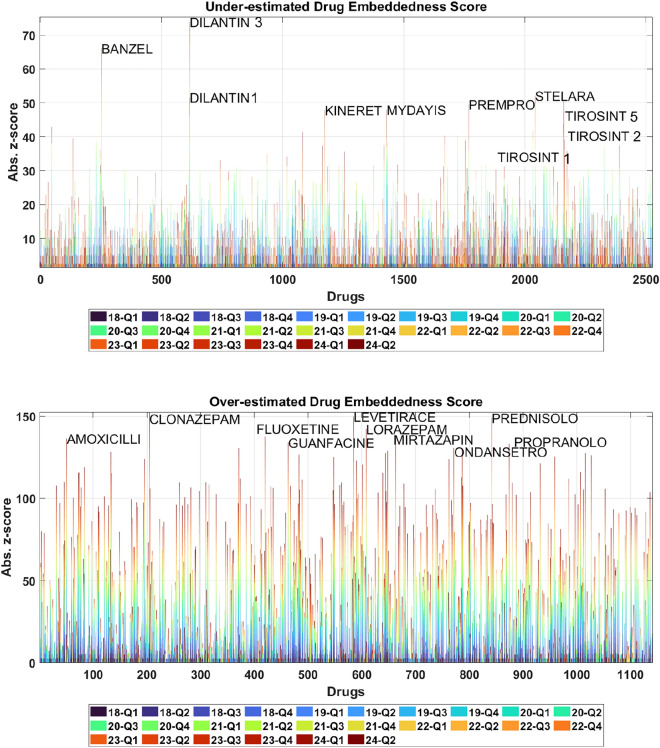
Understanding the complexity of pharmaceutical expenditures across U.S. states is critical for designing efficient healthcare policies and ensuring equitable drug access. This study applies network-based economic complexity methods to analyze state-level Medicaid drug spending, leveraging Medicaid State Drug Utilization Data (SDUD) from 2018 to 2024. Using Revealed Comparative Advantage (RCA) and the Method of Reflections, we quantify the sophistication of pharmaceutical consumption and identify structural inefficiencies in drug reimbursement policies. Our findings reveal substantial heterogeneity in pharmaceutical complexity across states, with highly diversified markets in states like California and Texas, while others, such as Wyoming and West Virginia, exhibit lower complexity due to restrictive formulary policies and healthcare infrastructure limitations. A 15% decline in network density over the study period suggests consolidation in reimbursement practices, influenced by regulatory interventions and cost-containment strategies. Additionally, Medicaid expansion states show a 20% increase in prescription utilization, particularly for antiviral and mental health medications. Null model comparisons highlight systematic deviations from expected expenditure patterns, with states like Arkansas and Nebraska showing lower-than-expected pharmaceutical embeddedness, whereas Massachusetts and California appear more integrated than network models predict. These findings suggest that state-specific policies, provider behavior, and market dynamics significantly shape pharmaceutical expenditures beyond structural network constraints, as well as they offer significant implications for policymakers and healthcare providers seeking to balance cost efficiency with equitable medication distribution.


Conflict of interest statement

Declarations. Competing interests: The authors declare no competing interests.

Figures

Fig. 1
Fig. 1
Geographic distribution of pharmaceutical expenditures across U.S. states. The choropleth map illustrates total state-level pharmaceutical expenditures during the period 2018-2024, with darker shades representing lower spending and lighter shades indicating higher expenditures. California, the state with the highest spending, is depicted in white. States in the Northeast, Southeast, and parts of the Midwest exhibit relatively high expenditures, while lower spending is observed in central and western states. Alaska and Hawaii are excluded for visualization purposes but have relatively low expenditures. The scale on the right represents expenditures in U.S. dollars.
Fig. 2
Fig. 2
Quarterly pharmaceutical expenditures across U.S. states (2018–2024). The stacked area plot illustrates the quarterly pharmaceutical expenditures of each U.S. state, with the total area representing aggregate national spending, where the color-coded gradient differentiates between states according to the legend. The overall trend shows a steady increase in spending over time, with a notable surge around 2020 due to the COVID-19 pandemic.
Fig. 3
Fig. 3
Cumulative distribution of drug expenditures. The figure shows the cumulative distribution of drug expenditures, which follows a power-law behavior with an estimated exponent of formula image. This indicates a heavy-tailed distribution, where a small number of instances account for a disproportionately large share of total expenditure.
Fig. 4
Fig. 4
Bar-plot of the top 50 drugs by expenditure in the U.S. from 2018 to 2024. The bar chart provides a detailed view of total spending on the most costly medications, with expenditures mainly driven by high-cost biologics, chronic disease therapies, and antiviral treatments.
Fig. 5
Fig. 5
Drug network density as a function of the RCA threshold from 2018 to 2024. The network density represents the proportion of observed state-drug connections relative to all possible connections, and decreases as the RCA threshold increases. Blue tones correspond to earlier quarters (2018-2020), while yellow tones represent later quarters (2021-2024). The shift in color gradient highlights a decrease in network density over time, suggesting evolving pharmaceutical spending patterns. The dashed vertical line at RCA = 1 indicates the threshold beyond which a state is considered to have a revealed comparative advantage in a given drug.
Fig. 6
Fig. 6
Survival distributions of four key pharmaceutical network metrics derived from the first two levels of the Method of Reflections applied to the state-drug expenditure network. The Drug Dispersion (top left) quantifies the extent to which drugs are reimbursed across states, while the Pharmaceutical Breadth (top right) measures the diversity of drugs in which states exhibit significant spending specialization. The Drug Embeddedness Score (bottom left) captures how distinct a drug’s demand is across states, and the Pharmaceutical Embeddedness (bottom right) reflects the extent to which a state’s pharmaceutical portfolio aligns with the broader drug market structure. Each plot reports the survival distribution of the respective measure over time, with earlier quarters (2018-2020) in blue tones and later quarters (2021-2024) in red and orange. The average power-law exponent for each distribution is reported in the inset of each box, highlighting the underlying scaling behavior of each metric.
Fig. 7
Fig. 7
Frequency of states and drugs entering the top-15 rankings based on the first two levels of the Method of Reflections applied to pharmaceutical expenditures. The top-left panel (Pharmaceutical Breadth) measures the diversity of a state’s pharmaceutical spending, with higher values indicating broader expenditures across different drugs. The top-right panel (Pharmaceutical Embeddedness) captures how well a state’s pharmaceutical expenditures align with national consumption patterns. The bottom-left panel (Drug Dispersion) identifies drugs that are widely reimbursed across multiple states, reflecting their centrality in pharmaceutical demand. The bottom-right panel (Drug Embeddedness Score) measures whether a drug is predominantly consumed in states with broad or narrow pharmaceutical portfolios, indicating whether its usage is concentrated in highly diversified versus less diversified state markets.
Fig. 8
Fig. 8
Time series of the regression coefficients linking level-1 measures to level-0 metrics for both drugs and states. The top panel shows the regression coefficients formula image of drug embeddedness scores on drug dispersion, showing an initial period of stability followed by a sharp decline in 2020-Q2, suggesting a structural shift in drug distribution patterns. The bottom panel presents the regression coefficients of pharmaceutical embeddedness on pharmaceutical breadth, illustrating a relatively stable relationship until 2020, after which the coefficients increase, indicating a growing influence of embeddedness on the diversity of reimbursed drugs. The shaded regions represent confidence intervals.
Fig. 9
Fig. 9
Evolution of the relationship between pharmaceutical breadth (Lev-1, i.e. the number of distinct drugs reimbursed in a state) and pharmaceutical embeddedness (Lev-0, i.e. the alignment of a state’s pharmaceutical spending with national consumption patterns) for the top nine states (reported in the title of each panel) in terms of pharmaceutical breadth. Each circle represents a quarterly observation, with blue colors for earlier years (2018) and red for more recent years (2024). Over time, most states exhibit a shift from high pharmaceutical breadth and low embeddedness (bottom-right) to lower breadth and higher embeddedness (top-left).
Fig. 10
Fig. 10
Evolution of Drug Dispersion (Lev-0) versus Drug Embeddedness Score (Lev-1) for the top nine most widely reimbursed drugs (reported in the title of each panel) across U.S. states from 2018 to 2024. Each point represents a quarterly observation, with colors indicating time (blue for earlier years, red for recent). The general trend shows that while some drugs have a clear contraction in reimbursement coverage (decreasing Lev-1), others exhibit more dispersed or stable patterns.
Fig. 11
Fig. 11
Absolute z-scores of pharmaceutical embeddedness discrepancies across U.S. states. The top panel shows states where embeddedness is under-estimated by the null model, meaning they exhibit lower-than-expected pharmaceutical integration. The bottom panel displays states where embeddedness is over-estimated, indicating higher-than-expected integration given their pharmaceutical expenditure and distribution. The color gradient within each bar represents different time stamps, illustrating the temporal evolution of these discrepancies. Highlighted state labels indicate the ten most extreme cases in each category.
Fig. 12
Fig. 12
Absolute z-scores of drug embeddedness discrepancies in the pharmaceutical network. The upper panel displays drugs for which the observed embeddedness is statistically lower than predicted by the null model (under-estimated), indicating weaker integration than expected given their network position. The lower panel highlights drugs whose embeddedness is statistically higher than predicted (over-estimated). The color gradient in the bars represents different time stamps, illustrating the persistence of these discrepancies over time.

Similar articles

References

    1. Miller, R. D. & Frech, H. Is there a link between pharmaceutical consumption and improved health in oecd countries?. Pharmacoeconomics18, 33–45 (2000). - PubMed
    1. Sommers, B. D. & Oellerich, D. The poverty-reducing effect of medicaid. J. Health Econ.32, 816–832 (2013). - PubMed
    1. De Nardi, M., French, E. & Jones, J. B. Medicaid insurance in old age. Am. Econ. Rev.106, 3480–3520 (2016). - PubMed
    1. Sommers, B. D., Baicker, K. & Epstein, A. M. Mortality and access to care among adults after state medicaid expansions. N. Engl. J. Med.367, 1025–1034 (2012). - PubMed
    1. Sommers, B. D. & Grabowski, D. C. What is medicaid? more than meets the eye. JAMA318, 695–696 (2017). - PubMed

LinkOut - more resources