. 2025 May 20;9(1):148.
doi: 10.1038/s41698-025-00897-7.

Multimodal spatial proteomic profiling in acute myeloid leukemia

Affiliations

Multimodal spatial proteomic profiling in acute myeloid leukemia

Christopher P Ly et al. NPJ Precis Oncol. .

Abstract

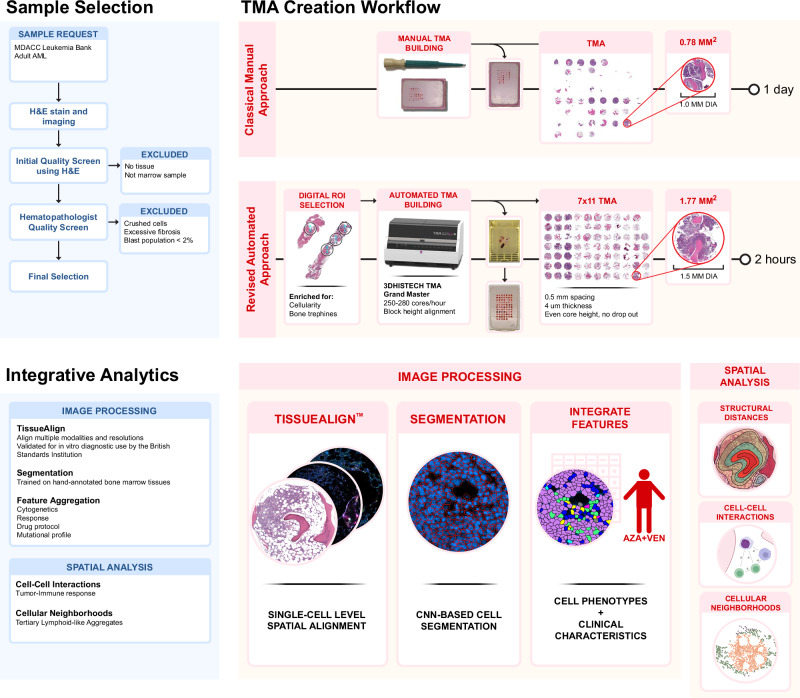
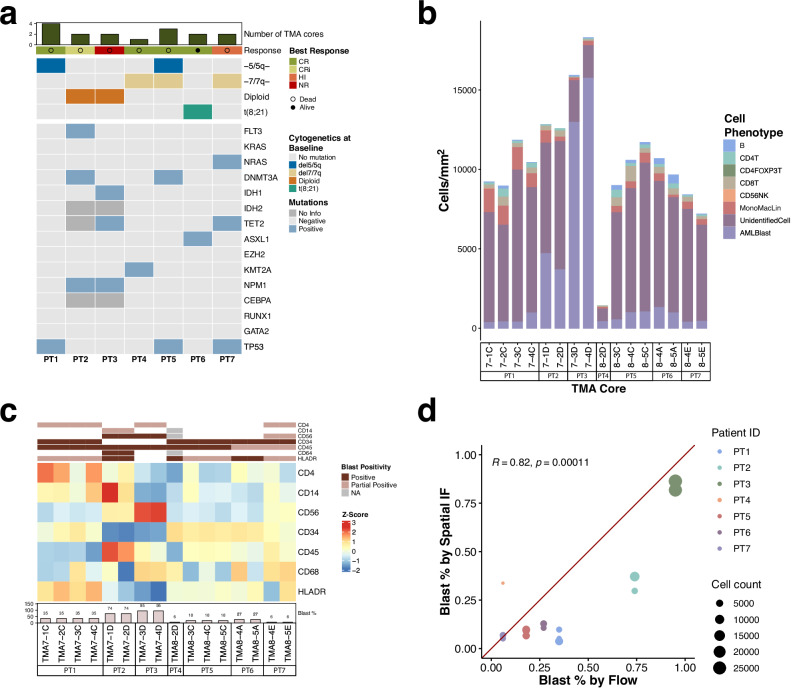
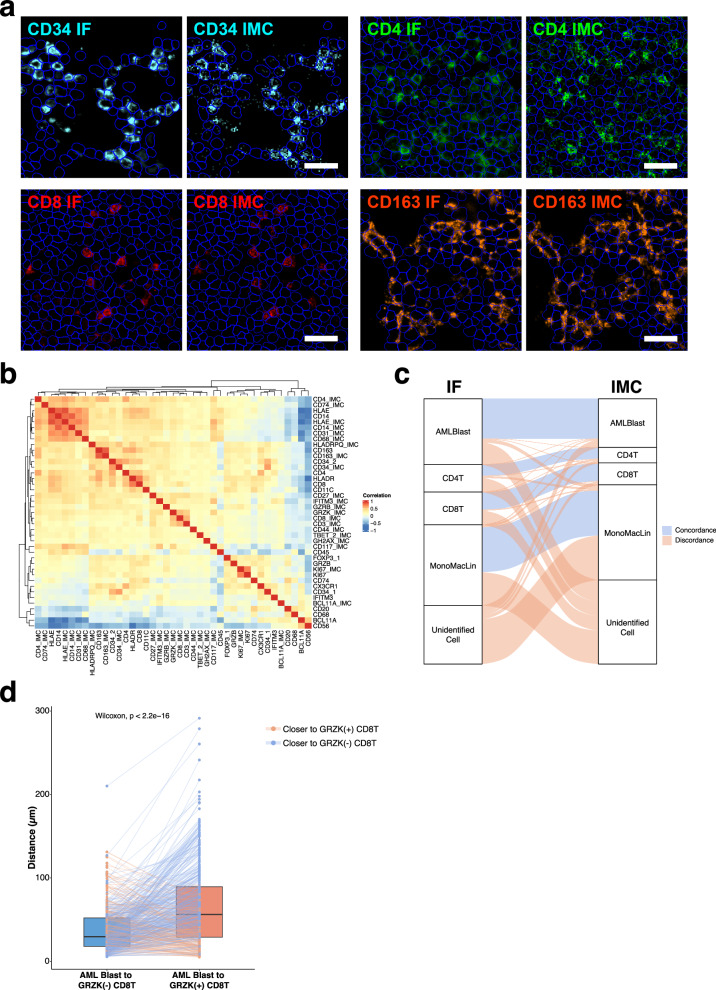
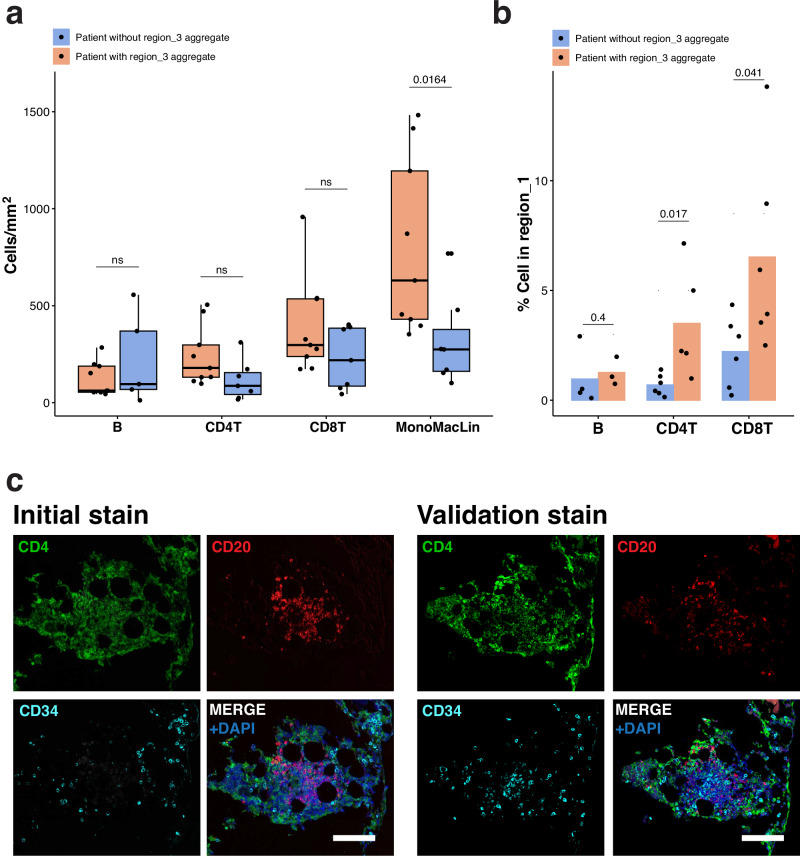
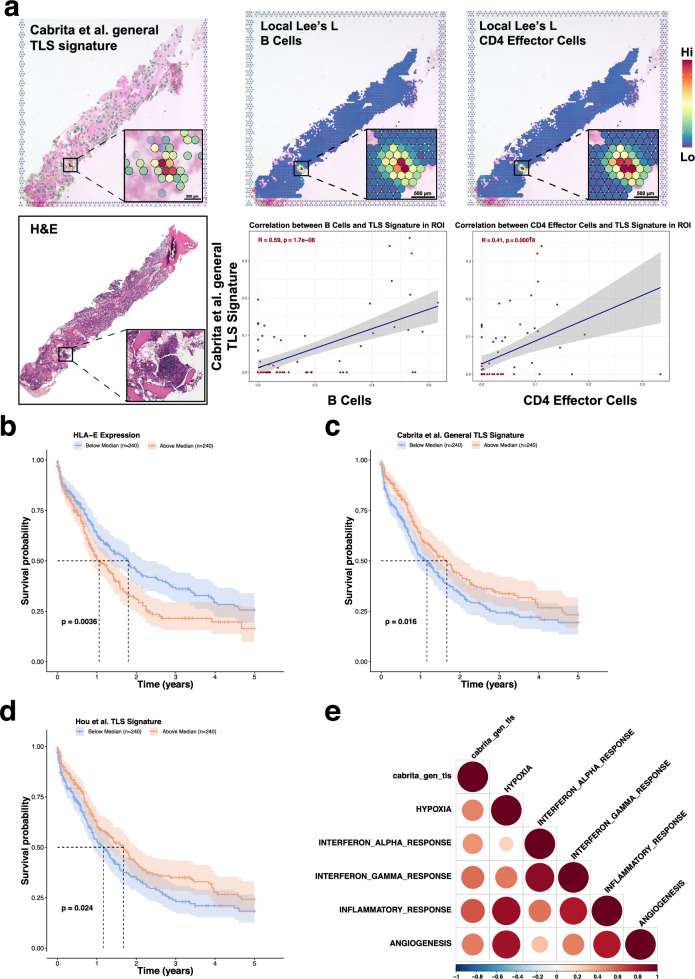
Acute myeloid leukemia (AML) resides in an immune-rich microenvironment, yet, immune-based therapies have faltered in eliciting durable responses. Bridging this paradox requires a comprehensive understanding of leukemic interactions within the bone marrow microenvironment. We optimized a high-throughput tissue-microarray-based pipeline for high-plex spatial immunofluorescence and mass cytometry imaging on a single slide, capturing immune, tumor, and structural components. Using unbiased clustering on the spatial K function, we unveiled the presence of tertiary lymphoid-like aggregates in bone marrow, which we validated using spatial transcriptomics and an independent proteomics approach. We then found validated TLS signatures predictive of outcomes in AML using an integrated public 480-patient transcriptomic dataset. By harnessing high-plex spatial proteomics, we open the possibility of discovering novel structures and interactions that underpin leukemic immune response. Further, our study's methodologies and resources can be adapted for other bone marrow diseases where decalcification and autofluorescence present challenges.


Conflict of interest statement

Competing interests: All authors declare no competing interests.

Figures

Fig. 1
Fig. 1. Overview of the multimodal bone marrow imaging pipeline.
Patient bone marrow biopsies are ordered based on study suitability and then undergo rigorous quality screening. A digital automated approach for TMA building is used, which increases quality, reproducibility, and speed compared to manual TMA building. The analysis workflow begins by aligning all modalities to a common reference. Imaging data is decomposed into cells by cell segmentation with the U-Net convolutional neural network. Clinical and cell features are aggregated, allowing for comprehensive high-resolution analysis on spatial neighborhoods, structural proximity, and marker enrichment. Figure created in Biorender.
Fig. 2
Fig. 2. Immunofluorescent profiling of the bone marrow corresponds with clinical spectral flow.
a Oncoprint of the cytogenetics, response, and mutational characteristics of patients 1–7. b Stacked bar plot showing cell type densities by TMA core. c Immunophenotype of AML cells by flow aligns with marker expression in spatial IF. d AML blasts measured by IF significantly correlate with reported blast percentages by flow cytometry (Pearson correlation, R = 0.82, p = 0.00011).
Fig. 3
Fig. 3. Spatial IF to IMC results in degradation of nuclear signal in IMC without compromising antigen signal.
a Comparison of CD34 (pseudocolored cyan), CD4 (pseudocolored green), CD8 (pseudocolored red), and CD163 (pseudocolored orange) staining performance in IF and IMC shows high concordance, validating cell segmentation and spatial alignment approaches. Scale bar, 25 µm. b Correlation of the same slide imaging between IF and IMC markers. c Alluvial plot showing proportions of concordance and discordance of the same cells phenotyped using only IMC markers and using only IF markers. d Distance of AML cells to granzyme K-negative and granzyme K-positive cells. Connected dots represent the distances for the same AML blast cell (paired Wilcoxon test, p < 2.2e-16).
Fig. 4
Fig. 4. Spatial neighborhoods reveal tertiary lymphoid-like aggregates.
a Unbiased clustering of the spatial K function for each cell type reveals five different cellular regions of varying proportions per tissue core. Of note, region_3 only appears in three cores. b Relative enrichment of cell types for each cellular region. c Region assignment of cells within the TLS-like structures, with corresponding micrographs. CD34(+) AML cells are shown in pseudocolored cyan, CD4(+) T cells in pseudocolored green, and CD20(+) B cells in pseudocolored red. DAPI (pseudocolored blue) was used as a nuclear counterstain. Scale bar, 100 µm.
Fig. 5
Fig. 5. Spatial analysis reveals microenvironmental differences with lymphocyte aggregates.
a Cell densities for B cells, CD4(+) T cells (CD4T), CD8(+) T cells (CD8T), and monocyte-macrophage lineage cells (MonoMacLin). Each dot represents an individual TMA core (Wilcoxon test). b Percent of B cells, CD8(+) T cells, and CD4(+) T cells in region_1 (AML-enriched) areas between TMA cores with and without region_3 aggregates. Dots represent an individual TMA core (Wilcoxon test). c Micrographs showing COMET stain and Opal validation stain for the region_3 aggregate of TMA8-3C. The two methods showed similar staining patterns for CD4 (pseudocolored green), CD8 (pseudocolored red), and CD34 (pseudocolored cyan). DAPI (pseudocolored blue) was used as a nuclear counterstain. Scale bar, 100 µm.
Fig. 6
Fig. 6. TLS signatures show prognostic value in transcriptomics.
a Spatial transcriptomics of Cabrita et al. TLS signature shown with the Local Lee’s L spatial statistic when using a B cell signature as a covariate, and when using a CD4 effector T cell signature as a covariate, along with the correlation between signatures in the TLS-like ROI (Pearson correlation test). b Kaplan–Meier survival curves of AML patients from TCGA, Beat-AML, and MDACC by median score of the Hou et al. TLS signature. c Kaplan–Meier survival curves of AML patients from TCGA, Beat-AML, and MDACC by median score of the Cabrita et al. TLS signature. d Kaplan–Meier survival curves of AML patients from TCGA, Beat-AML, and MDACC by median HLA-E expression. e Correlation plot of Cabrita et al. TLS signature and significantly correlated Hallmark signatures (Pearson correlation test).

References

    1. Longo, D. L., Döhner, H., Weisdorf, D. J. & Bloomfield, C. D. Acute myeloid leukemia. N. Engl. J. Med.373, 1136–1152 (2015). - PubMed
    1. Döhner, H. et al. Diagnosis and management of acute myeloid leukemia in adults: recommendations from an international expert panel, on behalf of the European LeukemiaNet. Blood115, 453–474 (2010). - PubMed
    1. Daver, N. et al. Azacitidine (AZA) with nivolumab (Nivo), and AZA with Nivo +Ipilimumab (Ipi) in relapsed/refractory (R/R) acute myeloid leukemia: clinical and immune biomarkers of response. Blood136, 43–45 (2020).
    1. Tettamanti, S., Pievani, A., Biondi, A., Dotti, G. & Serafini, M. Catch me if you can: how AML and its niche escape immunotherapy. Leukemia36, 13–22 (2022). - PMC - PubMed
    1. Colmone, A. et al. Leukemic cells create bone marrow niches that disrupt the behavior of normal hematopoietic progenitor cells. Science322, 1861–1865 (2008). - PubMed

LinkOut - more resources