. 2025 Jul;39(7):1744-1755.
doi: 10.1038/s41375-025-02628-0. Epub 2025 May 20.

Induction of p53-mediated apoptosis by azacitidine in patient-derived xenograft follicular helper T-cell lymphoma model

Affiliations

Induction of p53-mediated apoptosis by azacitidine in patient-derived xenograft follicular helper T-cell lymphoma model

Gamze Tari Crochet et al. Leukemia. 2025 Jul.

Abstract

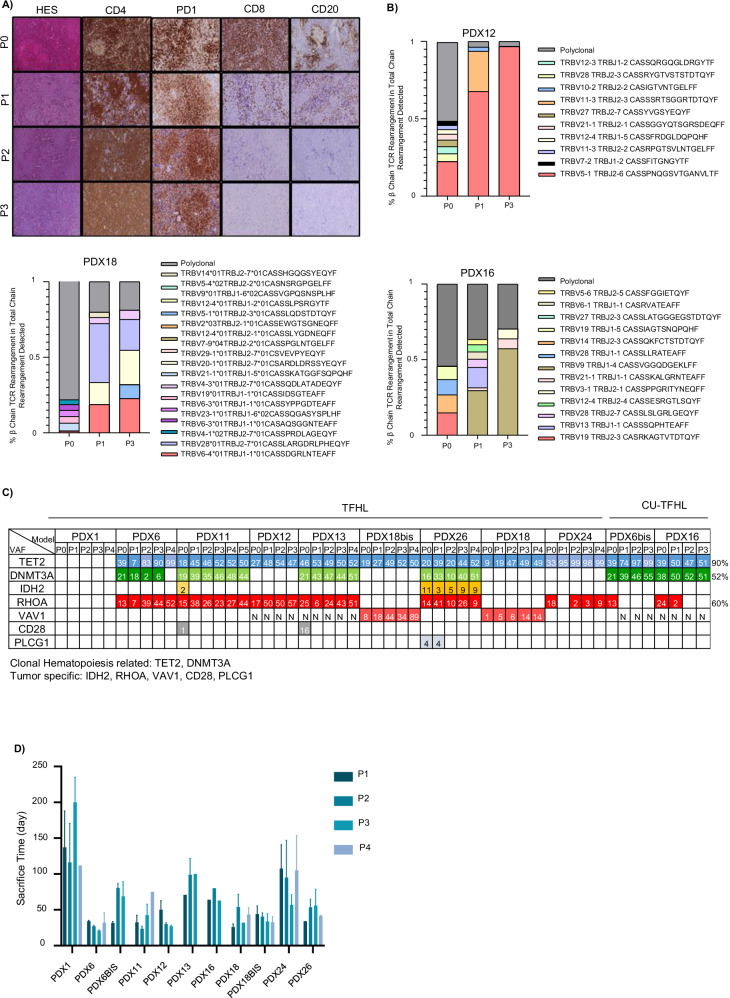
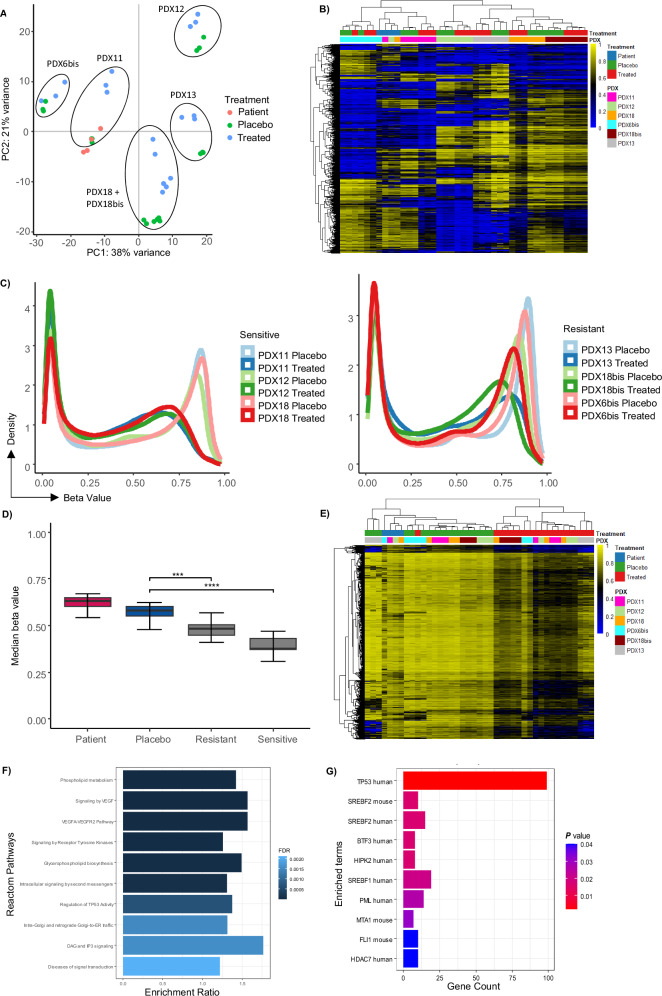
Follicular helper T-cell lymphoma (TFHL) is the most common non-cutaneous T-cell lymphoma in the Western world and is associated with a poor prognosis. Neoplastic cells rely heavily on the tumor microenvironment, demonstrated by the absence of TFHL-derived cell lines, which hinders therapeutic progress. To overcome this limitation, we developed and characterized patient-derived xenograft TFHL (TFHL-PDXs). Fifteen TFHLs were implanted into immunodeficient mice, generating nine PDXs. The tumor microenvironment was detected in the first passage but progressively disappeared in subsequent passages. TET2 mutations persisted in all cases and TFHL-specific mutations were observed in most. The models were treated with azacitidine and patient sensitivity was fully recapitulated. To elucidate the mechanism of action of azacitidine, we analyzed the differences in DNA methylation and gene expression in six TFHL-PDX models. Global DNA hypomethylation occurred in azacitidine-treated cells in drug-sensitive models but not in the resistant ones. DNA hypomethylation was associated with global upregulation of gene expression, including that of various cancer-related pathways, suggestive of p53-pathway-mediated cytotoxicity. Overall, the PDXs recapitulated TFHL features and exhibited sensitivity to azacitidine. They also made it possible to decipher the mechanism responsible for the effect of azacitidine, revealing the activation of p53-mediated apoptosis associated with DNA hypomethylation.


Conflict of interest statement

Competing interests: GT, SAY, AF, MC, AC, NS, CR, JN, AG, DLM, MHDL, VA, RS, and PG have no conflict of interest to declare. FL has received a research grant from BMS and Roche, a travel grant from Roche, Gilead, and Abbvie, and honoraria grants from Takeda and AstraZeneca. FL is on the advisory board of Miltenyi, Kyowa Kirin, and BMS.

Figures

Fig. 1
Fig. 1. PDX generation and characterization.
A Schematic representation of PDX generation. B Tumor involvement: Circles represent enlarged lymph nodes, and arrows indicate areas of high vascularization and splenomegaly. C Heatmap showing the extent of organ infiltration in different models. Tissue samples from the spleen, lymph nodes, liver, kidneys, lungs, and skin were semi-quantitatively evaluated by pathologists, and the degree of infiltration is categorized as mild, moderate, or massive. Blood and bone marrow infiltration are reported as the percentage of hCD45 + CD4 + PD1+ cells as measured by flow cytometry. D Phenotypic characterization of PDX models by immunohistochemistry. Staining of spleen tissue at passage 1. H&E (10x), TFH markers: CD4 (10x), ICOS (20x), PD1 (20x), BCL6 (20x), and CXCL13 (20x), and microenvironment markers: CD8 (10x) and CD20 (10x). E Phenotypic characterization of PDX models by flow cytometry. Staining of splenocytes from passage 1. Panel includes CD45, CD19, CD3, CD8, CD4, ICOS, and PD1. LN lymph nodes, BM bone marrow.
Fig. 2
Fig. 2. Molecular, pathological, and survival evolution during passaging.
A Evolution of tumor cells and the microenvironment during passaging. IHC Staining of spleen tissue by HES (10X), tumor cell markers: CD4 (10X) and PD1 (20X), and microenvironment markers CD8 (10X) and CD20 (10X). B Clonal evolution of PDX models. The presence of T-cell clone on spleen cells was characterized by beta chain gene rearrangement and the percentage of β chain TCR rearrangement in total chain rearrangement was presented for PDX12, PDX18, and PDX16. C Mutational landscape of TFHL-PDX. The figure shows the distribution and VAF(%) of mutations in TET2, DNMT3A, IDH2, RHOA, VAV1, CD28, and PLCG1. Samples represented in dark blue bore at least two TET2 mutations, whereas only one TET2 mutation was detected in samples represented in light blue. DNMT3A R882* variants are represented in dark green, whereas samples represented in light green harbored DNMT3A mutations altering other residues. The models were sequenced using different versions of the lymphoma panel: PDX1: V.1.3, PDX6: V.1.3, PDX6Bis: V.1.2, PDX11: V.1.3, PDX12:V.1.2, PDX13:V.1.1-2, PDX16: V.1.2, PDX18: V.1.3, PDX18BIS: V.1.3, and PDX24: V.1.3. N: not available White cells: WT sequence. Representative example of the time to generate the PDX model, demonstrating the time (day) between tumor engraftment until euthanasia of the mouse. P0 Patient, P1 Passage 1, P2 Passage 2, P3 Passage 3, P4 Passage 4.
Fig. 3
Fig. 3. Sensitivity to azacitidine for TFHL-PDX models and their source patients.
A chematic representation of azacitidine treatment. Tumor cells were implanted into NSG mice and circulating tumor cells were detected after 10 days. The treatment started upon detection of circulating tumor cells and the mice received intraperitoneal injections of 2.5 mg/kg azacitidine every other day for a total of five doses and the cycle was repeated every four weeks until the humane end point. B The efficacy of 5-azacitidine treatment in different PDX models. Three PDXs (PDX11, PDX12, and PDX18) developed from responsive models and two PDXs (PDX13 and PDX6bis) developed from refractory patients received azacitidine treatment. The weekly percentage of circulating tumor cells, followed during the treatment period, is shown on the first line of the figure. In the second line, the overall survival rate of azacitidine- and placebo-treated mice is shown. T-tests and Log-rank tests were used to determine significance changes in the percentage of circulating tumor cells and mouse survival curves, respectively. PDX12 n = 14, PDX18 n = 7, PDX11 n = 8, PDX6bis and PDX13 n = 6. C Schematic representation of the efficacy of azacitidine treatment in PDXs generated from the initial biopsy (PDX18 n = 7) or relapse biopsy (PDX18bis n = 8) of the same patient. Black dots represent placebo-treated mice and red dots azacitidine-treated mice.
Fig. 4
Fig. 4. Changes in DNA methylation induced by azacitidine treatment.
A Principal component analysis with the 10,000 most variable CpGs. Colors indicate the treatment status or primary tumor sample. Circles highlight the six different TFHL-PDX models. B Heatmap showing the beta values for the 10,000 most variable CpGs. Hierarchical clustering shows separation between the six different TFHL-PDX models. C Density plot showing mean DNA methylation for the sensitive (PDX11, PDX12, and PDX18) and the resistant (PDX6bis, PDX13 and PDX18bis) models. D Median global DNA methylation for the patient tissue group, as well as the placebo- and azacitidine-treated TFHL-PDX models. T test, ***p < 0.001, **** p < 0.0001. E Heatmap showing the beta values for differentially methylated CpGs of sensitive models. Treated vs Placebo (PDX11, 12, 18) FDR < 0.0000001 ΔBetamean = 0.2 n = 34,835 CpGs. F Enrichment analysis of genes associated with differentially methylated CpGs by Webgestalt: Reactome. G Enrichment analysis of genes associated with differentially methylated CpGs for transcription factors by EnrichR: TRRUST Transcription factors 2019.
Fig. 5
Fig. 5. Effect of azacitidine on HERV and gene expression profiles.
A Volcano plots of differentially expressed HERV genes in PDX11, PDX12, PDX18, and PDX6bis for treated versus placebo mice. B Selected antiviral response gene set enrichment of responsive models (*p-adj < 0.1, **p-adj < 0.05, ***p-adj < 0.01). NES: normalized enrichment score. C Profile of changes in expression of protein-coding genes after azacitidine treatment in sensitive models (PDX11, PDX12, and PDX18). D Hallmark gene set enrichment of DEGs (i.e. genes with |log2(foldchange)| > 1 and p-value < 0.05) in sensitive models (PDX11, PDX12, and PDX18). The X-axis shows normalized gene enrichment, and the Y-axis shows hallmarks. E Effect of azacitidine on the p53 pathway at the protein level by IHC. Positive cells were quantified using QuPath software and normalized to the CD4+ cell count and the placebo.

Similar articles

References

    1. Laurent C, Baron M, Amara N, Haioun C, Dandoit M, Maynadié M, et al. Impact of expert pathologic review of lymphoma diagnosis: study of patients from the French Lymphopath Network. Journal Clin Oncol. 2017;35:2008–17. - PubMed
    1. Alaggio R, Amador C, Anagnostopoulos I, Attygalle AD, Araujo IB de O, Berti E, et al. The 5th edition of the World Health Organization classification of haematolymphoid tumours: lymphoid neoplasms. Leukemia. 2022;36:1720–48. - PMC - PubMed
    1. Campo E, Jaffe ES, Cook JR, Quintanilla-Martinez L, Swerdlow SH, Anderson KC, et al. The international consensus classification of mature lymphoid neoplasms: a report from the clinical advisory committee. Blood, J Am Soc Hematol. 2022;140:1229–53. - PMC - PubMed
    1. de Leval, Rickman L, Thielen DS, Reynies C, de A, Huang YL, et al. The gene expression profile of nodal peripheral T-cell lymphoma demonstrates a molecular link between angioimmunoblastic T-cell lymphoma (AITL) and follicular helper T (TFH) cells. Blood, J Am Soc Hematol. 2007;109:4952–63. - PubMed
    1. Lemonnier F, Couronné L, Parrens M, Jaïs JP, Travert M, Lamant L, et al. Recurrent TET2 mutations in peripheral T-cell lymphomas correlate with TFH-like features and adverse clinical parameters. Blood, J Am Soc Hematol. 2012;120:1466–9. - PubMed

MeSH terms

LinkOut - more resources