. 2025 Jul;39(7):1607-1626.
doi: 10.1038/s41375-025-02626-2. Epub 2025 May 20.

Trajectories from single-cells to PAX5-driven leukemia reveal PAX5-MYC interplay in vivo

Affiliations

Trajectories from single-cells to PAX5-driven leukemia reveal PAX5-MYC interplay in vivo

Franziska Auer et al. Leukemia. 2025 Jul.

Abstract

PAX5 acts as a master regulator of B-cell proliferation and differentiation. Its germline and somatic deregulation have both been implicated in the development of B-cell precursor acute lymphoblastic leukemia (BCP-ALL). However, the process how reduced PAX5 transcriptional activity mediates progression to BCP-ALL, is still poorly understood. Here, we characterized the longitudinal effects of PAX5 reduction on healthy, pre-leukemic and BCP-ALL cells at the single-cell level. Cell-surface marker analysis revealed a genotype-driven enrichment of the pre-BII population in healthy Pax5± mice. This population showed downregulated B-cell receptor signaling, while DNA replication/repair and cell-cycle signaling pathways were upregulated. Moreover, we observed a shift in the kappa/lambda light chain ratio toward lambda rearranged B-cells. Transplantation experiments further validated a delay of Pax5± pre-BII cells in maturation and transition to IgM-positivity. Additionally, single-cell RNA-Sequencing and bulk ATAC-Sequencing of different stages of BCP-ALL evolution showed that Pax5± pre-leukemic cells lose their B-cell identity and display Myc activation. Subsequently, BCP-ALLs acquired additional RAG-mediated aberrations and driver mutations in JAK-STAT and RAS-signaling pathways. Together, this study elucidates molecular and functional checkpoints in PAX5-mediated pre-leukemic cell progression exploitable for therapeutic intervention and demonstrates that PAX5 reduction is sufficient to initiate clonal evolution to BCP-ALL through activation of MYC.


Conflict of interest statement

Competing interests: The authors declare no potential conflicts of interest.

Figures
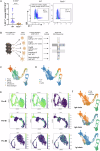
Fig. 1
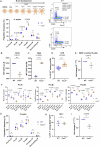
Fig. 1. The Basel classification accurately resolves transcriptionally distinct B-cell precursor subsets in the murine bone marrow.
A Percentage of BP-1+ bone marrow B-cells (B220+ CD19+) from Pax5± vs. wild-type (WT) mice. (Left) Displayed are individual values (with mean and SD) of 14 Pax5± vs. 14 WT mice ages 11-38 weeks. (Right) Representative flow cytometry plots. An unpaired two-tailed Student’s t-test was used to calculate significance and the respective p-value is indicated. *** p ≤ 0.001. B Schematic of the employed sorting and single-cell RNA-Sequencing strategy. C Single-cell clusters of different WT precursor B-cell subsets analyzed with the workflow depicted in B). The transcriptome similarity is visualized based on UMAP. Pool of n = 3 WT mice, 17 weeks of age. D Predicted cell-cycle state in clusters from C). E Precursor B-cells of WT mice display specific gene expression patterns depending on their differentiation state. The scaled gene expression level for classical marker genes (Igll1, Vpreb1 and Il2ra) is shown in color on the UMAP. F Expressed immunoglobulin chain status of WT precursor B-cell clusters displayed as in C). Igh immunoglobulin heavy chain, Igk immunoglobulin kappa light chain, Igl immunoglobulin lambda light chain. True chain expression, False no chain expression, No data no chain detected.
Fig. 2
Fig. 2. Aberrant precursor B-cell development in Pax5+/− mice emerges postnatally and persists with age.
A Upper: Schematic of B-cell differentiation in the bone marrow. SL surrogate light chain, µH heavy chain. Lower: Population frequencies among the different differentiation stages (individual values with mean and SD). Compared are wild-type (WT) mice (n = 3, 11 weeks) and Pax5± littermates (n = 3, 11 weeks). Representative flow cytometry plots displaying the pre-BII population (B220+ CD19+ IgM IgD c-KIT CD25+) for WT and Pax5± mice are displayed on the right. B Mean fluorescence intensity (MFI) of CD19 in pro-B cells of Pax5± mice compared to WT littermates. C Analogous to B) for CD25 MFI in pre-BII cells. D Percentage of IL7-Receptor (IL7-R, CD127) positive cells among pre-BII cells of Pax5± mice compared to their WT littermates. E qRT-PCR analysis showing Pax5 gene expression in B220-enriched bone marrow cells of 14 weeks old Pax5± mice compared to WT animals (n = 3). F Frequencies of pro-B, pre-BI and pre-BII cells within the (B220+ CD19+ IgM IgD) parental population in WT vs. Pax5± mice across different age cohorts (6 weeks, WT n = 4, Pax5± n = 5; 11 weeks, WT n = 3, Pax5± n = 3; 25–26 weeks, WT n = 4, Pax5± n = 3; 38 weeks, WT n = 4, Pax5± n = 5; 65–72 weeks, WT n = 3, Pax5± n = 3). w weeks. G Population frequencies among the different differentiation stages. Compared are WT mice (n = 3, 2 weeks) and Pax5± littermates (n = 3, 2 weeks). H Percentage of BP-1+ bone marrow B-cells (B220+ CD19+) from 2 weeks old Pax5± vs. WT mice (n = 3 per group). I qRT-PCR analysis showing Pax5 gene expression in B220-enriched bone marrow cells of 2 weeks old Pax5± compared to WT animals (n = 3 per group). Displayed are individual values with mean and SD. An unpaired two-tailed Student’s t-test was performed for the statistical analysis. Respective p-values are indicated. ns not significant, *p ≤ 0.05, **p ≤ 0.01, ***p ≤ 0.001, ****p ≤ 0.0001.
Fig. 3
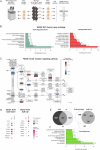
Fig. 3. Integrated bulk and single-cell RNA-Seq reveal transcriptional dysregulation in Pax5+/− pre-BII cells.
A Analysis strategy for bulk and single-cell (sc) RNA-Sequencing of the pre-BII population. Bulk RNA-Sequencing: n = 3 wild-type (WT) and n = 3 Pax5± littermates all aged 10 weeks. The same mice were used for scRNA-Sequencing together with one additional WT and Pax5± mouse each, both aged 10 weeks. All 8 mice for scRNA-Sequencing were individually hash-tagged for scRNA-Seq. BM bone marrow. B GO-term analysis of significantly up- and downregulated genes in Pax5± vs. WT mice identified by bulk RNA-sequencing (FDR = 2%) performed with the online tool Enrichr. The bar lengths represent the adjusted p-value [-log10]. C Regulation of gene expression of the B-cell receptor signaling pathway genes (KEGG database) in Pax5± compared to WT pre-BII cells as identified in B). Graphical representation was taken from the KEGG database and manually adjusted to include respective mouse genes. D Visualization of scRNA-Seq data using the top 9 down- and the top 8 upregulated genes from bulk RNA-Seq analysis of Pax5± and WT pre-BII cells as dot plots. Color tones correspond to average expression level and dot size represents percentage of cells expressing each gene. E (Left) Venn diagram showing the overlap of significantly deregulated genes in pre-BII cells from Pax5± mice compared to WT controls between bulk (FDR = 10%) and scRNA-Seq data (n = 927). (Right) Venn diagram displaying the intersection between overlapping deregulated genes between bulk and scRNA-Seq to PAX5 targets in small pre-B cells (as identified by Fedl et al. [4]). F GO-term analysis of the overlapping genes (n = 927) from E) left Venn diagram.
Fig. 4
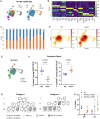
Fig. 4. Pax5 haploinsufficiency drives aberrant kappa/lambda light chain rearrangement in pre-BII cells.
A Single-cell (sc) RNA-Sequencing clusters of sorted pre-BII cells from n = 4 wild-type (WT) and n = 4 Pax5± mice ages 10-11 weeks (left) with annotated cell-cycle states (right). B: Top gene expression is shown for each cluster as a heatmap. C Cluster specific proportion of pre-BII cells from WT vs. Pax5± mice. D Proportion heatmaps showing the cell distribution of pre-BII cells among the different clusters from Pax5± and WT mice. The lower left clusters 4 and 6 (see Fig. 4A) correspond to lambda light chain recombination status in the V(D)J data (refer to Supplementary Fig. 4A). E V(D)J-recombination analysis showing annotation of immunoglobulin lambda light chain (Igl) expression. True chain expression, False no chain expression, No data no chain detected. F Flow cytometry analysis showing the percentage of kappa and lambda light chain rearranged B-cells among B220+ CD19+ cells in the peripheral blood of Pax5± (n = 7) vs. WT (n = 7) mice ages 11–16 weeks (individual values with mean and SD). Significances (indicated) were calculated using an unpaired two-tailed Student’s t-test. ***p ≤ 0.001, ****p ≤ 0.0001. G Pedigrees of two families harboring PAX5 germline variants (p.G183S and p.G183R, respectively). Epstein Bar Virus (EBV) transformed lymphoblastoid cell lines (LCL) were available from all individuals shaded in grey. BCP-ALL B-cell precursor acute lymphoblastic leukemia. H Flow cytometry analysis of IGK (immunoglobulin kappa light chain) vs. IGL surface expression levels on EBV LCLs depicted in G). PAX5 p.G183S n = 3, PAX5 p.G183R n = 4, PAX5 WT n = 2.
Fig. 5
Fig. 5. Pax5 haploinsufficiency delays B-cell maturation and alters pre-BII cell homing in a transplantation model.
A Schematic of transplantation strategy. B Flow cytometry analysis showing the percentage of engrafted donor CD45.2+ pre-BII cells in lethally irradiated recipients 72 h after transplantation in the bone marrow (upper) and the spleen (lower). Donor cells were a pool of n = 4, 11 weeks old either Pax5± or wild-type (WT) mice, each transplanted into n = 5 CD45.1+ lethally irradiated recipients. No support whole bone marrow cells (WBMCs) was used for this experimental setup. “Among B-cell lineage” refers to gating on scatter, singlets, viable, lineage and B220+ CD19+. C Population frequencies of precursor B-cell subsets 72 h after in vitro cultivation of B220+ sorted cells from WBMCs of WT (n = 4) vs. Pax5± (n = 4) mice, ages 9-10 weeks. Displayed are individual values with mean and SD. An unpaired two-tailed Student’s t-test was performed for the statistical analysis. Respective p-values are indicated. ns not significant, *p ≤ 0.05, **p ≤ 0.01, ***p ≤ 0.001, ****p ≤ 0.0001.
Fig. 6
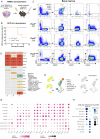
Fig. 6. Pre-leukemic c-KIT+ CD25+ cells in Pax5+/− mice exhibit Myc activation and multi-lineage transcription factor rewiring.
A Representative flow cytometry plots showing a low percentage of a deregulated population (c-KIT+ CD25+) in the bone marrow of a 38 weeks old Pax5± mouse (highlighted with arrow; termed pre-leukemia). This was accompanied with an enrichment of pre-pro B cells (B220+ CD19). WT wild-type. B Single-cell RNA-Sequencing (scRNA-Seq) analysis including WT precursor B-cell subsets from Fig. 1C and the pre-leukemic population identified in A). Pre-leukemic cells cluster closest to WT pro-B cells. C Gene expression profile of selected genes in pre-leukemic cells (pre-leuk) compared to WT B-cell differentiation stages extracted from the scRNA-Seq analysis as a dot plot heatmap. Cluster labels are displayed in B). D Transcription factor (TF) activities in pre-leukemic cells compared to WT B-cell subsets based on the SCENIC analysis. Important TF regulons that are involved in hematopoietic cell differentiation identity are highlighted. See also Supplementary Fig. 6 showing the predicted activity of PAX5 and EBF1 regulons within our recorded scRNA-Seq data of different WT B-cell subsets on the UMAP. Imm-B Immature B-cells, Recirc-B Recirculating B-cells, c cycling. E Three most significantly enriched motif classes are shown from differentially accessible peaks comparing Pax5± pre-leukemic (pre-leukemia 5 and 7) and WT pre-BII cells (up/down: higher/lower accessibility in pre-leukemia, respectively, refer to Supplementary Table S4). The dot size corresponds to the fraction of peaks carrying the motif. Color denotes -10log(p-value). F Histogram of ATAC-seq signal level at PAX5 binding sites comparing Pax5± pre-leukemic (n = 2, pre-leukemia 5 and 7) and WT pre-BII (n = 2) chromatin access. Peaks centered with PAX5 motif are shown (n = 963 peaks, ± 1 kb from center, re-analysis of CUT & RUN data from pro-B and pre-B cells [4]).
Fig. 7
Fig. 7. BCP-ALLs derived from Pax5+/− mice display JAK/STAT mutations, Pax5 loss, and chromatin remodeling linked to Myc activation.
A Schematic of transplantation strategy. WBMCs whole bone marrow cells, WT wild-type. B B-cell precursor acute lymphoblastic leukemia (BCP-ALL) dependent survival curve of n = 5 CD45.1/.2 lethally irradiated recipients per genotype, transplanted each with 4 × 10⁶ WBMCs from either WT or Pax5± mice (pool of 4 donor mice/donor genotype, 11 weeks of age). tx = transplantation. C Flow cytometry bone marrow characterization of the leukemias developed in B). D Selected somatic mutations and structural variants identified in the Pax5± BCP-ALLs through whole genome sequencing (WGS) shown as an oncoprint heatmap with variant types annotated by color and shape. E Single-cell (sc) RNA-Sequencing of Pax5± leukemias (237, 239 and 241) displayed together with sc expression profiles from WT B-cell subsets and pre-leukemic cells (Fig. 6B) on the UMAP. F Pre-leukemic cells cluster closest to leukemia 241. G Dot plot heatmap showing gene expression for selected genes across all analyzed B-cell subsets during BCP-ALL evolution. Imm-B Immature B-cells, recirc-B Recirculating B-cells, pre-leuk pre-leukemic. H Five most significantly enriched motif classes are shown (as in Fig. 6E) from differentially accessible peaks comparing Pax5± leukemic (BCP-ALL 241) and WT pre-BII cells.

Similar articles

References

    1. Cobaleda C, Schebesta A, Delogu A, Busslinger M. Pax5: the guardian of B cell identity and function. Nat Immunol. 2007;8:463–70. - PubMed
    1. Nutt SL, Heavey B, Rolink AG, Busslinger M. Commitment to the B-lymphoid lineage depends on the transcription factor Pax5. Nature. 1999;401:556–62. - PubMed
    1. McManus S, Ebert A, Salvagiotto G, Medvedovic J, Sun Q, Tamir I, et al. The transcription factor Pax5 regulates its target genes by recruiting chromatin-modifying proteins in committed B cells. EMBO J. 2011;30:2388–404. - PMC - PubMed
    1. Fedl AS, Tagoh H, Gruenbacher S, Sun Q, Schenk RL, Froussios K, et al. Transcriptional function of E2A, Ebf1, Pax5, Ikaros and Aiolos analyzed by in vivo acute protein degradation in early B cell development. Nat Immunol. 2024;25:1663–77. - PubMed
    1. Revilla IDR, Bilic I, Vilagos B, Tagoh H, Ebert A, Tamir IM, et al. The B-cell identity factor Pax5 regulates distinct transcriptional programmes in early and late B lymphopoiesis. EMBO J. 2012;31:3130–46. - PMC - PubMed

MeSH terms

LinkOut - more resources