. 2025 May;5(5):816-830.
doi: 10.1038/s43587-025-00859-5. Epub 2025 May 20.

Endometrial aging is accompanied by H3K27ac and PGR loss

Affiliations

Endometrial aging is accompanied by H3K27ac and PGR loss

Yue Wang et al. Nat Aging. 2025 May.

Abstract

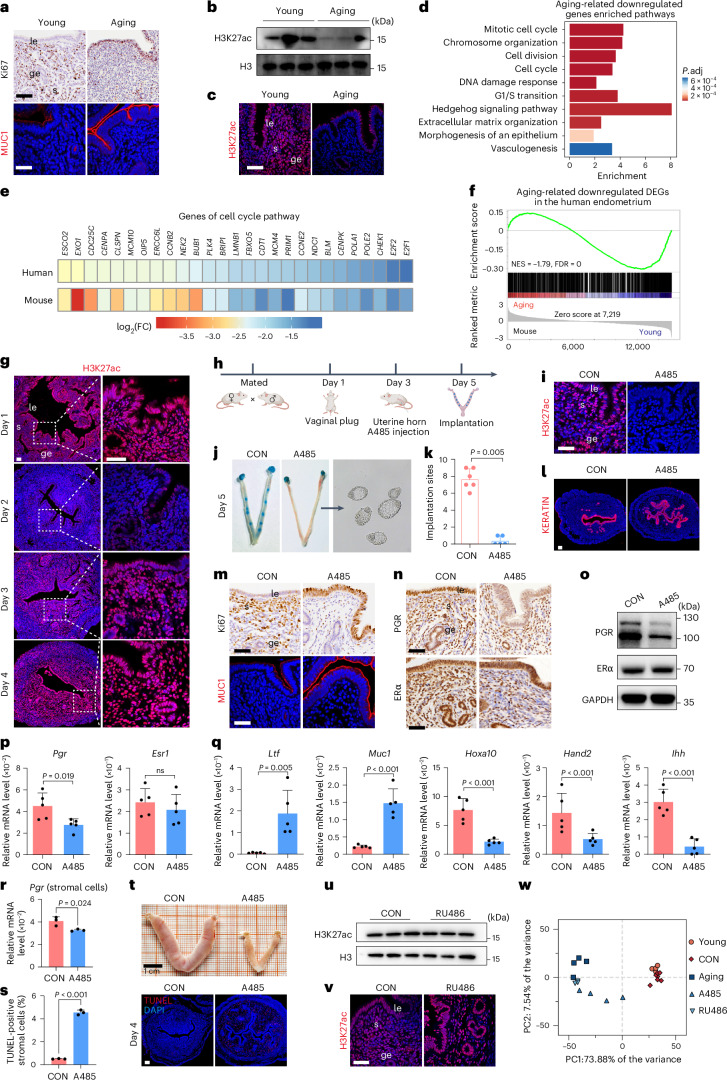
Whether and how endometrial aging affects fertility remains unclear. In our in-house clinical cohort at the Center for Reproductive Medicine of Peking University Third Hospital (n = 1,149), we observed adverse pregnancy outcomes in the middle-aged group after excluding aneuploid embryos, implying the negative impact of endometrial aging on fertility. To understand endometrial aging, we performed comprehensive transcriptomic profiling of the mid-secretory endometrium of young (<35 years) and middle-aged (≥35 years) patients. This analysis revealed that H3K27ac loss is linked to impaired endometrial receptivity in the middle-aged group. We eliminated H3K27ac in young human endometrial stromal cells and observed reduced progesterone receptor (PGR), a critical regulator of endometrial receptivity. Lastly, we validated the association between H3K27ac/PGR loss and uterine aging in a mouse model. Our findings establish H3K27ac as a critical regulator of PGR and demonstrate that endometrial H3K27ac loss is associated with aging-related fertility decline. This work provides valuable insights into enhancing the safety and efficacy of assisted reproductive technologies in future clinical practices.


Conflict of interest statement

Competing interests: The authors declare no competing interests.

Figures

Fig. 1
Fig. 1. Aging endometrium exhibits impaired endometrial receptivity.
a, Schematic design to assess pregnancy outcomes of young and middle-aged patients undergoing PGT-A. b, The impact of age on pregnancy outcomes in patients undergoing PGT-A. c, Representative images showing Ki67 immunohistochemistry (IHC) staining in the human mid-secretory endometrium (n = 3). d, Immunofluorescence (IF) staining of cell morphologies in human endometrial stromal cells during induced decidualization. Decidualization was induced by the treatment of 0.5 μM cAMP and 1 μM MPA. The F-actin cytoskeleton was visualized by rhodamine phalloidin staining. e, Relative mRNA levels of IGFBP1 and PRL in human endometrial stromal cells during induced decidualization (n = 3). f, Representative images illustrating protein levels of IGFBP1 in human endometrial stromal cells during induced decidualization (n = 3). g, Representative images showing PGR IHC staining in the human mid-secretory endometrium (n = 3). h, Representative images showing ERα IHC staining in the human mid-secretory endometrium (n = 3). i, Protein levels of PGR and ERα in the human mid-secretory endometrium (n = 5). j, Relative mRNA levels of PGR and ESR1 in the human mid-secretory endometrium (n = 5). k, FPKM of PGR and ESR1 in the human mid-secretory endometrium (n = 10 and n = 8 for the young and middle-aged groups, respectively). The adjusted P value was determined by DESeq2 (ref. ). The median, upper and lower quartiles are shown. Whiskers represent upper quartile + 1.5 interquartile range (IQR) and lower quartile − 1.5 IQR. l, Pathway enrichment analysis of downregulated DEGs in the aging mid-secretory endometrium. The adjusted P value was determined by Metascape. In c, d, g and h, scale bar, 50 μm. The nuclei were stained with hematoxylin in the IHC staining and with DAPI in the IF staining. In e and j, statistical analysis was performed by two-sided unpaired Student’s t-test. Data are presented as mean ± s.d. All replicates were biological replicates. D, day; FPKM, fragments per kilobase of transcript per million mapped reads; ge, glandular epithelium; le, luminal epithelium; M or mid-aged, middle-aged; na, not applicable; ns, not significant; P.adj, adjusted P value; s, stroma; Y, young. Source data
Fig. 2
Fig. 2. Aging-related H3K27ac loss is associated with PGR reduction.
a, Enrichment of aging-related endometrial DEGs in genes marked by different histone modifications. b, Heatmaps showing endometrial gene expression of H3K27ac writers, erasers and readers. Red and blue gene symbols represent aging-related upregulated and downregulated DEGs separately. c, H3K27ac immunofluorescence (IF) staining in the human mid-secretory endometrium. Scale bar, 50 μm. The nuclei were stained with DAPI. d, The H3K27ac level in human mid-secretory endometrial stromal and epithelial cells (n = 4). e, The relative H3K27ac level in human mid-secretory endometrial stromal and epithelial cells (n = 4). f, Heatmaps of the H3K27ac signal in human mid-secretory endometrial stromal cells at H3K27ac peaks in the young group. g, Volcano plot illustrating H3K27ac differences between young and aging mid-secretory endometrial stromal cells. Red and blue points represent peaks that gain and lose H3K27ac in aging stromal cells. h, The genomic distribution of H3K27ac peaks in human mid-secretory endometrial stromal cells. i, GO enrichment analysis of genes with H3K27ac loss in aging mid-secretory endometrial stromal cells. j, KEGG enrichment analysis of genes with H3K27ac loss in aging mid-secretory endometrial stromal cells. k, The H3K27ac signal in mid-secretory endometrial stromal cells at selected genes. hg38 coordinates are shown. The blue shading indicates the specific region with H3K27ac loss in the middle-aged group. l, H3K27ac and PGR levels in mid-secretory endometrial stromal cells after treatment with A485 (n = 3). m, Relative H3K27ac and PGR levels in mid-secretory endometrial stromal cells after treatment with A485 (n = 3). In e and m, statistical analysis was performed by two-sided unpaired Student’s t-test or Mann–Whitney U rank-sum test (when data did not follow a normal distribution). Data are presented as mean ± s.d. All replicates were biological replicates. FC, fold change; GO, Gene Ontology; KEGG, Kyoto Encyclopedia of Genes and Genomes; mid-aged, middle-aged; ns, not significant; P.adj, adjusted P value; UTR, untranslated region. Source data
Fig. 3
Fig. 3. Aging endometrium shows genome-wide PGR depletion.
a, Heatmaps of the PGR signal in human mid-secretory endometrial stromal cells at PGR peaks in the young group. b, Volcano plot illustrating PGR differences between young and aging mid-secretory endometrial stromal cells. Red and blue points represent peaks that gain and lose the PGR signal in aging stromal cells. c, The genomic distribution of PGR peaks in human mid-secretory endometrial stromal cells. d, GO enrichment analysis of genes with PGR depletion in aging mid-secretory endometrial stromal cells. e, KEGG enrichment analysis of genes with PGR depletion in aging mid-secretory endometrial stromal cells. f, Venn diagram illustrating the overlap between downregulated DEGs and genes with PGR depletion in aging mid-secretory endometrial stromal cells. g, Pathway enrichment analysis of 708 common genes indicated in f. h, The PGR signal in mid-secretory endometrial stromal cells at selected genes. hg38 coordinates are shown. The blue shading indicates the specific region with PGR depletion in the middle-aged group. i, FPKM of selected genes in human mid-secretory endometrial stromal cells (n = 4). The adjusted P value was determined by DESeq2 (ref. ). Data are presented as mean ± s.d. All replicates were biological replicates. FC, fold change; FPKM, fragments per kilobase of transcript per million mapped reads; GO, Gene Ontology; KEGG, Kyoto Encyclopedia of Genes and Genomes; mid-aged, middle-aged; P.adj, adjusted P value; UTR, untranslated region. Source data
Fig. 4
Fig. 4. H3K27ac and PGR exhibit correlated genomic occupancies and coordinated aging-related depletion.
a, Heatmaps of H3K27ac and PGR signals in young mid-secretory endometrial stromal cells at H3K27ac and PGR peaks in the young group. b, Venn diagram illustrating the overlap between genes marked by H3K37ac and PGR. c, The H3K27ac and PGR signals in young mid-secretory endometrial stromal cells at the euchromosome and X chromosome. d, One-kilobase plots showing the correlation between H3K27ac and PGR signals in human mid-secretory endometrial stromal cells. e, Motif analysis of H3K27ac peaks in young mid-secretory endometrial stromal cells. f, Co-IP assays showing the interaction between p300 and PGR in the human endometrium. g, Heatmaps of H3K27ac and PGR signals in human mid-secretory endometrial stromal cells at differentially binding peaks of H3K27ac and PGR between the two groups. h, Venn diagram illustrating the overlap between genes with H3K27ac and PGR loss. i, H3K27ac and PGR signals in mid-secretory endometrial stromal cells at selected genes. hg38 coordinates are shown. j, Protein levels of FoxO1, HOXA10 and HAND2 in mid-secretory endometrial stromal cells (n = 4). k, Relative protein levels of FoxO1, HOXA10 and HAND2 in mid-secretory endometrial stromal cells (n = 4). Statistical analysis was performed by two-sided unpaired Student’s t-test. Data are presented as mean ± s.d. l, GO enrichment analysis of genes with H3K27ac and PGR loss. m, KEGG enrichment analysis of genes with H3K27ac and PGR loss. All replicates were biological replicates. GO, Gene Ontology; KEGG, Kyoto Encyclopedia of Genes and Genomes; mid-aged, middle-aged; P.adj, adjusted P value; Pro, proliferative phase; Sec, secretory phase; TES, transcription end site; WB, western blot. Source data
Fig. 5
Fig. 5. Eliminating H3K27ac impairs murine uterine receptivity.
a, Ki67 immunohistochemistry (IHC) and MUC1 immunofluorescence (IF) staining in the murine uterus on day 4. b, H3K27ac in the murine uterus on day 4 (n = 5). c, H3K27ac IF staining in the murine uterus on day 4. d, Pathway enrichment analysis of downregulated DEGs in the aging murine uterus. e, Heatmaps showing expression changes of selected genes in the human endometrium and murine uterus (aging versus young). f, GSEA of gene expression changes in the murine uterus (aging versus young) against aging-related downregulated DEGs in the human endometrium. g, H3K27ac IF staining in the murine uterus. h, Schematic diagram of the A485 injection. i, H3K27ac IF staining in the uterus on day 4. j, Implantation sites visualized by the blue dye and unimplanted embryos obtained in A485. k, The number of implantation sites on day 5. l, Cytokeratin IF staining in the uterus on day 4. m, Ki67 IHC and MUC1 IF staining in the uterus on day 4. n, PGR/ERα IHC staining in the uterus on day 4 (n = 3). o, PGR/ERα protein levels in the uterus on day 4. p,q, Relative mRNA levels of Pgr and Esr1 (p) and Ltf, Muc1, Hoxa10, Hand2 and Ihh (q) in the uterus on day 4 (n = 5). r, The relative mRNA level of Pgr in uterine stromal cells on day 4 (n = 3). s, The apoptosis rate of uterine stromal cells (n = 3). t, Images of the uterus on the fifth day after deciduogenic stimulus. u, The H3K27ac level in the uterus on day 4 (n = 3). v, H3K27ac IF staining in the uterus on day 4. w, PCA plot of uterine RNA-seq data from all groups of mice. Scale bar, 50 μm (except t). Nuclei were stained with hematoxylin in IHC staining and with DAPI in IF staining. Statistical analysis was performed by two-sided unpaired Student’s t-test or Mann–Whitney U rank-sum test. Data are presented as mean ± s.d. All replicates were biological replicates. CON, control; FC, fold change; FDR, false discovery rate; ge, glandular epithelium; GSEA, gene set enrichment analysis; le, luminal epithelium; NES, normalized enrichment score; ns, not significant; P.adj, adjusted P value; PC, principal component; PCA, principal component analysis; s, stroma. Source data
Extended Data Fig. 1
Extended Data Fig. 1. The mid-secretory endometrium exhibits different phenotypes and gene expression between young and middle-aged patients.
a, The percentage of Ki67-positive cells in endometrial luminal epithelial and stromal cells in the mid-secretory phase (n = 3). b, Relative protein levels of IGFBP1 in human endometrial stromal cells during induced decidualization (n = 3). c,d, Histochemical scoring assessment (H-score) of PGR and ERα in the mid-secretory endometrium (n = 3). e, Relative protein levels of PGR and ERα in the mid-secretory endometrium (n = 5). f,g, Protein levels of PGR and ERα in human mid-secretory endometrial stromal cells (n = 4). h, Relative mRNA levels of PGR and ESR1 in human mid-secretory endometrial stromal cells (n = 4). i,j, Protein levels of PGR and ERα in human mid-secretory endometrial epithelial cells (n = 4). k, Relative mRNA levels of PGR and ESR1 in human mid-secretory endometrial epithelial cells (n = 4). l, PCA plot of human mid-secretory endometrial RNA-seq data. m, Volcano plot illustrating gene expression changes between the young and aging mid-secretory endometrium (|log2FC| > 1, P.adj < 0.05). n, Heatmap showing gene expression of differentially expressed genes (DEGs) between the young and aging mid-secretory endometrium. o, FPKM of LIF, SOX4, FGF1, WNT2, IL7, IHH in the human mid-secretory endometrium (n = 10 and n = 8 for the young and middle-aged groups, respectively). The adjusted P value was determined by DESeq2. Whiskers represent upper quartile + 1.5 interquartile range (IQR) and lower quartile − 1.5 IQR. p, Pathway enrichment analysis of upregulated DEGs in the aging mid-secretory endometrium. Statistical analysis was performed by two-sided unpaired Student’s t-test or Mann–Whitney U rank-sum test. Data are presented as mean ± s.d. All replicates were biological replicates. FC, fold change; mid-aged, middle-aged; ns, not significant; P.adj, adjusted P value; PC, principal component; PCA, principal component analysis. Source data
Extended Data Fig. 2
Extended Data Fig. 2. Mid-secretory endometrial stromal and epithelial cells show different gene expression between young and middle-aged patients.
a, PCA plot of RNA-seq data of mid-secretory endometrial stromal cells (n = 4). b, Volcano plot illustrating gene expression changes between young and aging mid-secretory endometrial stromal cells (|log2FC| > 1, P.adj < 0.05). c, Heatmap showing gene expression of DEGs between young and aging mid-secretory endometrial stromal cells. d, Pathway enrichment analysis of downregulated DEGs in aging mid-secretory endometrial stromal cells. e, Pathway enrichment analysis of upregulated DEGs in aging mid-secretory endometrial stromal cells. f, PCA plot of RNA-seq data of mid-secretory endometrial epithelial cells (n = 4). g, Volcano plot illustrating gene expression changes between young and aging mid-secretory endometrial epithelial cells (|log2FC| > 1, P.adj < 0.05). h, Heatmap showing gene expression of DEGs between young and aging mid-secretory endometrial epithelial cells. i, Pathway enrichment analysis of downregulated DEGs in aging mid-secretory endometrial epithelial cells. j, Pathway enrichment analysis of upregulated DEGs in aging mid-secretory endometrial epithelial cells. All replicates were biological replicates. FC, fold change; mid-aged, middle-aged; P.adj, adjusted P value; PC, principal component; PCA, principal component analysis.
Extended Data Fig. 3
Extended Data Fig. 3. Genome-wide H3K27ac signals in mid-secretory endometrial stromal and epithelial cells of young and middle-aged patients.
a, H3K27ac immunofluorescence (IF) staining in the endometrium of different hormonal stages. Scale bar: 50 μm. b,c, H3K27ac in the human proliferative and mid-secretory endometrium (n = 5). Statistical analysis was performed by two-sided unpaired Student’s t-test. Data are presented as mean ± s.d. d, Schematic design of H3K27ac CUT&Tag in mid-secretory endometrial stromal and epithelial cells. e,f, Consistent H3K27ac signals between biological replicates (n = 3). g, Heatmaps of the H3K27ac signal in human mid-secretory endometrial stromal cells around gene bodies. h, Heatmaps of the H3K27ac signal in human mid-secretory endometrial epithelial cells at H3K27ac peaks in the young group. i, Volcano plot illustrating H3K27ac differences between young and aging mid-secretory endometrial epithelial cells. Red and blue points represent peaks that gain and lose H3K27ac in aging epithelial cells. j, The genomic distribution of H3K27ac peaks in human mid-secretory endometrial epithelial cells. k, Pathway enrichment analysis of genes marked by H3K27ac in young mid-secretory endometrial stromal cells. All replicates were biological replicates. FC, fold change; mid-aged, middle-aged; P.adj, adjusted P value; PC, principal component; PCA, principal component analysis; Pro, proliferative phase; Sec, secretory phase; TES, transcription end site; UTR, untranslated region. Source data
Extended Data Fig. 4
Extended Data Fig. 4. Genome-wide PGR signals in mid-secretory endometrial stromal cells of young and middle-aged patients.
a, Consistent PGR signals between biological replicates (n = 3). b, Heatmaps of the PGR signal in human mid-secretory stromal cells around gene bodies. c, Pathway enrichment analysis of genes with PGR gain in aging mid-secretory endometrial stromal cells. d, Pathway enrichment analysis of genes with PGR loss in aging mid-secretory endometrial stromal cells. e, Relative mRNA levels of FOXO1, HOXA10 and HAND2 in human mid-secretory endometrial stromal cells (n = 4). Statistical analysis was performed by two-sided unpaired Student’s t-test. Data are presented as mean ± s.d. f, H3K27ac and PGR signals in mid-secretory endometrial stromal cells at the selected region. hg38 coordinates are shown. All replicates were biological replicates. P.adj, adjusted P value; mid-aged, middle-aged; TES, transcription end site. Source data
Extended Data Fig. 5
Extended Data Fig. 5. The uterus exhibits different gene expression between young and aging mice.
a, H3K27ac in the murine uterus (n = 5). b, The percentage of Ki67-positive cells in uterine epithelial and stromal cells (n = 3). c, PCA Plot of murine uterine RNA-seq data (n = 4). d, Volcano plot illustrating gene expression changes between young and aging mice (|log2FC| > 1, P.adj < 0.05). e, Heatmap showing gene expression of DEGs between the young and aging murine uterus. f, Pathway enrichment analysis of upregulated DEGs in the aging murine uterus. In a and b, statistical analysis was performed by two-sided Student’s t-test or Mann–Whitney U rank-sum test. Data are presented as mean ± s.d. All replicates were biological replicates. FC, fold change; P.adj, adjusted P value; PC, principal component; PCA, principal component analysis. Source data
Extended Data Fig. 6
Extended Data Fig. 6. Eliminating H3K27ac impairs murine uterine receptivity.
a, Blastocysts retrieved from the CON and A485 groups. b, NANOG (inner cell mass marker) and CDX2 (trophectoderm marker) IF staining in blastocysts. c, The number of cells per blastocyst and the percentage of inner cell mass cells. d, Blastocysts were transplanted into sham pregnant mice and the number of implantation sites were measured on day 5. e, The percentage of Ki67-positive cells in uterine epithelial and stromal cells (n = 3). f, The H-score of PGR and ERα in the uterus on day 4 (n = 3). g, Relative protein levels of PGR and ERα in the uterus on day 4 (n = 3). h, PCA plot of murine uterine RNA-seq data (n = 4). i, Volcano plot illustrating gene expression changes between the CON and A485 murine uterus (|log2FC| > 1, P.adj < 0.05). j, Heatmap showing gene expression of DEGs between the CON and A485 murine uterus. k, Pathway enrichment analysis of downregulated DEGs in the A485 murine uterus. l, Pathway enrichment analysis of upregulated DEGs in the A485 murine uterus. Statistical analysis was performed by two-sided unpaired Student’s t-test or Mann–Whitney U rank-sum test. Data are presented as mean ± s.d. All replicates were biological replicates. CON, control; FC, fold change; ns, not significant; P.adj, adjusted P value; PC, principal component; PCA, principal component analysis. Source data
Extended Data Fig. 7
Extended Data Fig. 7. Inhibiting PGR induces murine uterine transcriptional changes without affecting H3K27ac.
a, Relative mRNA levels of Ihh, Hand2 and Hoxa10 in the uterus on day 4 (n = 3 and n = 5 for the CON and RU486 groups, respectively). b, PCA plot of murine uterine RNA-seq data (n = 3). c, Volcano plot illustrating gene expression changes between the CON and RU486 murine uterus (|log2FC| > 1, P.adj < 0.05). d, Heatmap showing gene expression of DEGs between the CON and RU486 murine uterus. e, Pathway enrichment analysis of downregulated DEGs in the RU486 murine uterus. f, Pathway enrichment analysis of upregulated DEGs in the RU486 murine uterus. g, H3K27ac in the murine uterus (n = 3). h, Heatmaps showing gene expression of H3K27ac writers, erasers and readers in the murine uterus. In a and g, statistical analysis was performed by two-sided unpaired Student’s t-test. Data are presented as mean ± s.d. All replicates were biological replicates. CON, control; FC, fold change; ns, not significant; P.adj, adjusted P value; PC, principal component; PCA, principal component analysis. Source data
Extended Data Fig. 8
Extended Data Fig. 8. Inhibiting H3K27ac or PGR resembles aging-related transcriptomic changes in the murine uterus.
a, Consistent gene expression changes between A485/CON and Aging/Young. b, Consistent gene expression changes between RU486/CON and Aging/Young. c, Heatmap showing gene expression of DEGs between the young and aging murine uterus. d, Heatmap showing gene expression of DEGs between the CON and A485 murine uterus. e, Heatmap showing gene expression of DEGs between the CON and RU486 murine uterus. f, Venn diagram illustrating the overlap among different groups of DEGs. g, KEGG enrichment analysis of different groups of DEGs. h, GSEA of gene expression changes in the murine uterus (A485 or RU486 versus CON) against the cell cycle and vasculogenesis gene sets. CON, control; FC, fold change; P.adj, adjusted P value.

References

    1. Heffner, L. J. Advanced maternal age—how old is too old? N. Engl. J. Med.351, 1927–1929 (2004). - PubMed
    1. Sauer, M. V. Reproduction at an advanced maternal age and maternal health. Fertil. Steril.103, 1136–1143 (2015). - PubMed
    1. Frick, A. P. Advanced maternal age and adverse pregnancy outcomes. Best Pract. Res. Clin. Obstet. Gynaecol.70, 92–100 (2021). - PubMed
    1. Beaujouan, É. & Toulemon, L. European countries with delayed childbearing are not those with lower fertility. Genus77, 2 (2021).
    1. Magnus, M. C., Wilcox, A. J., Morken, N.-H., Weinberg, C. R. & Håberg, S. E. Role of maternal age and pregnancy history in risk of miscarriage: prospective register based study. BMJ364, l869 (2019). - PMC - PubMed