. 2025 Oct;46(10):2820-2834.
doi: 10.1038/s41401-025-01578-8. Epub 2025 May 20.

Norcantharidin promotes M1 macrophage polarization and suppresses colorectal cancer growth

Affiliations

Norcantharidin promotes M1 macrophage polarization and suppresses colorectal cancer growth

Xiao-Man Wei et al. Acta Pharmacol Sin. 2025 Oct.

Abstract

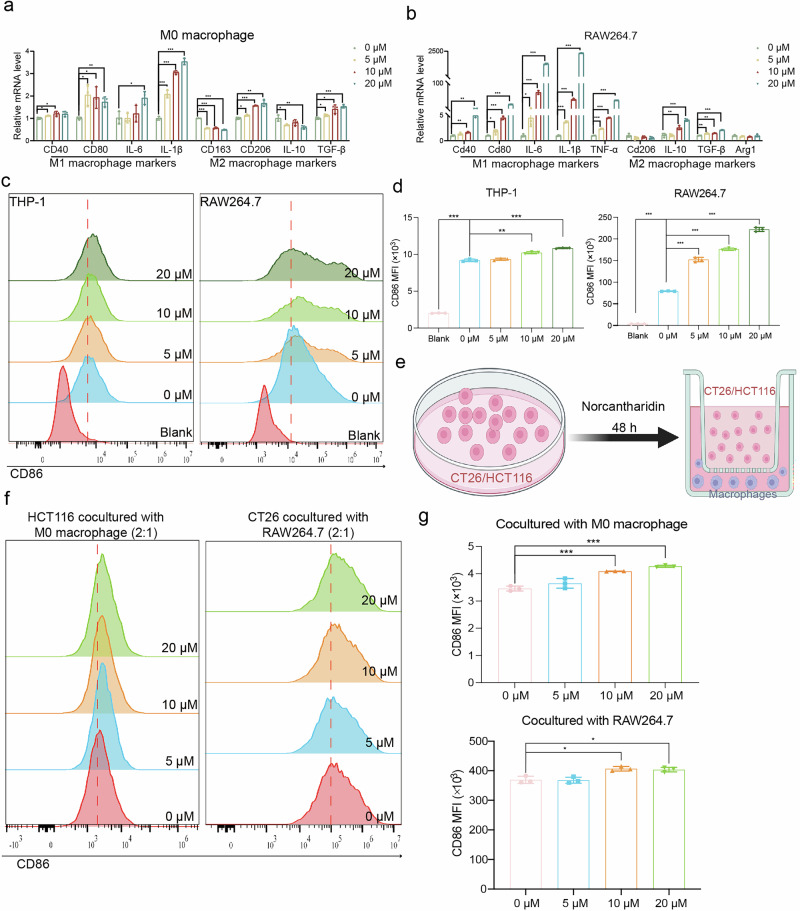
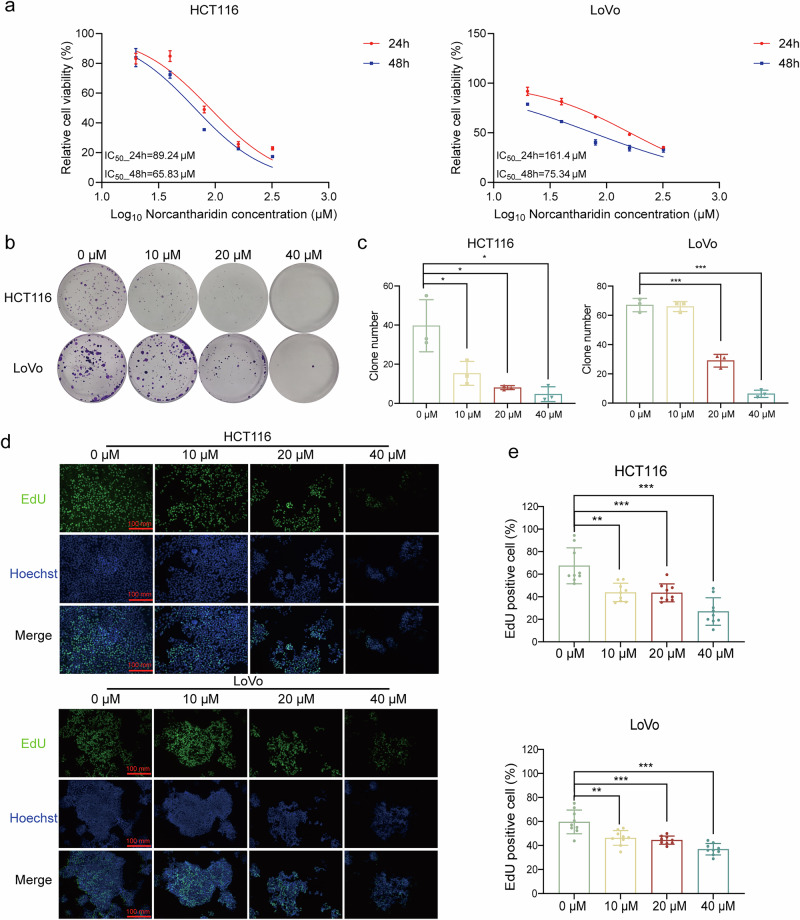
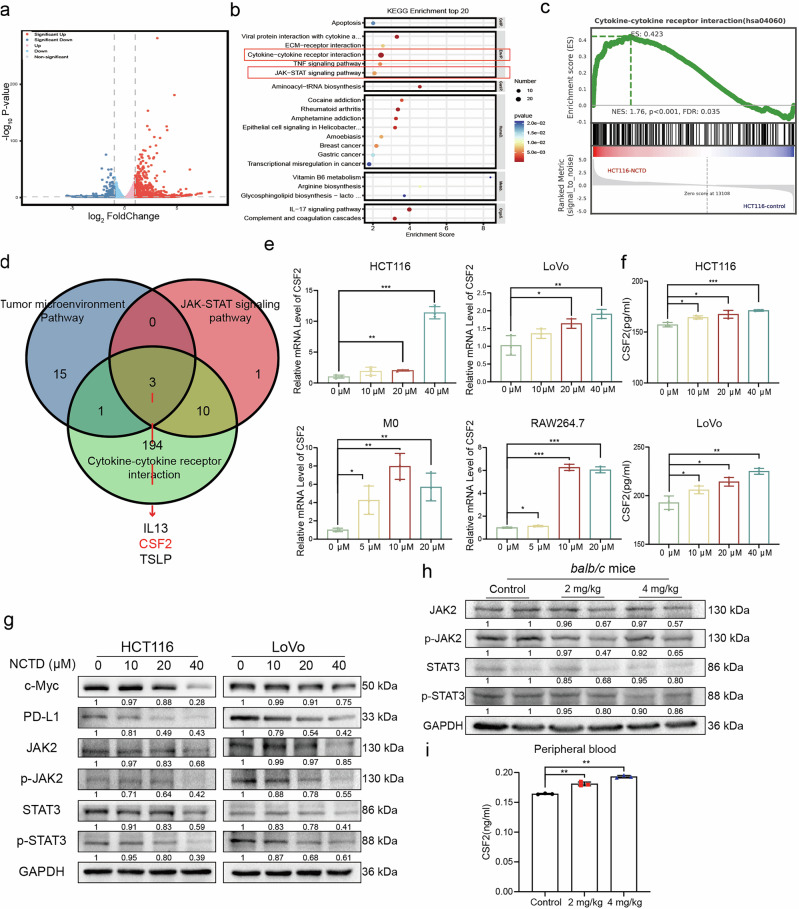
Colorectal cancer (CRC) is characterized by an immunosuppressive and inflammatory microenvironment, thus responds poorly to therapy. Previous studies show that norcantharidin (NCTD), a demethylated cantharidin (CTD) derived from Mylabris, exerts high efficacy in treating various cancers. In this study we investigated the antitumor effects of NCTD against CRC and the underlying mechanisms. Subcutaneous CRC models were established in balb/c mice using mouse colorectal cancer cell line CT26 and in balb/c nude mice using human colorectal cancer cell line HCT116. The mice were administered NCTD (2 or 4 mg·kg-1·d-1, i.p.) for 14 days. We showed that NCTD dose-dependently reduced the tumor growth in both the CRC models. Furthermore, NCTD markedly increased M1 macrophage infiltration in tumor tissue in both the CRC models. NCTD-induced macrophage M1 polarization was confirmed by flow cytometry and qPCR assays in both THP-1 cell-derived and RAW264.7 macrophage models in vitro. We demonstrated that NCTD (20, 40 μM) dose-dependently increased CSF2 secretion from CRC cells and macrophages, and suppressed the JAK2/STAT3 signaling pathway in CRC cells. Concurrently, NCTD (10-40 μM) dose-dependently inhibited CRC cell proliferation, invasion and migration in vitro. In conclusion, this study provides new evidence for the effects of NCTD against CRC and elucidates its antitumor mechanisms through remodeling the inflammatory microenvironment via CSF2-mediated macrophage M1 polarization and inhibiting JAK2/STAT3 phosphorylation in CRC cells.

Keywords: CSF2; JAK2/STAT3 pathway; M1 macrophage; colorectal cancer; norcantharidin; tumor microenvironment.


Conflict of interest statement

Competing interests: The authors declare no competing interests.

Figures

Fig. 1
Fig. 1. Antitumor activity of NCTD in vivo.
a Chemical structure of NCTD. b Representative tumor photographs from CT26 tumor-bearing mice treated with NCTD and control. c Curves of changes in tumor volume in each group (n = 5). d Weight of each group of subcutaneous tumors (n = 5). e Left: Representative CD86 immunohistochemistry images of each group of tumors (200× magnification, scale bar: 50 μm). Right: Statistical histograms of the IHC scores (n = 3). f Representative tumor photographs from HCT116 tumor-bearing mice treated with NCTD and control. g Curves of changes in tumor volume in each group (n = 5). h Weight of each group of subcutaneous tumors (n = 5). i Left: Representative CD86 immunohistochemistry images of each group of tumors (200× magnification, scale bar: 50 μm). Right: Statistical histograms of the IHC scores (n = 3). j Results of flow cytometry analysis to detect the proportion changes of M1 and M2 macrophages in tumor tissues, peripheral blood and spleen of mice. k Statistical analysis of the percentages of CD86+ macrophage cells (n = 3). Data are presented as mean ± SD. *P < 0.05, **P < 0.01, ***P < 0.001.
Fig. 2
Fig. 2. NCTD augments M1 macrophage polarization.
a, b The mRNA expression levels of M1 and M2 macrophage markers in M0 (polarized THP-1) and RAW264.7 cells were measured by qPCR, respectively (n = 3). c Flow cytometry analysis of the expression of CD86 in THP-1 and RAW264.7 cells. d The mean fluorescence intensity of CD86 quantified from c (n = 3). e Schematic illustration of macrophages coculture with NCTD-treated CRC cells. f Flow cytometry analysis of the expression of CD86 in macrophages that cocultured with CRC cells. g The corresponding quantitative analysis of CD86 by flow cytometry (n = 3). Data are presented as mean ± SD. *P < 0.05, **P < 0.01, ***P < 0.001.
Fig. 3
Fig. 3. NCTD inhibits proliferation of CRC cells.
a Cell viabilities of HCT116, LoVo cells after incubation with various concentrations of NCTD for 24 and 48 h (n = 3). b Cell proliferation was measured by colony formation in 12-well plates for 2 weeks with crystal violet staining. Representative photographs are shown. c The number of colonies was calculated using ImageJ (n = 3). d Representative fluorescence images of EdU staining (scale bar: 100 mm). e Statistical analysis of EdU positive cells was shown (n = 9). The results are presented as mean ± SD. *P < 0.05, **P < 0.01, ***P < 0.001.
Fig. 4
Fig. 4. NCTD suppresses cell migration, invasion and arrests cell cycle.
a Wound-healing experiments of HCT116 and LoVo cells for 24 h and 48 h (scale bar: 100 mm). b Cell migration rates were plotted by respective histogram (n = 3). c, d Representative images and cell count of migration assays for HCT116 and LoVo cells (scale bar: 50 μm, n = 3). e, f Representative images and cell count of invasion assays for HCT116 and LoVo cells (scale bar: 50 μm, n = 3). g, h Cell cycle of HCT116 and LoVo cells was determined by using flow cytometry (n = 3). i The expression of G2-related proteins (CDK1, Cyclin B1) was detected by Western blotting. The results are presented as mean ± SD. *P < 0.05, **P < 0.01, ***P < 0.001.
Fig. 5
Fig. 5. NCTD induces apoptosis and ROS in CRC cells.
a The representative images of cell apoptosis in HCT116 and LoVo cells for 48 h, respectively. b The statistical results of cell apoptosis assays (n = 3). c Flow cytometry analysis of mitochondrial membrane potential levels of HCT116 and LoVo cells stained with JC-1. d Statistical analysis of the red/green fluorescence signal ratio of JC-1 (n = 3). e ROS levels assessed by flow cytometry measuring DCFH-DA fluorescence in HCT116 and LoVo cells for 48 h. f Quantitative analysis of mean fluorescence intensity for ROS was shown (n = 3). g The expression of apoptosis markers (PARP, BCL-2) was detected by Western blotting. Data are presented as mean ± SD. *P < 0.05, **P < 0.01, ***P < 0.001.
Fig. 6
Fig. 6. Transcriptome analysis and validation of NCTD-regulated differentially expressed genes.
a Volcano plot for differentially expressed genes (DEGs): fold change ≥ 2, P < 0.05. b KEGG analysis for DEGs. c Enrichment results for cytokine-cytokine receptor interaction via GSEA. d Venn diagram showing the number of genes expressed in significantly enriched pathways. e qPCR analysis of CSF2 mRNA levels in HCT116, LoVo, M0 and RAW264.7 cells. f The levels of CSF2 in the culture medium of HCT116, LoVo cells as determined by ELISA assays (n = 3). g Expression levels of JAK2/STAT3 signaling pathway related proteins as determined by Western blotting. h The protein levels of JAK2, STAT3, p-JAK2 and p-STAT3 in CRC tissues measured by Western blot. i Levels of CSF2 in peripheral blood were detected by ELISA kits (n = 3). Data are presented as mean ± SD. *P < 0.05, **P < 0.01, ***P < 0.001.
Fig. 7
Fig. 7. Antitumor effects of NCTD in macrophage clearance mouse model.
a Schematic illustration of the treatment process of animal experiments. b Representative tumor photographs (n = 5). c The curves of changes in tumor volume (n = 5). d The average tumor weight (n = 5). e Results of flow cytometry analysis to detect the proportion changes of M1 and M2 macrophages in tumor tissues, peripheral blood and spleen of mice. f Statistical analysis of the percentages of CD86+ macrophage cells (n = 3). Data are presented as mean ± SD. **P < 0.01, ***P < 0.001.
Fig. 8
Fig. 8. The illustration of the mechanisms for NCTD anticancer effects on colorectal cancer.
Mechanism 1: NCTD stimulates to secretion of CSF2 from M0 macrophages and colorectal cancer cells to cause macrophage polarization toward a pro-inflammatory M1 phenotype. These activated M1 macrophages secrete anti-tumor cytokines (TNF-α, IL-1β, IL-6 etc.) to exert anti-tumor effects. Mechanism 2: Concurrently, NCTD directly inhibits JAK2/STAT3 phosphorylation in colorectal cancer cells, leading to downstream suppression of Bcl-2, c-myc, CDK1 and PD-L1, which ultimately induces apoptosis of CRC cells. These coordinated dual mechanisms highlight the multimodal anti-tumor action of NCTD on colorectal cancer.

References

    1. Siegel RL, Giaquinto AN, Jemal A. Cancer statistics, 2024. CA Cancer J Clin. 2024;74:12–49. - PubMed
    1. Siegel RL, Wagle NS, Cercek A, Smith RA, Jemal A. Colorectal cancer statistics, 2023. CA Cancer J Clin. 2023;73:233–54. - PubMed
    1. Bhat AA, Nisar S, Singh M, Ashraf B, Masoodi T, Prasad CP, et al. Cytokine- and chemokine-induced inflammatory colorectal tumor microenvironment: emerging avenue for targeted therapy. Cancer Commun. 2022;42:689–715. - PMC - PubMed
    1. Schmitt M, Greten FR. The inflammatory pathogenesis of colorectal cancer. Nat Rev Immunol. 2021;21:653–67. - PubMed
    1. Weng J, Li S, Zhu Z, Liu Q, Zhang R, Yang Y, et al. Exploring immunotherapy in colorectal cancer. J Hematol Oncol. 2022;15:95. - PMC - PubMed

MeSH terms