. 2025 May 20;25(1):665.
doi: 10.1186/s12870-025-06709-1.

Integration of lipidomics and widely targeted metabolomics provides a comprehensive metabolic landscape of Poa pratensis under cadmium stress

Affiliations

Integration of lipidomics and widely targeted metabolomics provides a comprehensive metabolic landscape of Poa pratensis under cadmium stress

Ting Cui et al. BMC Plant Biol. .

Abstract

Background: Soil cadmium (Cd) contamination poses significant environmental challenges globally. Kentucky bluegrass is considered a viable plant for remediating Cd-contaminated soils due to its high tolerance to Cd and accumulation capacity. Yet, the complete metabolic landscape underlying Cd detoxification mechanisms of Kentucky bluegrass remains incompletely understood.

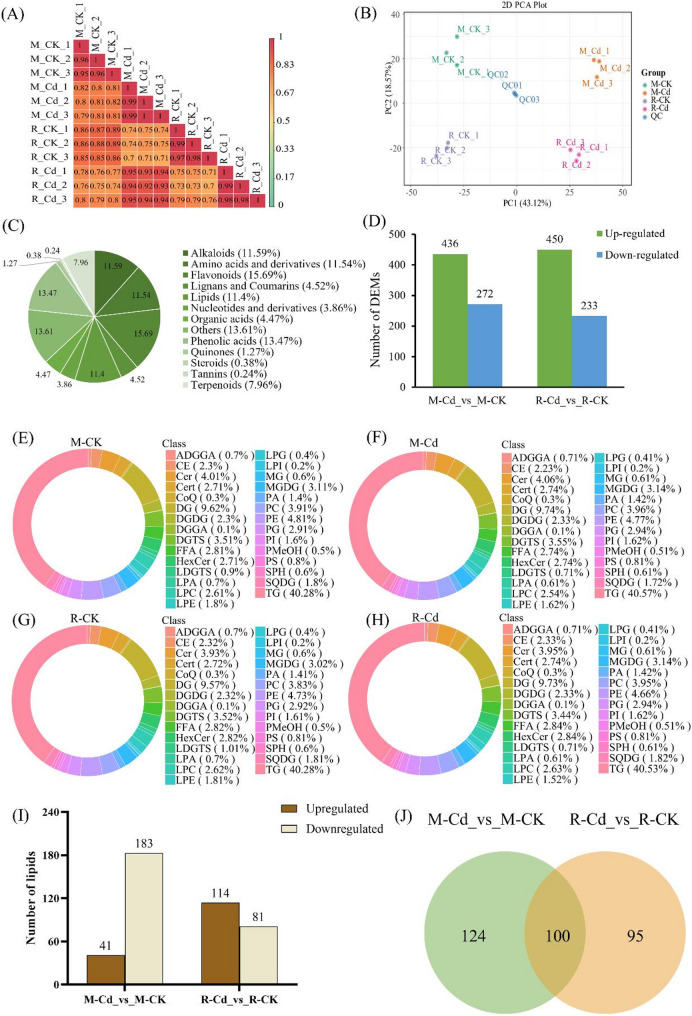
Results: Here, widely targeted metabolomics was used to identify key metabolites of Kentucky bluegrass that were responsive to Cd stress in comparisons between Cd-resistant (M) and sensitive (R) varieties. Moreover, lipidomics analyses were used to assess the content, composition, and saturation levels of lipid molecular species. The M variety exhibited higher levels of free amino acids, saccharides, and flavonoids (flavones, flavonols, isoflavones, and flavanones) after Cd stress that likely enhance its tolerance to Cd stress. Within the M variety, 183 lipid species (81%) were less abundant after Cd stress, representing a much larger number than the 81 lipid species (41.54%) similarly less abundant in the R variety. The lipid species with increased abundances primarily comprised diacylglycerols, monogalactosyldiacylglycerol, phosphatidylcholine, triacylglycerol, and lysophosphatidylcholine that exhibited higher saturation levels. Conversely, the lipid species with decreased abundances largely comprised those with shorter acyl chains including free fatty acids, phosphatidic acid, and lysophosphatidic acid, as well as those with higher unsaturation levels, including phosphatidylglycerol, diacylglycerol, triacylglycerol, phosphatidylcholine, and lysophosphatidylcholine. The elongation of these lipid acyl chains under Cd stress contributes to the increased membrane thickness and rigidity in Kentucky bluegrass, resulting from the dense packing of hydrophobic tails and enhanced lipid-lipid interactions. The changes in these metabolites and lipids may play a significant role in enhancing Cd tolerance, distribution, and accumulation in Kentucky bluegrass.

Conclusion: The results of this study provide a comprehensive metabolite profile for Kentucky bluegrass in response to Cd stress, elucidating the key metabolite characteristics essential for Cd detoxification under Cd-induced stress. Furthermore, the results provide insights into the metabolic regulation of metabolites and lipid homeostasis that contribute to enhanced Cd tolerance in Kentucky bluegrass.

Keywords: Cadmium toxicity; Kentucky bluegrass; Lipidomic; Widely targeted metabolomic.


Conflict of interest statement

Declarations. Ethics approval and consent to participate: This article does not contain any studies with animals or humans performed by any of the authors. This study complies with institutional, national and international guidelines and legislation. Consent for publication: Not applicable. Competing interests: The authors declare no competing interests.

Figures

Fig. 1
Fig. 1
Quality assessment of Kentucky bluegrass metabolomes and lipidomes under Cd stress, in addition to classification and differential expression analysis of metabolites. (A) Pearson’s correlation coefficients among samples. The numbers inside the squares are the correlation coefficients between samples, with deeper red colors indicating stronger positive correlations. (B) PCA analysis of metabolites. PC1 is the first principal component, PC2 is the second principal component, and the percentage indicates the explanatory power of each component for the overall dataset. Each point in the figure represents a sample profile, and samples from the same treatment group are shown in the same color. (C) Overall metabolite compositions. Each color represents a category of metabolites, with the size of the colored block indicating the proportion of that category. (D) Differentially expressed metabolites within the M and R varieties under Cd stress. (E-H) Proportion of lipid species in samples from different treatment groups. Each color represents a lipid subclass, with the area of the colored block indicating the proportion of that subclass among the overall profile. (I) Differential expression analyses of lipid species under Cd stress. (J) Numbers of common and unique differentially expressed lipids in the M and R varieties of Kentucky bluegrass under Cd stress. CK: control group; Cd: treatment group (600 µM of Cd stress); M: Cd-tolerant Kentucky bluegrass variety; R: Cd-sensitive Kentucky bluegrass variety; QC: quality control samples. M-Cd_vs_M-CK and R-Cd_vs_R-CK indicate comparisons of the Cd and CK treatments with the M and R varieties
Fig. 2
Fig. 2
Abundances of amino acids and saccharides in M and R varieties after Cd stress. Row-scale normalization was applied to the metabolite abundance values prior to heatmap generation. Red colors indicate increased metabolite abundances, while blue colors indicate decreased metabolite abundances. CK: control group; Cd: treatment group (600 µM of Cd stress); M: Cd-tolerant Kentucky bluegrass variety; R: Cd-sensitive Kentucky bluegrass variety
Fig. 3
Fig. 3
Hub metabolites involved in the Cd stress response of the Cd-tolerant Kentucky bluegrass variety M. (A) Pearson correlation network of DEM abundances within the Cd-tolerant varieties M. The relationships in the network represent Pearson coefficients (those that were > 0.9), where darker shades of green indicate higher enrichment. (B) The 20 most enriched metabolites after Cd stress in the Cd-tolerant variety M. (C) Classification of metabolites within the correlation network
Fig. 4
Fig. 4
Effects of Cd stress on the abundances of total lipids and different lipid species in Kentucky bluegrass. Data are expressed as means ± SE (n = 3), with different letters indicate significant differences (p < 0.05, one-way ANOVA). ADGGA: Acyl diacylglyceryl glucuronide; CE: Cholesteryl ester; Cer: Ceramide; Cert: Phytoceramide; DG: Diacylglycerol; DGDG: Digalactosyldiacylglycerol; DGGA: Diacylglyceryl glucuronide; DGTS: Diacylglyceryl trimethylhomoserine; HexCer: Hexosylceramide; LDGTS: Lysodiacylglyceryl trimethylhomoserine; LPA: Lysophosphatidic acid; LPC: Lysophophatidylcholine; LPE: Lysophosphatidylethanolamine; LPG: Lysophosphatidylglycerol; LPI: Lysophosphatidylinositol; MGDG: Monogalactosyldiacylglycerol; PA: Phosphatidic acid; PMeOH: Phosphatidylmethanol; PS: Phosphatidylserine; SPH: sphingosine; SQDG: Sulfoquinovosyl diacylglycerol; TG: Triacylglycerol. CK: control group; Cd: treatment group (600 µM of Cd stress); M: Cd-tolerant Kentucky bluegrass variety; R: Cd-sensitive Kentucky bluegrass variety
Fig. 5
Fig. 5
Abundances of lipid species in the Kentucky bluegrass M and R varieties after Cd stress. Row-scale normalization was applied to metabolite values prior to heatmap construction. Red colors indicate increased concentrations of metabolite abundance, while blue colors indicate decreased metabolite abundances. CK: control group; Cd: treatment group (600 µM of Cd stress); M: Cd-tolerant Kentucky bluegrass variety; R: Cd-sensitive Kentucky bluegrass variety. Different lipid species are shown based on different acyl chains: double bonds
Fig. 6
Fig. 6
Abundances of flavonoids in M and R varieties after Cd stress. Row-scale normalization was applied to metabolite values prior to heatmap construction. Red colors indicate increased concentrations of metabolite abundance, while blue colors indicate decreased metabolite abundances. CK: control group; Cd: treatment group (600 µM of Cd stress); M: Cd-tolerant Kentucky bluegrass variety; R: Cd-sensitive Kentucky bluegrass variety. Different lipid species are shown based on different acyl chains: double bonds

Similar articles

References

    1. Huang W, Sun D, Zhao T, Long K, Zhang Z. Spatial–temporal distribution and source analysis of atmospheric particulate-bound cadmium from 1998 to 2021 in China. Environ Geochem Health. 2024;46:44. - PubMed
    1. Liu H, Wang H, Zhou J, Zhang Y, Wang H, Li M, Wang X. Environmental cadmium pollution and health risk assessment in rice–wheat rotation area around a smelter. Environ Sci Pollut Res. 2024;31:433–44. - PubMed
    1. Jiang Z, Guo Z, Peng C, Liu X, Zhou Z, Xiao X. Heavy metals in soils around non-ferrous smelteries in China: status, health risks and control measures. Environ Pollut. 2021;282:117038. - PubMed
    1. Shi J-J, Shi Y, Feng Y-L, Li Q, Chen W-Q, Zhang W-J, Li H-Q. Anthropogenic cadmium cycles and emissions in Mainland China 1990–2015. J Clean Prod. 2019;230:1256–65.
    1. Shen C, Huang B, Hu L, Yuan H, Huang Y, Wang Y, Sun Y, Li Y, Zhang J, Xin J. Comparative transcriptome analysis and Arabidopsis thaliana overexpression reveal key genes associated with cadmium transport and distribution in root of two Capsicum annuum cultivars. J Hazard Mater. 2024;465:133365. - PubMed

LinkOut - more resources