. 2025 May 20;26(1):123.
doi: 10.1186/s10194-025-02066-4.

Induction of more severe central sensitization in a medication overuse headache model mice through active ingestion of rizatriptan

Affiliations

Induction of more severe central sensitization in a medication overuse headache model mice through active ingestion of rizatriptan

Zhenjie Ma et al. J Headache Pain. .

Abstract

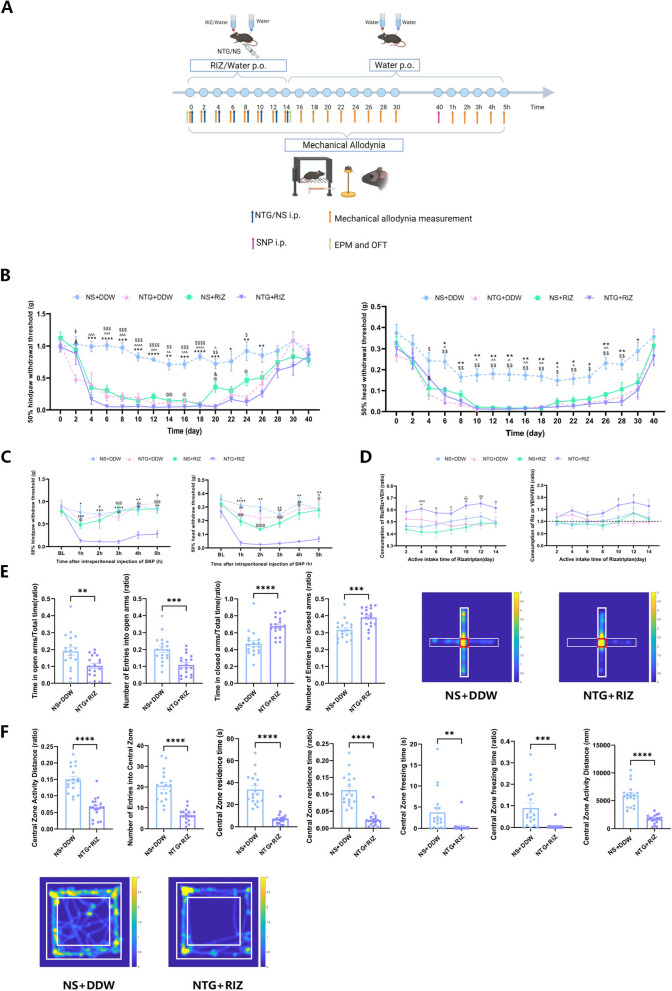
Background: Medication overuse headache (MOH) is a secondary headache disorder arising from excessive use of acute analgesics in patients with primary headache. Current animal models that predominantly employ passive drug administration fail to recapitulate the hallmark feature of voluntary medication-seeking behaviour observed clinically. Therefore, we established a novel MOH mouse model with the active ingestion of rizatriptan (RIZ) to better simulate the clinical characteristics of MOH and explore changes in brain activation patterns.

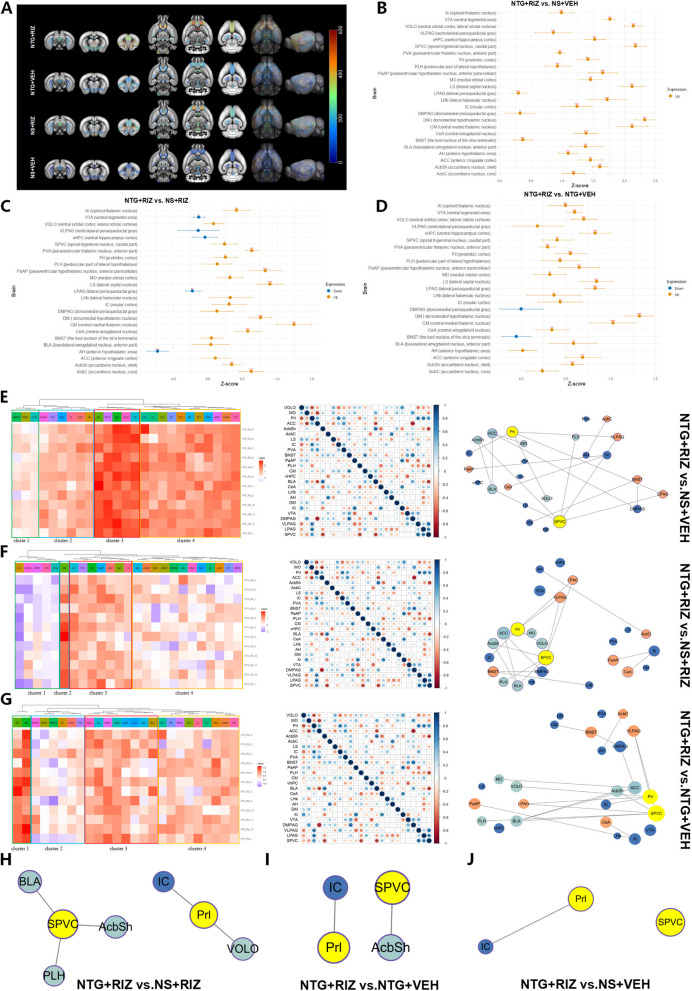
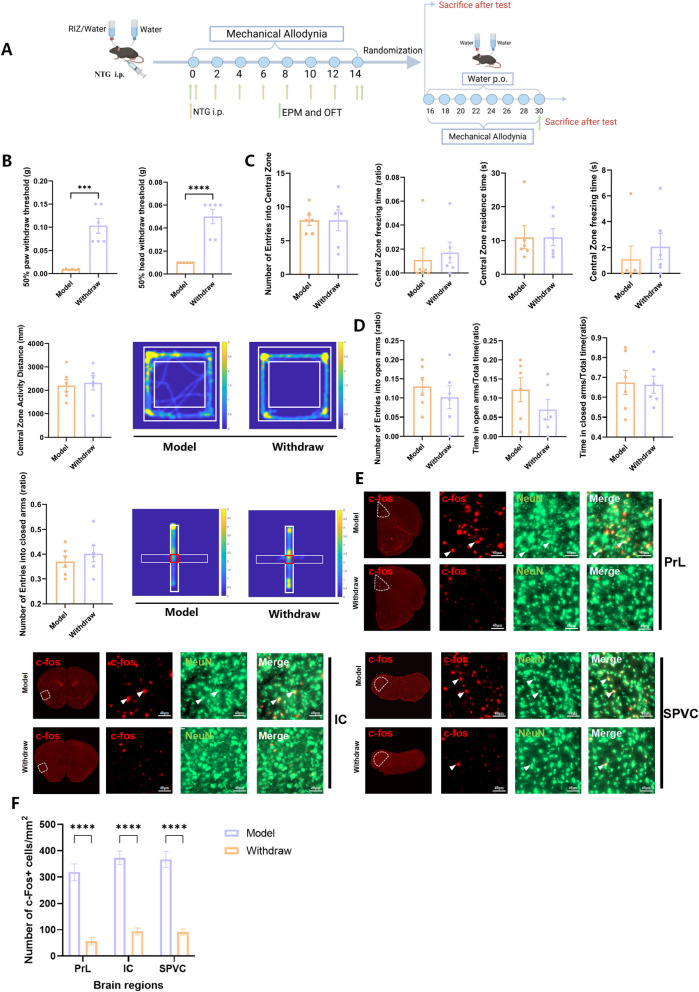
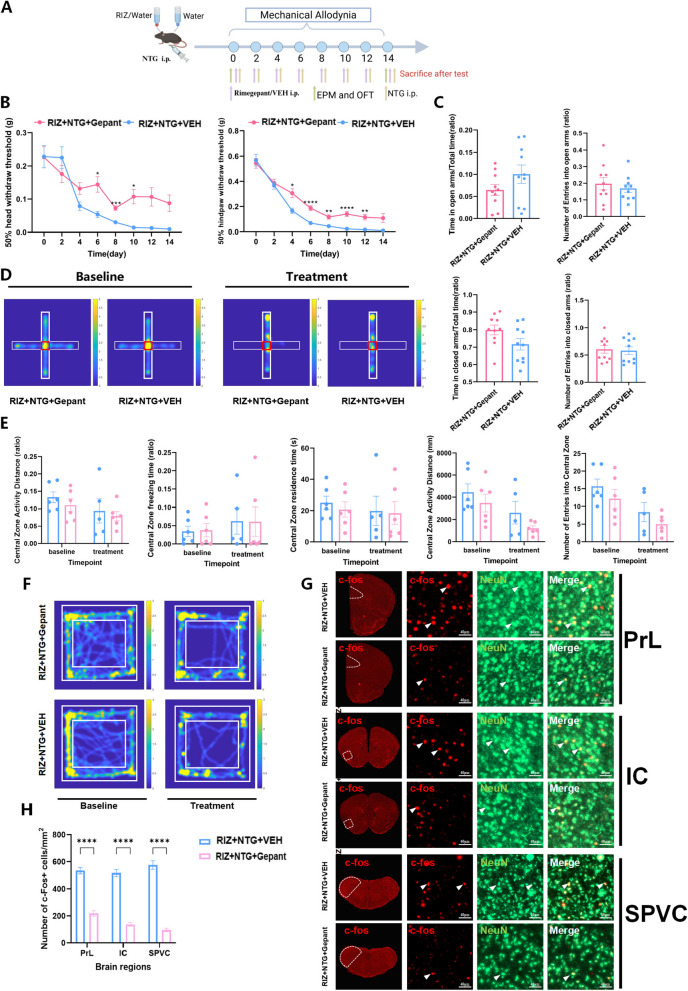
Methods: C57BL/6 J mice received intraperitoneal injections of nitroglycerin (NTG, 10 mg/kg) every other day. During the feeding period, they were provided with two bottles-one containing an RIZ solution (0.02 mg/kg) and the other containing deuterium depleted water (DDW)-allowing for voluntary intake. The bottle containing the RIZ solution was marked with a fixed colour indicator at the nozzle. Behavioural assessments included mechanical allodynia (von Frey filaments), anxiety-like behaviours (elevated plus maze, EPM and open field test, OFT), and drug-seeking quantification. Quantitative data from c-Fos immunostaining across 25 specific brain regions were subjected to Z score normalization, followed by three-tiered computational analyses: 1) hierarchical clustering (complete linkage) to characterize activation patterns, 2) Pearson correlation analysis for functional connectivity mapping, and 3) graph-theoretical network analysis (Cytoscape 3.2.1) to identify hub regions and their topological relationships. The small molecule calcitonin gene-related peptide (CGRP) receptor antagonist, rimegepant (100 mg/kg, i.p., 7 injections) was administered during the modelling period, and withdrawal of RIZ and NTG was applied after modelling to observe behavioural and histological changes.

Results: Chronic RIZ consumption exacerbated NTG-induced cutaneous allodynia, prolonged central sensitization, and increased anxiety-like behaviour. Rimegepant attenuated allodynia progression, whereas withdrawal of RIZ and NTG normalized pain thresholds. Network analysis identified the prelimbic cortex (PrL) and spinal trigeminal nucleus caudalis (SPVC) as hub nodes. The PrL exhibited extensive functional connectivity with addiction-related regions (the insular cortex, IC and nucleus accumbens), whereas the SPVC showed predominant connections with pain-processing areas.

Conclusion: This study pioneers an ethologically valid MOH model that reflects more severe central sensitization and recapitulates active medication-seeking behaviour. PrL-mediated addiction-like-behaviour pathways and SPVC-centred nociceptive processing may play roles in the development of MOH. These findings provide novel neuromodulation targets (PrL, IC, SPVC) for refractory MOH management.

Keywords: Calcitonin gene-related peptide; Hierarchical clustering; Medication overuse headache; Network analysis; Rimegepant.


Conflict of interest statement

Declarations. Ethics approval and consent to participate: The experimental procedures were approved by the Institutional Animal Care and Use Committee, Chinese PLA General Hospital, following the Regulations for the Administration of Affairs Concerning Experimental Animal. Consent for publication: Not applicable. Competing interests: The authors declare no competing interests.

Figures

Fig. 1
Fig. 1
Overuse of RIZ Enhances Potential Nociceptive Sensitization Induced by Repeated NTG Interventions A. Experimental flowchart for behavioural testing. RIZ: rizatriptan. NS: normal saline. NTG: nitroglycerin. i.p.: intraperitoneal injection. p.o.: peros. EPM: elevated plus maze. OFT: open field test. B Comparison of trends in hind paw mechanical pain thresholds over time during modelling and during withdrawal among the four groups (left). *p < 0.05, **p < 0.01, ***p < 0.001, ****p < 0.0001, NS + DDW group vs. NTG + RIZ group. $p < 0.05, $$p < 0.01, $$$p < 0.001, $$$$p < 0.0001 NS + DDW group vs. NTG + DDW group. &p < 0.05 NS + RIZ group vs. NTG + DDW group. ^p < 0.05, ^^p < 0.01, ^^^p < 0.001, ^^^^p < 0.0001 NS + DDW group vs. NS + RIZ group. @ p < 0.05, @@p < 0.01 NS + RIZ group vs. NTG + RIZ group. Comparison of trends in head mechanical pain thresholds over time during modelling and during withdrawal among the four groups (right). * p < 0.05, **p < 0.01 NS + DDW group vs. NTG + RIZ group. $p < 0.05, $$p < 0.01 NS + DDW group vs. NTG + DDW group. &p < 0.05 NS + RIZ group vs. NTG + DDW group. ^p < 0.05, ^^p < 0.01 NS + DDW group vs. NS + RIZ group. The data are presented as the means ± SEMs. n = 6 mice per group. C Changes in mechanical nociceptive thresholds in the head and hind paw regions over 5 h following SNP stimulation in the four groups of mice. *p < 0.05, **p < 0.01, ***p < 0.001, ****p < 0.0001 (NS + DDW vs. NTG + RIZ). @p < 0.05, @@p < 0.01 (NS + RIZ vs. NTG + RIZ). #p < 0.05, ##p < 0.01, ###p < 0.001 (NTG + DDW vs. NTG + RIZ). ^p < 0.05 (NS + DDW vs. NS + RIZ). The data are presented as the means ± SEMs. n = 6 mice per group. D Temporal progression of active feeding behavioural patterns in the four experimental cohorts during the model establishment phase. n = 6 mice per group. E Comparative behavioural analysis in the EPM test and movement trajectory heatmaps between the NTG + RIZ and NS + DDW groups post-modelling. The heatmap spectrum reflects the dwelling time distribution across spatial coordinates, ranging from deep blue (minimal duration) to bright yellow (maximal duration). Structural delineations: Thinner borders denote open arms, and thicker borders represent closed arms. The number of experimental animals per group was 18. F Open field behavioural comparison between the NTG + RIZ and NS + DDW groups post-modelling. The thermal gradient illustrates the spatial dwelling time from deep blue (lowest) to bright yellow (highest). The inner quadrant demarcates the central zone, with the annular region between the inner and outer quadrants defining the peripheral area. **p < 0.01, ***p < 0.001, ****p < 0.0001, NS + DDW group vs. NTG + RIZ group. n = 18 mice per group
Fig. 2
Fig. 2
Exploration of Specific Brain Regions in AI-MOHM Mice. A An illustration of the expression levels of c-Fos in 25 brain regions of the four groups of mice after the model was established is presented. n = 3 or 4 mice per group. B-D Compared with the other three groups of mice (NS + DDW group, NTG + DDW group, NS + RIZ group), the NTG + RIZ group exhibited different expression of c-Fos in 25 different brain regions (*p < 0.05, **p < 0.01, ***p < 0.001). E–G Hierarchical clustering analysis was performed on the three paired groups based on the Z-values, and brain regions with greater similarity were clustered together. The heatmap displays the correlation of log c-Fos density in 25 brain regions (selected through a literature review) across different paired groups. The correlation was colour-coded based on the Pearson coefficient. The network analysis diagram revealed significant positive correlations between regions (p < 0.05), with Pearson’s r exceeding 0.82. The thickness of the edges represented the degree of association, and the size of the nodes represents the number of connections (degree). The colour of the nodes indicates the betweenness centrality, with the spectrum ranging from dark blue (highest) to dark red (lowest). Hubs are marked in bright yellow in the diagram. H-J Brain network connectivity maps of three paired groups. Except for the bright yellow colour of the hubs, the colours of the other brain regions were consistent with the colour spectrum of the correlation heatmap. For the above related data, please refer to Supplementary Material 3
Fig. 3
Fig. 3
Withdraw Intervention Restored Cutaneous Mechanical Allodynia. A Experimental flowchart for behavioural testing and grouping. B Changes in the mechanical pain thresholds of the head and hind paw in AI-MOHM mice after 16 days of withdrawal intervention. ***p < 0.001, ****p < 0.0001, n = 6 per group. C Changes in open field behaviour and heatmap of the trajectories in AI-MOHM mice after 16 days of withdrawal intervention. The spectrum of the heat map represents how long the mice stayed at different points, ranging from dark blue (lowest) to bright yellow (highest). The inner square represents the central area, and the area composed of the outer and inner squares represents the peripheral part. n = 6 per group. D Changes in EPM behaviour and the heatmap of the trajectories of AI-MOHM mice after 16 days of withdrawal intervention. The spectrum of the heatmap represents how long the mice stayed at different points, ranging from dark blue (lowest) to bright yellow (highest). The thinner border represents the open arm, and the thicker border represents the closed arm. n = 6 per group. E. Double immunofluorescence images showing the changes in c-Fos expression in the PrL, IC, and SPVC brain regions after the withdrawal of intervention in the mice. Red fluorescence represents c-Fos, green fluorescence represents NeuN, and white triangle arrows are used to indicate co-stained neurons. The specific distribution of the brain regions is indicated by white dashed lines in the fluorescence scanning image, scale bar: 40 µm. n = 3 or 4 mice per group. F. Quantitative analysis of the relative density distribution of c-Fos in the three brain regions (n = 12 sections); ****p < 0.0001 for the Model group vs. the Withdraw group
Fig. 4
Fig. 4
Rimegepant Intervention during the Modelling Period Slowed the Decline in the Pain Threshold. A Experimental flowchart for behavioural testing. B Temporal progression of mechanical allodynia thresholds in the head and hind paw of AI-MOHM mice following rimegepant intervention during modelling. *p < 0.05, **p < 0.01, ***p < 0.001, ****p < 0.0001 RIZ + NTG + Gepant vs. RIZ + NTG + VEH. n = 12 in the RIZ + NTG + Gepant group and n = 15 in the RIZ + NTG + VEH group. C-D Comparative behavioural profiling in the EPM (C) and movement trajectory heatmaps (D) between prophylactically rimegepant-treated and control cohorts at the modelling endpoint. Heatmap gradients reflect spatial dwelling durations (spectral range: deep blue [minimum] to bright yellow [maximum]). Structural annotations: thin borders, open arms. thick borders, closed arms. n = 10 per group. E–F Open field behavioural analysis (E) and locomotion heatmaps (F) after prophylactic rimegepant administration. Thermal encoding indicates the residence time distribution (spectral range: deep blue to bright yellow). Spatial demarcations: inner quadrant, central zone; outer area between inner/outer quadrants, peripheral annular region. RIZ + NTG + Gepant group: n = 6; RIZ + NTG + VEH group: n = 5. G Dual immunofluorescence visualization of c-Fos/NeuN colocalization in the PrL (prelimbic cortex), IC (insular cortex), and SPVC (spinal trigeminal nucleus caudal subnucleus) following rimegepant intervention. Red: c-Fos; green: NeuN; white arrowheads: co-labelled neurons. The dashed white contours indicate anatomical boundaries; scale bar: 40 µm. H. Quantitative analysis of c-Fos + neuronal density in specified brain regions. n = 3 or 4 mice per group. ****p < 0.0001 RIZ + NTG + Gepant group vs. RIZ + NTG + VEH group

Similar articles

References

    1. Hagen K, Linde M, Steiner TJ, Stovner LJ, Zwart JA (2012) Risk factors for medication-overuse headache: an 11-year follow-up study. The nord-trøndelag health studies. Pain 153(1):56–61. 10.1016/j.pain.2011.08.018 - PubMed
    1. Schwedt TJ, Alam A, Reed ML et al (2018) Factors associated with acute medication overuse in people with migraine: results from the 2017 migraine in America symptoms and treatment (MAST) study. J Headache Pain 19(1):38. 10.1186/s10194-018-0865-z - PMC - PubMed
    1. Bigal ME, Serrano D, Buse D, Scher A, Stewart WF, Lipton RB (2008) Acute migraine medications and evolution from episodic to chronic migraine: a longitudinal population-based study. Headache 48(8):1157–1168. 10.1111/j.1526-4610.2008.01217.x - PubMed
    1. Radat F, Lanteri-Minet M (2010) What is the role of dependence-related behavior in medication-overuse headache? Headache 50(10):1597–1611. 10.1111/j.1526-4610.2010.01755.x - PubMed
    1. Corbelli I, Caproni S, Eusebi P, Sarchielli P (2012) Drug-dependence behaviour and outcome of medication-overuse headache after treatment. J Headache Pain 13(8):653–660. 10.1007/s10194-012-0492-z - PMC - PubMed

MeSH terms

LinkOut - more resources