

DNA methylation regulates growth traits by influencing metabolic pathways in Pacific white shrimp (Litopenaeus vannamei)
- PMID: 40394505
- PMCID: PMC12093746
- DOI: 10.1186/s12864-025-11688-6
DNA methylation regulates growth traits by influencing metabolic pathways in Pacific white shrimp (Litopenaeus vannamei)
Abstract
Background: DNA methylation is a critical epigenetic modification that dynamically regulates gene expression associated with economic traits. Pacific white shrimp (Litopenaeus vannamei) is one of the most important aquatic species for culturing, and growth trait is one of the most important economic traits for its production. However, research on DNA methylation regulation of growth traits is still at an early stage. This study explored DNA methylome dynamics and their associations with the regulatory mechanism behind growth traits using full-subfamily individuals with discrepant growth performance.
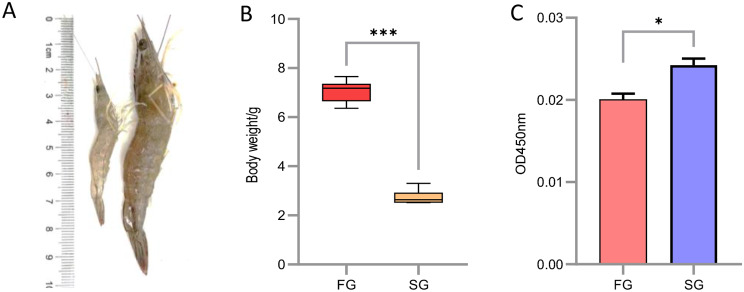
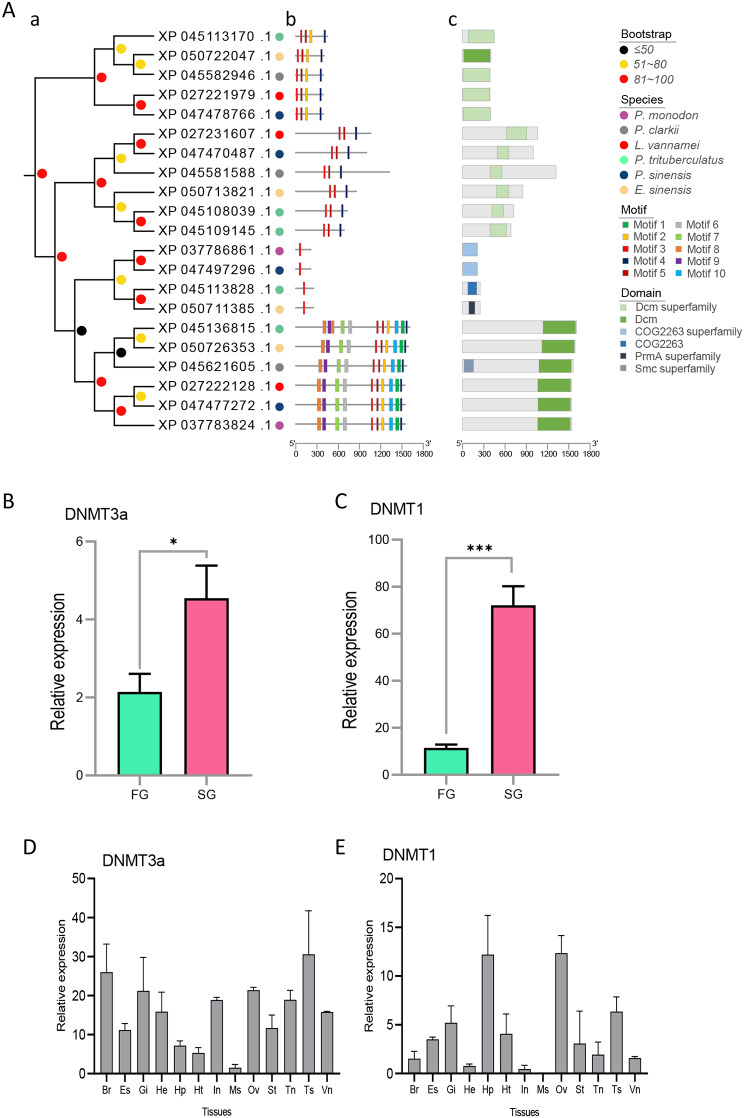
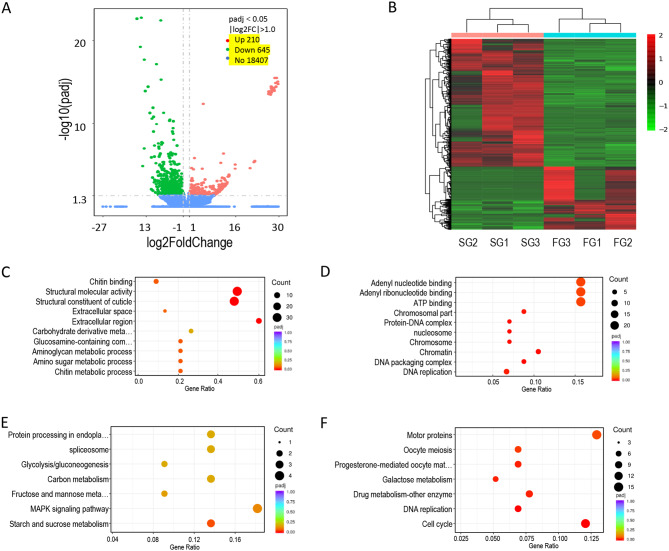
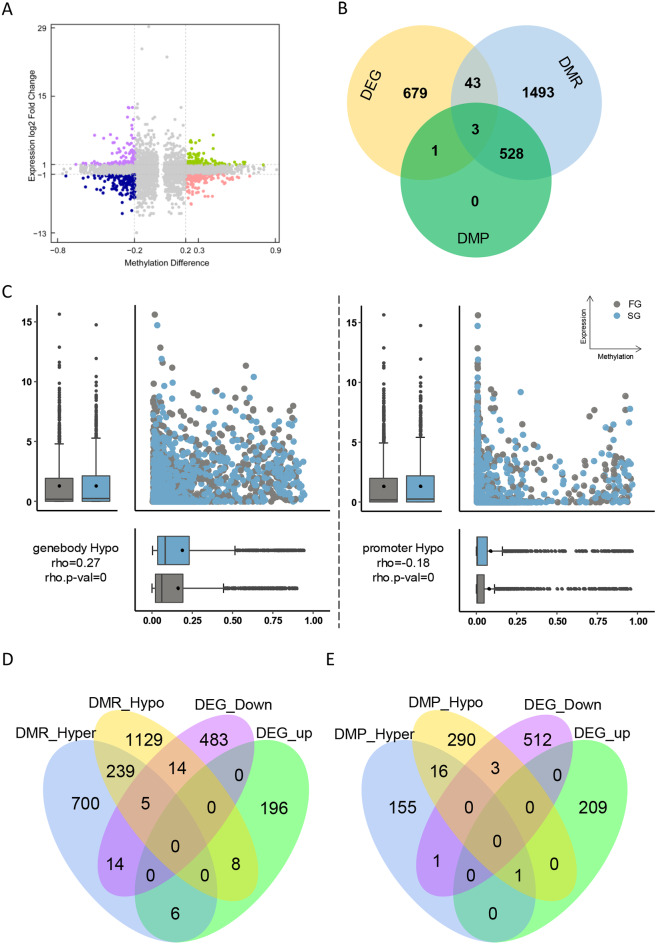
Results: The DNA methylation-related genes in L. vannamei were identified, and the expression of DNA methylation genes showed significantly higher levels in the slow growth (SG) group compared to the fast-growing (FG) individuals. The Whole Genome Bisulfite Sequencing (WGBS) analysis revealed that the methylation levels in the muscles of shrimp were notably decreased in SG individuals compared to FG individuals. A total of 532 differentially methylated promoters and 2,067 differentially methylated regions were identified. Through integrative analysis of DNA methylation and transcriptomic data from SG and FG group shrimp, a total of 47 genes were screened out with differential methylation levels (DMGs) and expression levels (DEGs). Functional enrichment analysis revealed that the overlapping DEGs/DMGs were enriched mainly in metabolic pathways, starch and sucrose metabolism, linoleic acid metabolism, ascorbate and aldarate metabolism, pentose and glucuronate interconversions.
Conclusions: DNA methylation plays a role in the regulation of growth traits in L. vannamei. The level of DNA methylation was found to be negatively correlated with growth traits. Through comprehensive analysis, it was discovered that DNA methylation predominantly affects growth performance by up-regulating the expression of genes involved in metabolic pathways, such as glucose metabolism and amino acid metabolism in L. vannamei. This suggests a higher metabolism activity in SG individuals derived DNA methylation to cope with some unknown internal stress or environmental stress rather than being allocated for growth.
Keywords: Litopenaeus vannamei; DNA methylation; Gene expression; Growth trait.
© 2025. The Author(s).
Conflict of interest statement
Declarations. Ethics approval and consent to participate: The animal experiments were conducted in accordance with the guidelines and approval of the Animal Ethics Committee of South China Sea Institute of Oceanology, Chinese Academy of Sciences. Consent for publication: Not applicable. Competing interests: The authors declare no competing interests.
Figures


Similar articles
-
Epigenetic regulation of physiological resilience to ammonia nitrogen stress in the Pacific whiteleg shrimp Penaeus vannamei: Evidence from genome-wide DNA methylation dynamics.Comp Biochem Physiol Part D Genomics Proteomics. 2025 Sep;55:101510. doi: 10.1016/j.cbd.2025.101510. Epub 2025 Apr 7. Comp Biochem Physiol Part D Genomics Proteomics. 2025. PMID: 40220697
-
Integrative Utilization of Transcriptomics and Metabolomics Sheds Light on Disparate Growth Performance of Whiteleg Shrimp, Litopenaeus vannamei.Int J Mol Sci. 2025 Mar 28;26(7):3133. doi: 10.3390/ijms26073133. Int J Mol Sci. 2025. PMID: 40243931 Free PMC article.
-
Analysis of transcriptome difference between rapid-growing and slow-growing in Penaeus vannamei.Gene. 2021 Jun 30;787:145642. doi: 10.1016/j.gene.2021.145642. Epub 2021 Apr 20. Gene. 2021. PMID: 33848570
-
Integrated Analysis of DNA Methylome and Transcriptome Reveals Epigenetic Regulation of Cold Tolerance in Litopenaeus vannamei.Int J Mol Sci. 2023 Jul 18;24(14):11573. doi: 10.3390/ijms241411573. Int J Mol Sci. 2023. PMID: 37511332 Free PMC article.
-
Cadmium exposure elicited dynamic RNA m6A modification and epi-transcriptomic regulation in the Pacific whiteleg shrimp Litopenaeus vannamei.Comp Biochem Physiol Part D Genomics Proteomics. 2024 Dec;52:101307. doi: 10.1016/j.cbd.2024.101307. Epub 2024 Aug 6. Comp Biochem Physiol Part D Genomics Proteomics. 2024. PMID: 39126882
References
-
- Ilango S, Paital B, Jayachandran P, Padma PR, Nirmaladevi R. Epigenetic alterations in cancer. FBL. 2020;25(6):1058–109. - PubMed
-
- Vanyushin BF. Epigenetics today and tomorrow. Russian J Genetics: Appl Res. 2014;4(3):168–88.
MeSH terms
Grants and funding
- E4DQ2B01/Molecular Mechanism of Rapid Growth and Stress Resistance Traits in Penaeus vannamei
- 2022-SPY-00-001/Seed Industry Revitalization Project of Provincial Rural Revitalization Strategy Special Funds
- XDB07302004/Strategic Priority Research Program of the Chinese Academy of Sciences
- 2023YFD2401701/National Key Research and Development Program of China
- 2024-MRB-00-001/Research on Breeding Technology of Candidate Species for Guangdong Modern Marine Ranching
LinkOut - more resources
Full Text Sources
