

Application of multi-omics technology in pathogen identification and resistance gene screening of sheep pneumonia
- PMID: 40394515
- PMCID: PMC12090697
- DOI: 10.1186/s12864-025-11699-3
Application of multi-omics technology in pathogen identification and resistance gene screening of sheep pneumonia
Abstract
Background: Pneumonia constitutes a major health challenge in sheep, severely compromising growth rates and overall productivity, and resulting in considerable economic losses to the sheep industry. To address this issue, the development of disease-resistant breeding programs based on the identification of genetic markers associated with pneumonia susceptibility is of critical importance. This study investigated a sheep population on a farm where pneumonia was endemic. The purpose was to use multi-omics methods to rapidly identify the principal pathogens responsible for pneumonia outbreaks, and to screen for genetic loci and key genes related to pneumonia resistance, thereby providing a scientific basis for the implementation of targeted breeding strategies for pneumonia resistance.
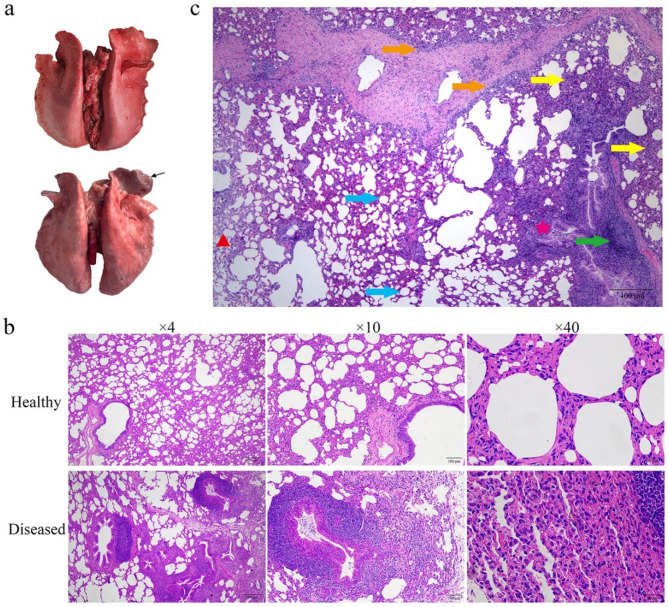
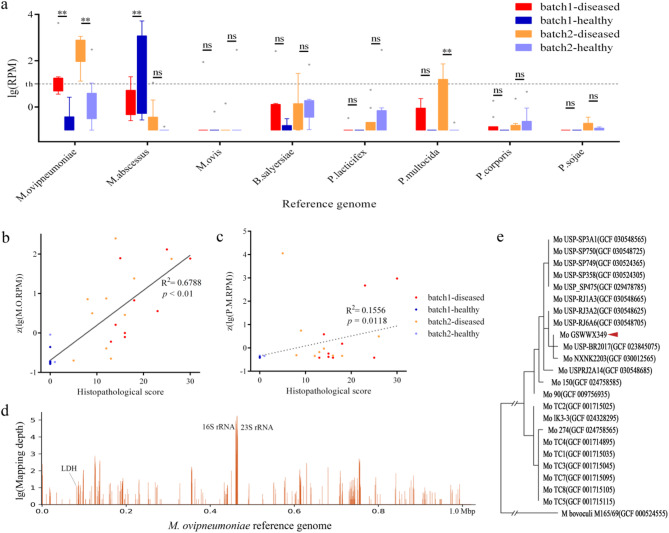
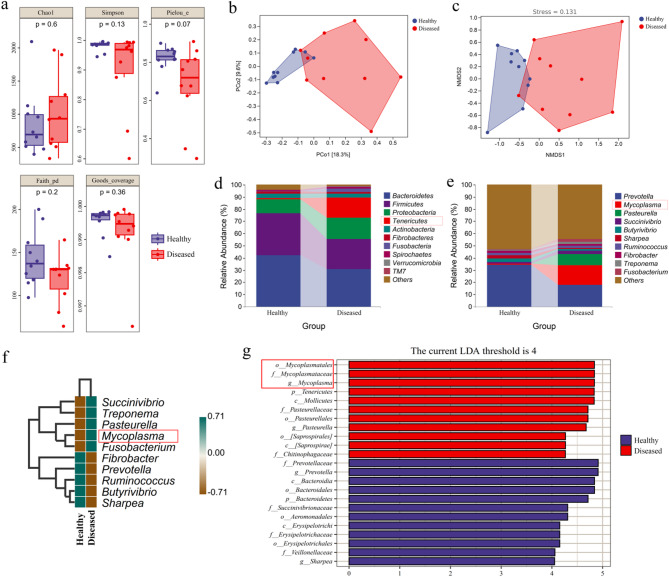
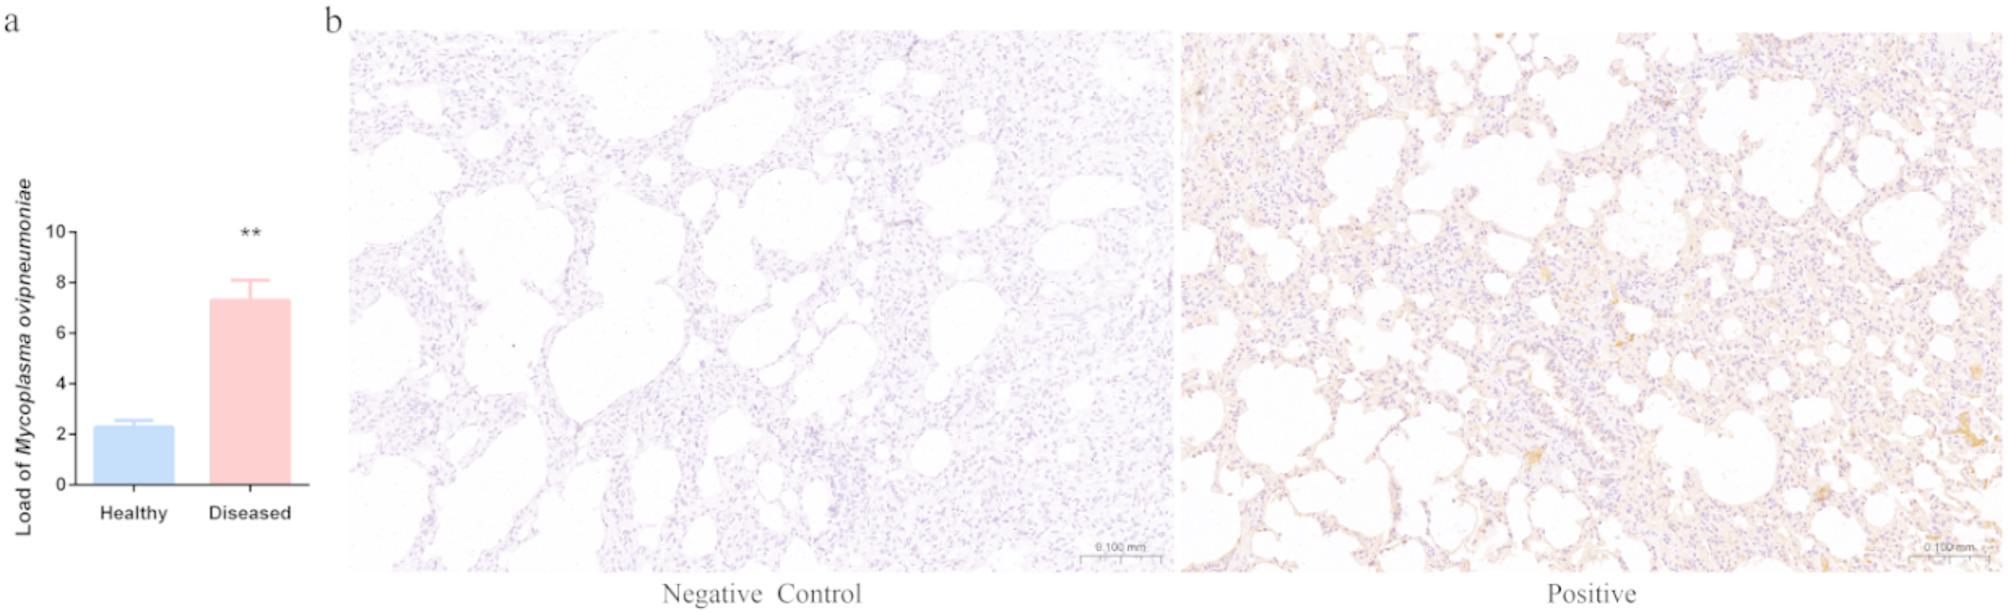
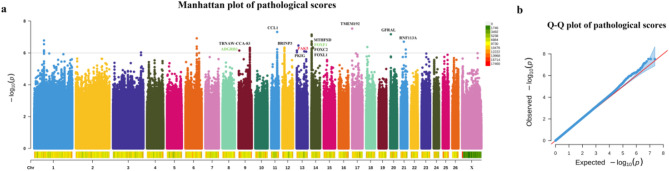
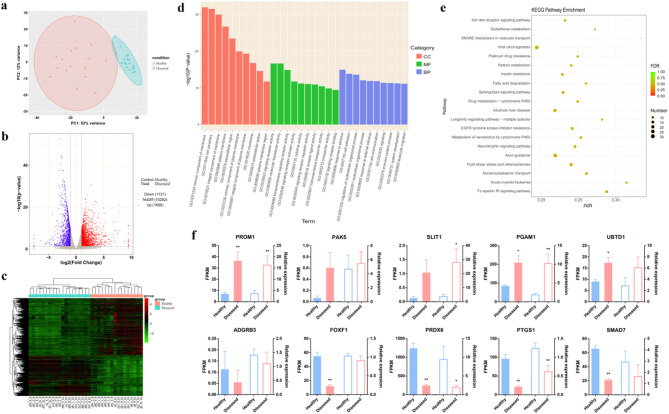
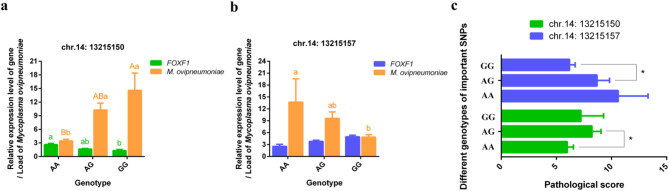
Results: Here, we assessed the impact of pneumonia on sheep growth by evaluating the pneumonia phenotypes of 912 sheep. High-throughput transcriptome sequencing of 40 lungs was conducted to obtain exogenous RNA fragments for microbial sequence alignment. Additionally, 16S rRNA sequencing was performed on lung tissues from 10 healthy and 10 diseased sheep to identify biomarkers associated with phenotypic differences. Mycoplasma ovipneumoniae was identified as the primary pneumonia pathogen, and its presence was further validated by load quantification and immunohistochemical analysis. Integration of genome-wide association study (GWAS) data from 266 lung pathological scores with transcriptome-based differentially expressed genes analysis enabled the identification of five single nucleotide polymorphisms (SNPs) and three potential candidate genes associated with Mycoplasma pneumonia. Subsequent genotyping and phenotype association analyses confirmed the significance of two SNPs and established a strong association between the FOXF1 gene and resistance to Mycoplasma pneumonia.
Conclusions: High-throughput sequencing technologies have enabled the rapid and accurate identification of the causative pathogen of sheep pneumonia. By integrating multi-omics data, two genomic loci significantly associated with Mycoplasma pneumonia were screened, as well as an anti-Mycoplasma pneumonia key gene, FOXF1.
Keywords: Mycoplasma ovipneumoniae; Disease-resistant breeding; Genome-wide association study; Multi-omics; Pathogen identification; Sheep.
© 2025. The Author(s).
Conflict of interest statement
Declarations. Ethics approval and consent to participate: All animal experiments and procedures were conducted in accordance with Chinese laws and institutional guidelines, and have been approved by the Ethics Committee of Lanzhou University (approval number: 2021-02). In addition, all samples were collected specifically for this study following standard procedures with the informed consent of the the Minqin experimental farm of Lanzhou University who owned the animals. Consent for publication: Not applicable. Competing interests: The authors declare no competing interests.
Figures
Similar articles
-
Comprehensive RNA-Seq profiling of the lung transcriptome of Bashbay sheep in response to experimental Mycoplasma ovipneumoniae infection.PLoS One. 2020 Jul 8;15(7):e0214497. doi: 10.1371/journal.pone.0214497. eCollection 2020. PLoS One. 2020. PMID: 32639963 Free PMC article.
-
Association of Mycoplasma ovipneumoniae infection with population-limiting respiratory disease in free-ranging Rocky Mountain bighorn sheep (Ovis canadensis canadensis).J Clin Microbiol. 2008 Feb;46(2):423-30. doi: 10.1128/JCM.01931-07. Epub 2007 Dec 5. J Clin Microbiol. 2008. PMID: 18057131 Free PMC article.
-
Comprehensive RNA-Seq profiling of the lung transcriptome of Argali hybrid sheep in response to experimental Mycoplasma ovipneumoniae infection.Res Vet Sci. 2020 Oct;132:57-68. doi: 10.1016/j.rvsc.2020.05.014. Epub 2020 May 21. Res Vet Sci. 2020. PMID: 32505020
-
Bighorn sheep pneumonia: sorting out the cause of a polymicrobial disease.Prev Vet Med. 2013 Feb 1;108(2-3):85-93. doi: 10.1016/j.prevetmed.2012.11.018. Epub 2012 Dec 17. Prev Vet Med. 2013. PMID: 23253148 Review.
-
Chemical genomics for studying parasite gene function and interaction.Trends Parasitol. 2013 Dec;29(12):603-11. doi: 10.1016/j.pt.2013.10.005. Epub 2013 Nov 9. Trends Parasitol. 2013. PMID: 24215777 Free PMC article. Review.
References
-
- Lewis CR, Ait-Ali T, Clapperton M, Archibald AL, Bishop S. Genetic perspectives on host responses to porcine reproductive and respiratory syndrome (PRRS). Viral Immunol. 2007;20(3):343–58. - PubMed
-
- McRae KM, Baird HJ, Dodds KG, Bixley MJ, Clarke SM. Incidence and heritability of ovine pneumonia, and the relationship with production traits in New Zealand sheep. Small Ruminant Res. 2016;145:136–41.
-
- Dassanayake RP, Shanthalingam S, Subramaniam R, Herndon CN, Bavananthasivam J, Haldorson GJ, et al. Role of Bibersteinia trehalosi, respiratory syncytial virus, and parainfluenza-3 virus in bighorn sheep pneumonia. Vet Microbiol. 2013;162(1):166–72. - PubMed
MeSH terms
Substances
Grants and funding
- 2022ZD04013/Innovation 2030-Major Project of Agricultural Biotech Breeding
- 2022ZD04013/Innovation 2030-Major Project of Agricultural Biotech Breeding
- 2022ZD04013/Innovation 2030-Major Project of Agricultural Biotech Breeding
- 2022ZD04013/Innovation 2030-Major Project of Agricultural Biotech Breeding
- 2022ZD04013/Innovation 2030-Major Project of Agricultural Biotech Breeding
- 2022ZD04013/Innovation 2030-Major Project of Agricultural Biotech Breeding
- 2022ZD04013/Innovation 2030-Major Project of Agricultural Biotech Breeding
- 2022ZD04013/Innovation 2030-Major Project of Agricultural Biotech Breeding
- 2022ZD04013/Innovation 2030-Major Project of Agricultural Biotech Breeding
- 2022ZD04013/Innovation 2030-Major Project of Agricultural Biotech Breeding
LinkOut - more resources
Full Text Sources
Medical
