

Association of psychosocial factors and biological pathways identified from rare-variant analysis with longitudinal trajectories of treatment response in major depressive disorder
- PMID: 40394516
- PMCID: PMC12090571
- DOI: 10.1186/s12888-025-06895-0
Association of psychosocial factors and biological pathways identified from rare-variant analysis with longitudinal trajectories of treatment response in major depressive disorder
Abstract
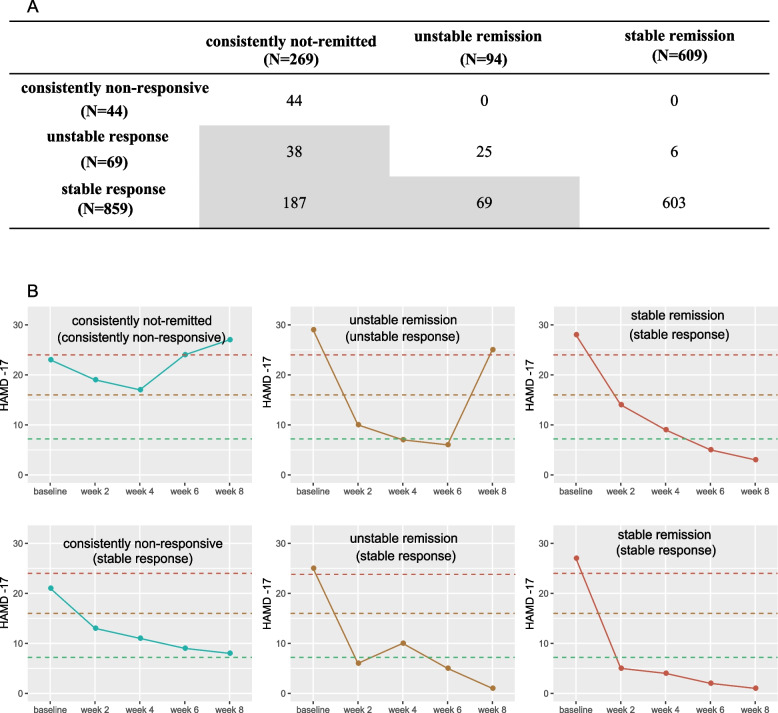
Background: Antidepressant efficacy is influenced by a multitude of factors, yet predicting treatment outcomes remains challenging. This difficulty is partly due to the commonly employed dichotomous classifications of treatment response that rely on a single primary endpoint.
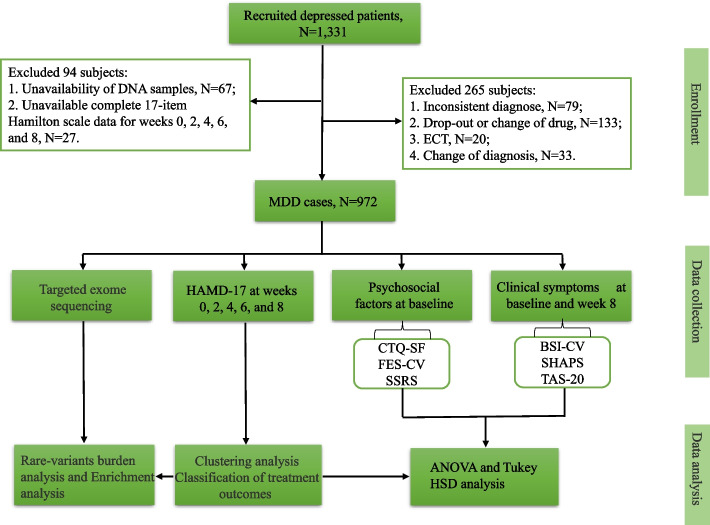
Methods: The study enrolled 972 patients diagnosed with depression, including both first-episode and recurrent cases. All patients received treatment with a single class of antidepressant medication over an eight-week period. Treatment response trajectories were identified through cluster analysis using normalized score change ratios from the 17-item Hamilton Rating Scale for Depression (HAMD-17) at baseline and weeks 2, 4, 6, and 8. The impact of psychosocial factors-including childhood trauma experience, social support, and family environment-on these response patterns was evaluated using ANOVA and Tukey's HSD tests. Additionally, targeted exome sequencing was conducted to perform rare-variant burden and enrichment analyses to investigate genetic influences on antidepressant response.
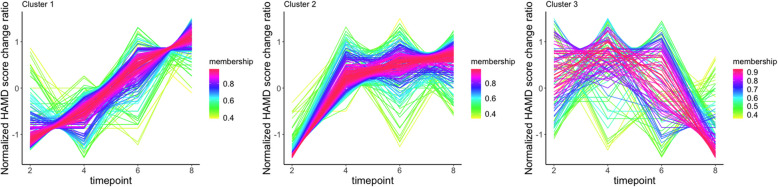
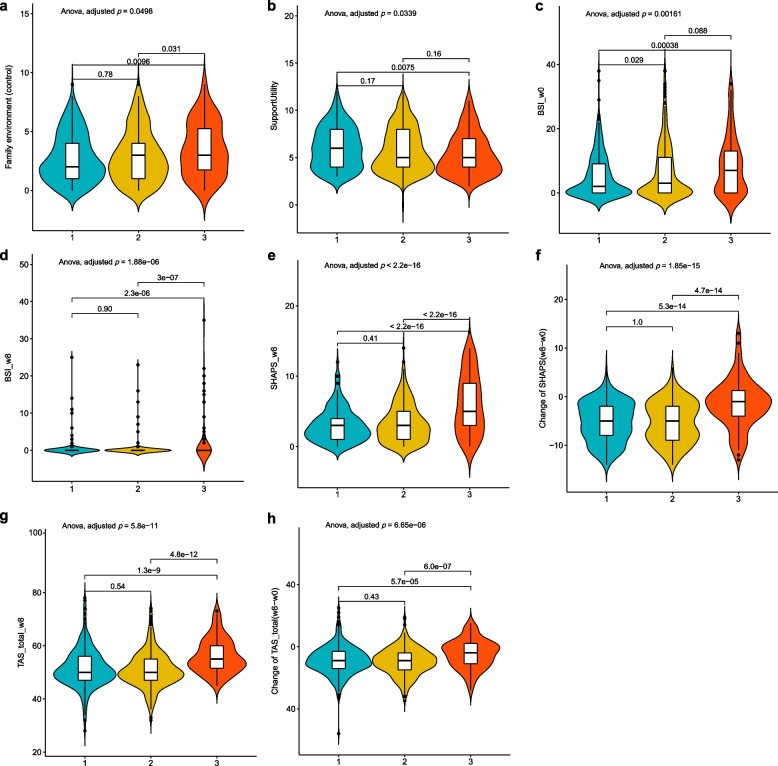
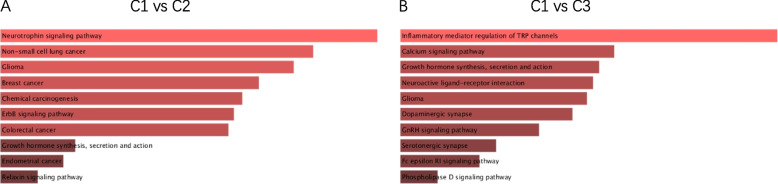
Results: Three patterns of antidepressant treatment response were identified: gradual response (C1 cluster), early response (C2 cluster), and fluctuating response (C3 cluster). Notably, patients in the C3 cluster exhibited higher levels of suicidal ideation, alexithymia, and anhedonia after the treatment period, along with the highest baseline levels of family control (a subscale of the family environment). Our rare-variant analysis revealed genes associated with response efficiency between C1 and C2 clusters to be significantly enriched in the neurotrophin signaling pathway (odds ratio = 23.94; p-adjusted = 6.96e-05). In addition, genes linked to response volatility between C1 and C3 clusters were enriched in the regulation of inflammatory mediators of transient receptor potential (TRP) channels (odds ratio = 31.5; p-adjusted = 1.83e-07).
Conclusions: Our findings suggest that patients exhibiting a fluctuating response to antidepressant treatment may endure more severe clinical symptoms throughout the treatment course. The involvement of the neurotrophin signaling pathway and TRP channels in these response patterns highlights their potential as novel targets for therapeutic intervention in depression. This underscores the importance of personalized treatment strategies that consider the underlying genetic and psychological factors influencing antidepressant efficacy.
Keywords: Antidepressant efficacy; Genetic factors; Psychosocial factors; Rare variants; Response trajectories; Target exome sequencing.
© 2025. The Author(s).
Conflict of interest statement
Declarations. Ethics approval and consent to participate: All procedures contributing to this work comply with the ethical standards of the relevant national and institutional committees on human experimentation and with the Helsinki Declaration of 1975, as revised in 2008. The study was approved by the hospital ethical committee (2016ZDSYLL100-P01), and all participants signed written informed consent. Consent for publication: Not applicable. Competing interests: The authors declare no competing interests.
Figures
Similar articles
-
Trajectories of Suicidal Ideation During 12 Weeks of Escitalopram or Nortriptyline Antidepressant Treatment Among 811 Patients With Major Depressive Disorder.J Clin Psychiatry. 2019 Jul 16;80(4):18m12575. doi: 10.4088/JCP.18m12575. J Clin Psychiatry. 2019. PMID: 31318184 Clinical Trial.
-
Influence and interaction of genetic, cognitive, neuroendocrine and personalistic markers to antidepressant response in Chinese patients with major depression.Prog Neuropsychopharmacol Biol Psychiatry. 2021 Jan 10;104:110036. doi: 10.1016/j.pnpbp.2020.110036. Epub 2020 Jul 21. Prog Neuropsychopharmacol Biol Psychiatry. 2021. PMID: 32702381
-
Novel Augmentation Strategies in Major Depression.Dan Med J. 2017 Apr;64(4):B5338. Dan Med J. 2017. PMID: 28385173 Review.
-
Anhedonia predicts poor psychosocial functioning: Results from a large cohort of patients treated for major depressive disorder by general practitioners.Eur Psychiatry. 2017 Jul;44:1-8. doi: 10.1016/j.eurpsy.2017.02.485. Epub 2017 Mar 8. Eur Psychiatry. 2017. PMID: 28535406
-
[Depressive symptoms during anorexia nervosa: State of the art and consequences for an appropriate use of antidepressants].Encephale. 2017 Feb;43(1):62-68. doi: 10.1016/j.encep.2016.02.017. Epub 2016 Jul 21. Encephale. 2017. PMID: 27452149 Review. French.
References
-
- Johnston KM, Powell LC, Anderson IM, Szabo S, Cline S. The burden of treatment-resistant depression: A systematic review of the economic and quality of life literature. J Affect Disord. 2019;242:195–210. - PubMed
-
- Pawluski JL, Lonstein JS, Fleming AS. The Neurobiology of Postpartum Anxiety and Depression. Trends Neurosci. 2017;40(2):106–20. - PubMed
-
- Emslie GJ, Mayes TL, Laptook RS, Batt M. Predictors of response to treatment in children and adolescents with mood disorders. Psychiatr Clin North Am. 2003;26(2):435–56. - PubMed
-
- Fekadu A, Rane LJ, Wooderson SC, Markopoulou K, Poon L, Cleare AJ. Prediction of longer-term outcome of treatment-resistant depression in tertiary care. Br J Psychiatry. 2012;201(5):369–75. - PubMed
MeSH terms
Substances
Grants and funding
- BE2019714/Key Research & Developement Program (Social Development) foundation of Jiangsu Province
- 82130042, 81830040/National Natural Science Key Foundation of China
- 2022ZD0211701, 2021ZD0200700/China Science and Technology Innovation 2030 - Major Project
- 2018B030334001/Science and Technology Program of Guangdong
- 82371534/National Nature Science Foundation of China
LinkOut - more resources
Full Text Sources
Medical
Miscellaneous
