

Enabling malic acid production from corn-stover hydrolysate in Lipomyces starkeyi via metabolic engineering and bioprocess optimization
- PMID: 40394595
- PMCID: PMC12093598
- DOI: 10.1186/s12934-025-02705-0
Enabling malic acid production from corn-stover hydrolysate in Lipomyces starkeyi via metabolic engineering and bioprocess optimization
Abstract
Background: Lipomyces starkeyi is an oleaginous yeast with a native metabolism well-suited for production of lipids and biofuels from complex lignocellulosic and waste feedstocks. Recent advances in genetic engineering tools have facilitated the development of L. starkeyi into a microbial chassis for biofuel and chemical production. However, the feasibility of redirecting L. starkeyi lipid flux away from lipids and towards other products remains relatively unexplored. Here, we engineer the native metabolism to produce malic acid by introducing the reductive TCA pathway and a C4-dicarboxylic acid transporter to the yeast.
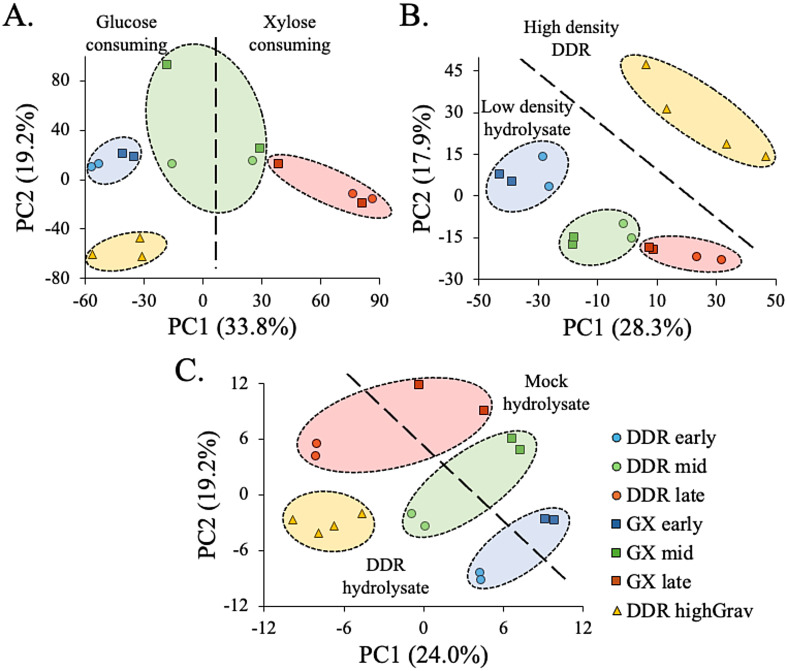
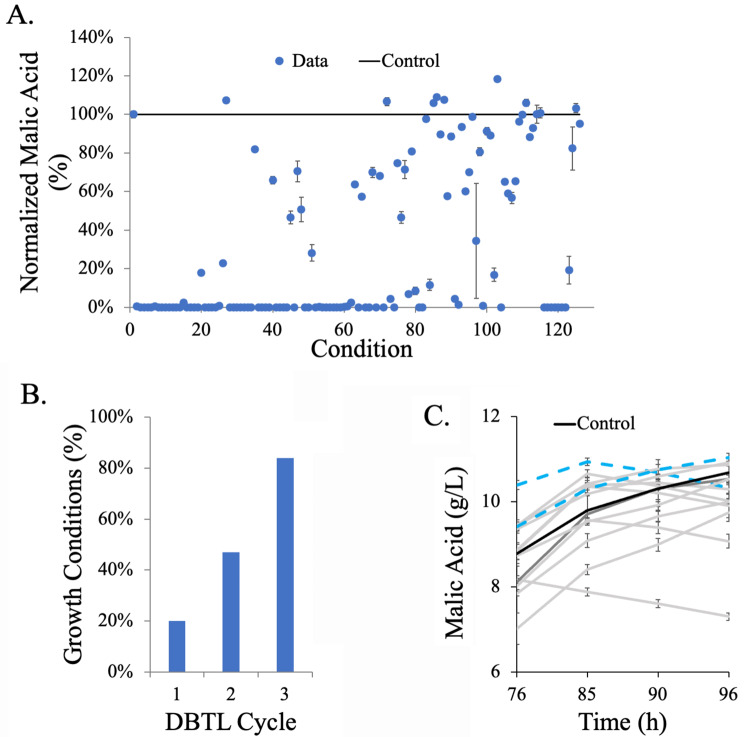
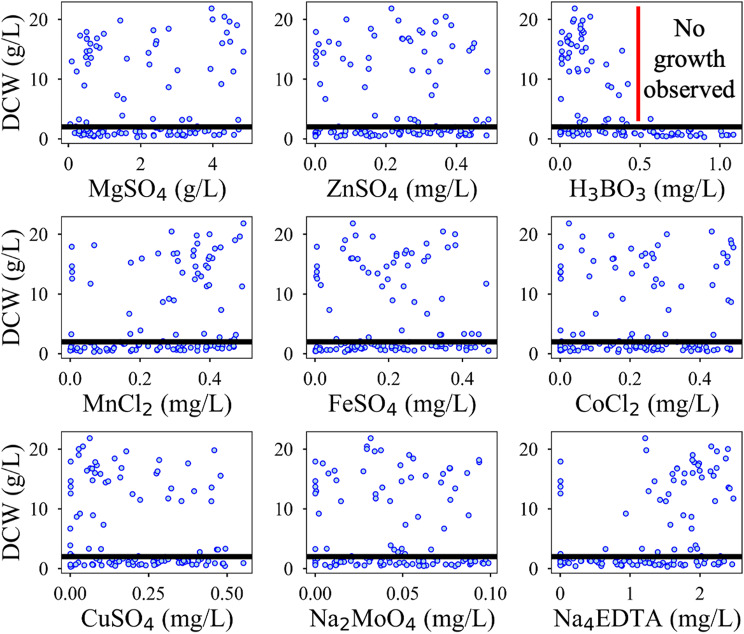
Results: Heterogeneous expression of two genes, the Aspergillus oryzae malate transporter and malate dehydrogenase, enabled L. starkeyi malic acid production. Overexpression of a third gene, the native pyruvate carboxylase, allowed titers to reach approximately 10 g/L during shaking flasks cultivations, with production of malic acid inhibited at pH values less than 4. Corn-stover hydrolysates were found to be well-tolerated, and controlled bioreactor fermentations on the real hydrolysate produced 26.5 g/L of malic acid. Proteomic, transcriptomic and metabolomic data from real and mock hydrolysate fermentations indicated increased levels of a S. cerevisiae hsp9/hsp12 homolog (proteinID: 101453), glutathione dependent formaldehyde dehydrogenases (proteinIDs: 2047, 278215), oxidoreductases, and expression of efflux pumps and permeases during growth on the real hydrolysate. Simultaneously, machine learning based medium optimization improved production dynamics by 18% on mock hydrolysate and revealed lower tolerance to boron (a trace element included in the standard cultivation medium) than other yeasts.
Conclusions: Together, this work demonstrated the ability to produce organic acids in L. starkeyi with minimal byproducts. The fermentation characterization and omic analyses provide a rich dataset for understanding L. starkeyi physiology and metabolic response to growth in hydrolysates. Identified upregulated genes and proteins provide potential targets for overexpression for improving growth and tolerance to concentrated hydrolysates, as well as valuable information for future L. starkeyi engineering work.
Keywords: Lipomyces starkeyi; Machine learning medium optimization; Malic acid production; Oleaginous yeast.
© 2025. Battelle Memorial Institute, and Lawrence Berkely National Laboratory.
Conflict of interest statement
Declarations. Ethics approval and consent to participate: Not applicable. Consent for publication: Not applicable. Competing interests: The authors declare no competing interests.
Figures


References
-
- Caporusso A, Capece A, De Bari I. Oleaginous yeasts as cell factories for the sustainable production of microbial lipids by the valorization of Agri-Food wastes. Ferment [Internet]. 2021; 7(2).
-
- Smith MT. 37 - Lipomyces lodder & Kreger-van Rij. In: Kurtzman CP, Fell JW, editors. The yeasts (Fourth Edition). Amsterdam: Elsevier; 1998. pp. 248–53.
MeSH terms
Substances
Supplementary concepts
Grants and funding
- DE-NL0030038/Office of Energy Efficiency and Renewable Energy
- DE-NL0030038/Office of Energy Efficiency and Renewable Energy
- DE-NL0030038/Office of Energy Efficiency and Renewable Energy
- DE-NL0030038/Office of Energy Efficiency and Renewable Energy
- DE-NL0030038/Office of Energy Efficiency and Renewable Energy
- DE-NL0030038/Office of Energy Efficiency and Renewable Energy
- DE-NL0030038/Office of Energy Efficiency and Renewable Energy
- DE-NL0030038/Office of Energy Efficiency and Renewable Energy
- DE-NL0030038/Office of Energy Efficiency and Renewable Energy
- DE-NL0030038/Office of Energy Efficiency and Renewable Energy
- DE-NL0030038/Office of Energy Efficiency and Renewable Energy
- DE-NL0030038/Office of Energy Efficiency and Renewable Energy
- DE-NL0030038/Office of Energy Efficiency and Renewable Energy
- DE-NL0030038/Office of Energy Efficiency and Renewable Energy
- DE-AC0205CH11231/Biological and Environmental Research
- DE-AC0205CH11231/Biological and Environmental Research
LinkOut - more resources
Full Text Sources
Miscellaneous
