. 2025 May 20;23(1):564.
doi: 10.1186/s12967-025-06537-9.

AP5Z1 affects hepatocellular carcinoma growth and autophagy by regulating PTEN ubiquitination and modulating the PI3K/Akt/mTOR pathway

Affiliations

AP5Z1 affects hepatocellular carcinoma growth and autophagy by regulating PTEN ubiquitination and modulating the PI3K/Akt/mTOR pathway

Zhipeng Quan et al. J Transl Med. .

Abstract

Background: Hepatocellular carcinoma (HCC) is a leading cause of cancer death worldwide, with high incidence and mortality rates, and the number of cases is expected to increase by 2030. Understanding the molecular mechanisms of HCC and identifying new therapeutic targets and biomarkers for HCC are crucial.

Methods: In this study, we examined adaptor-related protein complex 5 subunit ζ1 (AP5Z1) expression in liver cancer and nearby noncancerous tissues to explore its effects on HCC cell growth, death, and autophagy. The functional and molecular mechanisms of AP5Z1 were studied using clinical sample analysis, Western blot (WB), immunohistochemistry (IHC), quantitative reverse-transcription polymerase chain reaction (qRT‒PCR), coimmunoprecipitation (Co-IP), cell proliferation assays, flow cytometry (FCM), autophagy assays, electron microscopy, mass spectrometry (MS), transcriptome analysis, and animal model experiments.

Results: AP5Z1 expression was notably higher in HCC tissues than in normal tissues and was linked to a poor prognosis. The results of both in vitro and in vivo studies revealed that AP5Z1 promoted HCC cell growth and reduced apoptosis. In addition, AP5Z1 regulates cellular autophagy by ubiquitinating the phosphatase and tensin homolog (PTEN) protein and modulating the phosphoinositide 3-kinase (PI3K)/protein kinase B (Akt)/mammalian target of rapamycin (mTOR) pathway.

Conclusions: AP5Z1 influences autophagy and apoptosis in HCC cells by interacting with PTEN to modulate the PI3K/Akt/mTOR pathway. This gene might promote PTEN ubiquitination and degradation by recruiting tripartite motif-containing protein 21 (TRIM21), making it a potential biomarker for diagnosing and predicting the outcome of HCC as well as a target for new treatment strategies.

Keywords: AP5Z1; Apoptosis; Autophagy; Hepatocellular carcinoma; PI3K/Akt/mTOR signalling pathway; PTEN; TRIM21; Ubiquitination.


Conflict of interest statement

Declarations. Ethics approval and consent to participate: The study was approved by the Committee on the Ethics of the First Affiliated Hospital of Guangxi Medical University (Approval number: 2024-E754-01) on October 24, 2024. Additionally, the animal experiments were approved by the Laboratory Animal Ethics Committee of Guangxi Medical University, with the ethics number: No. 202405005. Consent for publication: Written informed consent for publication was obtained from all participants. Completing interest: All authors declared no competing interest.

Figures

Fig. 1
Fig. 1
Upregulation of AP5Z1 expression in HCC and its association with a poor prognosis. (A) Quantitative RT‒PCR validation of AP5Z1 expression in 60 pairs of cancer tissues and adjacent normal tissues. (B) Kaplan–Meier survival analysis showing the OS rates of 60 HCC patients stratified by the AP5Z1 expression level. (C) Western blot analysis of AP5Z1 expression in eight pairs of hepatocellular carcinoma tissues and adjacent normal tissues. (D) Representative images of AP5Z1 expression in tumour tissues and adjacent normal tissues as determined by IHC staining. Scale bar = 250 μm (Left). Scale bar = 50 μm (right). (E) Analysis of AP5Z1 expression in normal liver cells (MIHAs) and five cancer cell lines (Huh7, SUN-449, MHCC97H, LM3, and SUN-182) via RT‒PCR. (F) Analysis of AP5Z1 expression in normal liver cells (MIHAs) and five cancer cell lines (Huh7, SUN-449, MHCC97H, LM3, and SUN-182) using Western blotting. (G-J) TCGA analysis: AP5Z1 is upregulated in tumors (n = 371) vs. normal (n = 50) (G), higher in metastatic (N1, n = 4) vs. non-metastatic (N0, n = 252) tumors (H), and increases with histological grade (G1-G4, n = 55/177/122/12) (I) and TNM stage (T1-T4, n = 181/94/80/13) (J). (K-L) High AP5Z1 correlates with reduced OS and DFS. The results are shown as the mean ± standard error (SE) of three separate experiments. Significance levels are denoted by * for P < 0.05, ** for P < 0.01, and *** for P < 0.001
Fig. 2
Fig. 2
Influence of AP5Z1 on the in vitro proliferation of HCC cells. (A) Assessment of the impact of AP5Z1 on HCC cell proliferation through colony formation tests. (B) CCK-8 assay to determine the influence of AP5Z1 on the proliferation of HCC cells. (C) The EdU incorporation test was used to assess the effect of AP5Z1 on DNA synthesis in hepatocellular carcinoma cells. Scale bar = 100 μm. (D) FCM analysis of the regulatory effect of AP5Z1 on the HCC cell cycle. (F) FCM was used to assess the effect of AP5Z1 on the apoptosis of HCC cells. In addition, WB analysis was conducted to evaluate the influence of AP5Z1 expression on proteins associated with the cell cycle and apoptosis in HCC cells (E, G). The results are shown as the mean ± standard error (SE) of three separate experiments. Significance levels are denoted by * for P < 0.05, ** for P < 0.01, and *** for P < 0.001
Fig. 3
Fig. 3
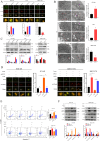
AP5Z1 inhibited autophagy in HCC cells and modulated apoptosis through autophagic pathways. (A) The distribution of GFP–mCherry–LC3B in transfected cells was observed under an inverted fluorescence microscope. Scale bar = 20 μm. (B) TEM was used to observe the effect of AP5Z1 on autophagy in cells. The arrows indicate autophagosomes or autolysosomes. Scale bar = 2 μm. (C) WB analysis was conducted to assess the effects of AP5Z1 expression on the levels of autophagy-related proteins in HCC cells. (D) After the KD or OE of AP5Z1, the cells were treated with 3-MA(5mM,12 h treatment) or RAPA(10ng/ml,12 h treatment), and the distribution of GFP–mCherry–LC3B was examined under an inverted fluorescence microscope. Scale bar = 20 μm. (E, F) After the KD or OE of AP5Z1, cells were treated with 3-MA(5mM,12 h treatment)/RAPA(10ng/ml,12 h treatment). The apoptosis rate was subsequently assessed using Annexin V/PI double staining (E), while WB analysis was used to detect proteins associated with apoptosis and autophagy (F). The results are shown as the mean ± standard error (SE) of three separate experiments. Significance levels are denoted by * for P < 0.05, ** for P < 0.01, and *** for P < 0.001
Fig. 4
Fig. 4
AP5Z1 modulates cellular apoptosis and autophagy via the PTEN/PI3K/Akt/mTOR signalling cascade. (A) KEGG pathway enrichment analysis of genes regulated by AP5Z1, as visualized in a bubble chart. (B) WB analysis was performed to examine the effects of AP5Z1 knockdown and overexpression on the PI3K/Akt/mTOR signaling pathway. (C) WB analysis was performed to examine the effects of LY294002 (25 µM,24 h treatment) on the PI3K/Akt/mTOR signaling pathway in AP5Z1-overexpressing cellular models. (D) Identification of AP5Z1-binding proteins isolated from MHCC-97 H cell lysates through silver staining. The red arrow denotes the specific binding band of AP5Z1 and PTEN. IgG served as a negative control. (E) Verification of the presence of AP5Z1 and PTEN in the coprecipitated complex was conducted via Co-IP. (F) WB analysis analysis showing the effect of AP5Z1 OE or KD on PTEN levels. (G) WB analysis of the effects of AP5Z1 KD or OE and subsequent PTEN rescue on total and phosphorylated proteins within the PI3K/Akt/mTOR signalling pathway. (H) WB analysis evaluating the influence of AP5Z1-mediated PTEN rescue on proteins associated with apoptosis and autophagy. The results are shown as the mean ± standard error (SE) of three separate experiments. Significance levels are denoted by * for P < 0.05, ** for P < 0.01, and *** for P < 0.001. NS for P > 0.05
Fig. 5
Fig. 5
AP5Z1 facilitated PTEN protein degradation via TRIM21-mediated ubiquitination. (A) RT‒qPCR analysis of PTEN mRNA expression levels in AP5Z1-knockdown or AP5Z1-overexpressing HCC cells. (B) WB analysis of PTEN levels in AP5Z1 knockdown and control SUN-449 and LM3 cells stimulated with MG132 (10 µM) for 6 h. (C) The half-life of the PTEN protein was determined in AP5Z1-knockdown, AP5Z1-overexpressing, and control HCC cells using a 10 µM cycloheximide (CHX)-chase assay. (D) Ubiquitination levels of PTEN in AP5Z1-knockdown or AP5Z1-overexpressing SUN449 cells transfected with the corresponding plasmids (48 h) and treated with MG132 (10 µM, 6 h treatment). (E) Co-IP experiments demonstrated the endogenous interaction among AP5Z1, TRIM21, and PTEN. (F) Western blot analysis was performed to determine the effects of TRIM21 knockdown or overexpression on PTEN expression levels. (G) Ubiquitination levels of PTEN in AP5Z1-knockdown SUN-449 cells treated with MG132 (10 µM, 6 h treatment). (H) Ubiquitination levels of PTEN in TRIM21-knockdown SUN-449 cells treated with MG132 (10 µM, 6 h treatment). (I) Ubiquitination levels of PTEN in AP5Z1- and TRIM21-overexpressing MHCC-97 H cells treated with MG132 (10 µM, 6 h treatment). The results are shown as the mean ± standard error (SE) of three separate experiments. Significance levels are denoted by * for P < 0.05, ** for P < 0.01, and *** for P < 0.001. NS for P > 0.05
Fig. 6
Fig. 6
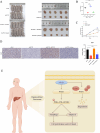
AP5Z1 facilitates HCC tumorigenesis via the modulation of PTEN. (A–C) Tumour formation assays in nude mice were conducted to validate the effect of the AP5Z1–PTEN interaction on HCC tumorigenesis (n = 5) (A). Measurements of tumour weight (B) and tumour growth rate (C) were recorded. (D) IHC analysis was performed to assess the expression levels of the proliferation marker Ki-67 in the transplanted tumours. Scale bar = 50 μm. (E) Schematic illustration of the mechanism by which AP5Z1 influences apoptosis and autophagy in HCC cells (By Fig draw). The in vivo studies utilized a four-group design with 5 biologically independent animals per group, whereas the in vitro analyses included three separate experiments. The data are expressed as the means ± SEMs. Significance levels are denoted by * for P < 0.05, ** for P < 0.01, and *** for P < 0.001

Similar articles

References

    1. Siegel RL, Miller KD, Jemal A. Cancer statistics, 2019. CA Cancer J Clin. 2019;69:7–34. - PubMed
    1. Valery PC, Laversanne M, Clark PJ, Petrick JL, McGlynn KA, Bray F. Projections of primary liver cancer to 2030 in 30 countries worldwide. Hepatology. 2018;67:600–11. - PMC - PubMed
    1. Sun J, Zhou C, Zhao Y, Zhang X, Chen W, Zhou Q, Hu B, Gao D, Raatz L, Wang Z, et al. Quiescin sulfhydryl oxidase 1 promotes sorafenib-induced ferroptosis in hepatocellular carcinoma by driving EGFR endosomal trafficking and inhibiting NRF2 activation. Redox Biol. 2021;41:101942. - PMC - PubMed
    1. Du A, Li S, Zhou Y, Disoma C, Liao Y, Zhang Y, Chen Z, Yang Q, Liu P, Liu S, et al. M6A-mediated upregulation of circmdk promotes tumorigenesis and acts as a nanotherapeutic target in hepatocellular carcinoma. Mol Cancer. 2022;21:109. - PMC - PubMed
    1. Li Y, Guo M, Qiu Y, Li M, Wu Y, Shen M, Wang Y, Zhang F, Shao J, Xu X, et al. Autophagy activation is required for N6-methyladenosine modification to regulate ferroptosis in hepatocellular carcinoma. Redox Biol. 2024;69:102971. - PMC - PubMed

MeSH terms